USDCAD still going DOWN.USDCAD is in a pullback and showing signs of pulling back down with about 1:2 RR.
Cryptocurrency

HYPERLIQUID Massive H&S targets $30 and $19 long-term.Hyperliquid (HYPEUSD) has formed a Head and Shoulders (H&S) pattern, a highly symmetrical structure that is has completed its Right Shoulder. At the same time, a Channel Down has emerged that is aiming for a -43.87% decline on the current Bearish Leg, similar to the previous one, targeting $30.00 short-term.
The H&S long-term Target is the 2.0 Fibonacci extension, which as you can see matches the 0.618 Fib from the April 07 bottom. That gives a $19.00 Target.
Notice the huge 1D RSI Bearish Divergence of Lower Highs since May 25, which further strengthens the long-term bearish trend.
---
** Please LIKE 👍, FOLLOW ✅, SHARE 🙌 and COMMENT ✍ if you enjoy this idea! Also share your ideas and charts in the comments section below! This is best way to keep it relevant, support us, keep the content here free and allow the idea to reach as many people as possible. **
---
💸💸💸💸💸💸
👇 👇 👇 👇 👇 👇

#BTC 95-96K 3-DRIVE IS NOT EXCLUDEDMorning folks,
So, as we suggested BTC has shown healthy downside action out from 106K resistance area. Despite good news around shutdown, BTC shows limited reaction. Even more, I would say that 3-Drive pattern on daily chart is not excluded, down to 94-96K area.
This pattern fits well to idea of weekly H&S pattern ... On 4H in a few hours we could get a bearish grabber as well .
So, I wouldn't be too fast on long entry right now and prefer to wait for confirmation. It might be upside breakout of 108K area at least, just to erase all "bearish suspicions" around...
For short entry, if you want - try to catch the grabber or take position as close to 108K local top (and 2nd Drive top) as possible. This is invalidation point for bearish scenario.
Take care.
S.

ALTcoin Dominance Is On The Rise; ALTseason?BTC.dominance is coming down, while ALTcoin.dominance is on the rise, so ALTcoins could be doing better than Bitcoin in upcoming days/weeks, but for the real ALTseason, we need Crypto TOTAL market cap chart back to bullish mode.
OTHERS.D chart - ALTcoin dominance is breaking channel resistance line, so some ALTcoins are already nicely recovering, although Bitcoin is still searching for support.
As you can see, even OTHERS Crypto TOTAL market cap chart, which excludes top10 cryptocurrencies, is looking for a continuation higher after the recent complex w-x-y correction.
So, if it manages to break back above channel resistance line near 260B area, then ALTseason could be here, especially if Bitcoin starts recovering as well.

GOLD break all time high!GOLD is back on the rise. Lets's see if after news it will continue rising and a potential all time high.

BTC MARKET UPDATEThe bears couldn't push the price below 16800 Support. The price bounced from the 16800 support due to the massive BUY ORDER BLOCK and moved above the 17000 key level. If we notice the daily timeframe then the price is under the consolidation box for a long time, any movement outside this box with a strong confirmation will be massive (whether upside or downside) Trade Carefully and Stay Tuned!

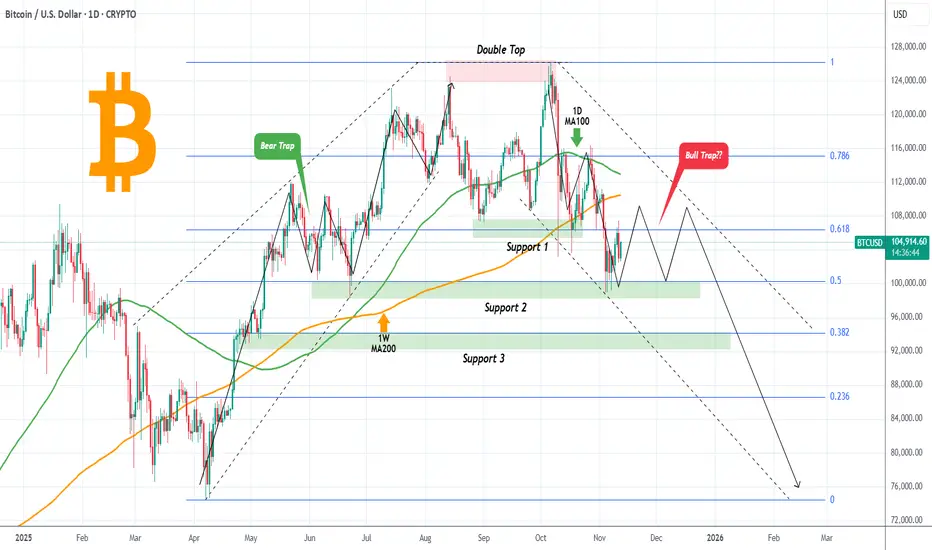
BITCOIN Is it following a symmetric downtrend?Bitcoin (BTCUSD) recently broke below the $100000 level for the first time since June and is currently on a short rebound. It has turned however all major MAs both the 1D MA100 (green trend-line) and 1D MA200 (orange trend-line) into Resistances, so the downtrend remains.
By doing so, we can see a highly symmetric pattern emerging, the inverse of the April - August uptrend. Following the (nearly) October 06 Double Top, the symmetrical downtrend has been testing and respecting all subsequent Support levels (so far Support 1 and 2), filling at the same time all Fibonacci gaps. See how accurately those Fibs formed key demand levels during the uptrend.
As a result, if this symmetry continues to hold, we can expect BTC to trade sideways for another month between Support 2 (Fib 0.5) and $110000 (roughly) before making the next leg down. Such price behavior typically confuses market participants and traps traders who stick to the former trend and haven't adapted yet.
Will it happen this time also and this potential ranged trading trap more buyers? Feel free to let us know in the comments section below!
---
** Please LIKE 👍, FOLLOW ✅, SHARE 🙌 and COMMENT ✍ if you enjoy this idea! Also share your ideas and charts in the comments section below! This is best way to keep it relevant, support us, keep the content here free and allow the idea to reach as many people as possible. **
---
💸💸💸💸💸💸
👇 👇 👇 👇 👇 👇
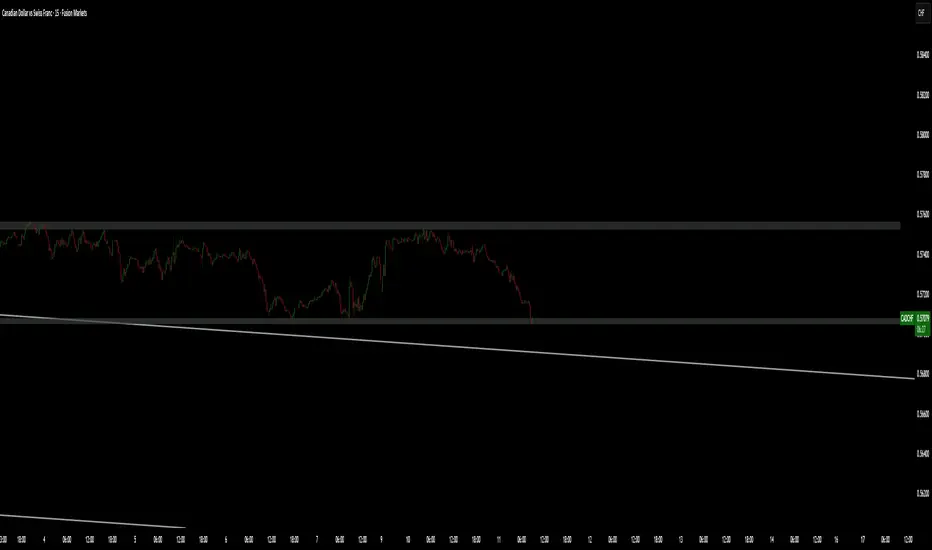
GBPCHFGBPCHF at a major SUPPORT zone. Getting some confirmation for reversal. Also looking for a Break of pattern.

LTC/USDT | Litecoin Up Over 35%! Can It Keep Climbing?By analyzing the #Litecoin chart on the weekly timeframe, we can see that after the last analysis, the price continued its rally from $88, hitting the targets of $97 and $106, and even reaching up to $114, coming close to the third target.
Currently, LTC is trading around $101, and it’s important to see if the price can hold above $100. If it does, we can expect further upside, with the next targets at $113, $118, and $136.
The overall gain from this analysis has been over 35%, and I hope you’ve made the most of it!
Please support me with your likes and comments to motivate me to share more analysis with you and share your opinion about the possible trend of this chart with me !
Best Regards , Arman Shaban

SOLANA entered into bearish territory, targeting $105.Solana (SOLUSD) closed last week below its 1W MA50 (blue trend-line) for the first time since July 28 2025. This is an extension of the downtrend that started following the September 15 High, which took place right below the Resistance Zone that started back on the November 2021 Cycle Top.
This is a critical Resistance as it rejected the price another 2 times during this Bull Cycle, with the most recent causing the January - April correction to the 1W MA200 (orange trend-line).
Given the huge 1W RSI Bearish Divergence for almost 2 years now (Lower Highs), we expect last week's closing below the 1W MA50 to initiate the bearish extension towards the 1W MA200 (at least) again. Our Target is $105.00.
---
** Please LIKE 👍, FOLLOW ✅, SHARE 🙌 and COMMENT ✍ if you enjoy this idea! Also share your ideas and charts in the comments section below! This is best way to keep it relevant, support us, keep the content here free and allow the idea to reach as many people as possible. **
---
💸💸💸💸💸💸
👇 👇 👇 👇 👇 👇

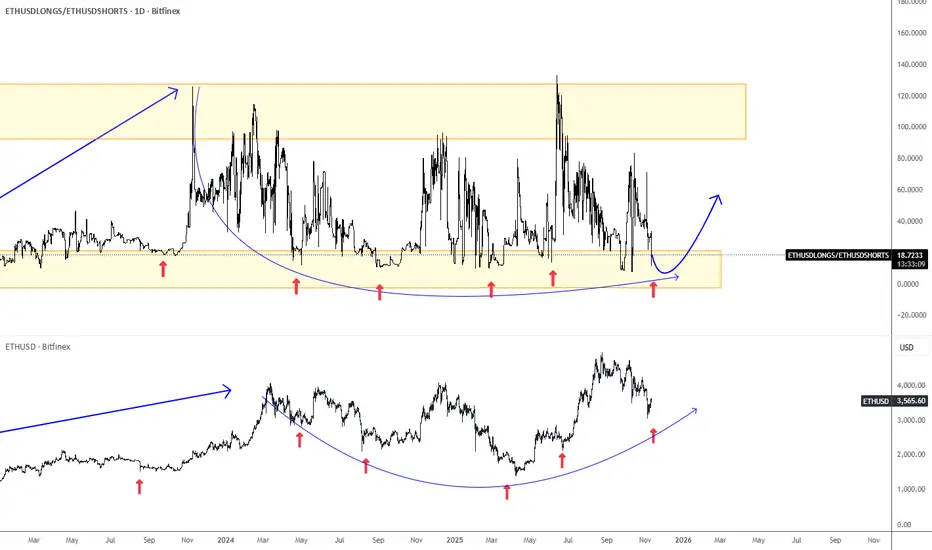
Ethereum Is Approaching SupportEthereum has been slowing down since August, but the wave structure remains slow, choppy, and overlapping, which suggests a correction within an ongoing uptrend. The ideal support area appears to be around the 3000 level.
One of the main reasons Ethereum may find support is the ETHUSD Longs/Shorts ratio chart, which came back to the lower end of its range. This indicates that many speculators are attempting to short the market while giving up on long positions.
If we take past cycles into account, Ethereum may experience limited weakness. Therefore, keep an eye out for a potential rebound and a bullish continuation, while the ETHUSD Longs/Shorts ratio chart could move back toward the upper side of its range.
GBPUSD overexhausted.GBPUSD pulled down after news for liquidation. A possible overexahaustion candle has occured and ready for a pull back UP.

USDCAD weak!USDCAD has been moving down with a pull back in Asian session. Came in for about a 1:1 RR.


BTC AnalysisAfter breaking out its uptrend line, Bitcoin is completing the pullback to its trend line, while with the formation of an increasing angle pattern in the same direction with the main trend, we are witnessing fatigue in the trend. There is a possibility that the price will drop to the range of 41 to 43 thousand dollars.

GBPUSD Rising.GBPUSD making Higher Highs and Higher Lows and moving nicely UP in the Channel. Possible continuation in the Channel or a Spike and a BreakOut in London Session or going to NY session.

BITCOIN Did the 1W MA50 just save the day again?Bitcoin (BTCUSD) just closed last week above its 1W MA50 (blue trend-line) even though it broke below it during the day.
Since the March 13 2023 break-out above the 1W MA50, this is the 4th time that BTC breaks below it but manages to close the 1W candle above it. All of those times (including the additional one of September 11 2023), marked market bottoms, Higher Lows for the 3-year Channel Up and initiated the Bull Cycle's strong rallies.
However every rally has been weaker and since the first one topped in March 2024, we have a huger Bearish Divergence on the 1W RSI of Lower Highs against BTC's Higher Highs, showcasing loss of strength for the trend. A natural feat however, as the Bull Cycle tends to be stronger on its start as it rebounds violently from the market bottom and less strong towards the end as it matures and big positions already start to take profits.
But is this the end of the Cycle? The 4-year Cycle Theory, the DXY bottoming, the 1W RSI Bearish Divergence among others, all say 'yes'. But the Bear Cycle can only be technically confirmed when the market closes that 1W candle below its 1W MA50 and so far it hasn't. Is that enough to rely your strategy on from this point onwards?
So has the 1W MA50 just saved the day again for Bitcoin? Feel free to let us know in the comments section below!
-------------------------------------------------------------------------------
** Please LIKE 👍, FOLLOW ✅, SHARE 🙌 and COMMENT ✍ if you enjoy this idea! Also share your ideas and charts in the comments section below! This is best way to keep it relevant, support us, keep the content here free and allow the idea to reach as many people as possible. **
-------------------------------------------------------------------------------
💸💸💸💸💸💸
👇 👇 👇 👇 👇 👇

WATCHING FOR CLOSE PRICE TODAYMorning folks,
So, pullback to 106K area has happened rather accurately. D. Trump once again has made a verbal intervention with promise of 2K and shutdown end, but this is too early to believe. As usual no one D. Trump promise has made a long lasted effect. All of them were reversed in a few days.
No Supreme Court decision yet on tariffs, now it is appeared that it will be not a 2K in cash but just tax adjustment, shutdown is still lasting and liquidity issues remain. So, I would say - it is too early to celebrate.
Meantime, on technical side we have clear signals. First is, if market will close today under 105.5K - we get daily bearish grabber. As you can see on 4H chart - it will appear right around strong resistance area. So, it might happen, that we will have to go short instead as market could drop again under 100K area...
Thus don't relax and don't believe in this suspicious euphoria, everything could change in a blink of an eye. Still, upward action above 108K could confirm the bullish sentiment.

ZEC/USDT Major trend. 2 halving 17 11 2024. 17/160,18Major trend. Large time frame for clarity. Old exchange Poloniex (low liquidity) due to long trading history to show everything clearly. As you can see with each cycle the highs are decreasing....
Cycles of life and death . This cryptocurrency is going into its third cycle. It will most likely be the last because of its anonymity. In a decentralized super centralized world, nothing can be anonymous! Am I wrong? States don't need anything anonymous. The demands of market regulation will “strangle” anything anonymous. But, this is later, and before the halving, which will happen on 17 11 2024 with a high probability they will pump up to 160.18$, and maybe even higher, if the card falls.
Saving "dirty money" when CBDC is introduced by banks . Some people think that when CBDC of central banks is introduced, through anonymous coins like ZEC, HMR and so on, big capital will "save" their shadow money. A fairy tale for school children. I have little faith in it. I think such money has been saved long ago. Although this story to create a news background as a reason to pump has a place ....
It's worth noting that BCH and BTC will first halve in April 2024.
News from Satoshi . By the way, "rumor has it" that closer to the summer of 2024, according to the plot of our crypto movie called good/bad, a new “Satoshi Nakamoto”. Will be announced, who will plunge everyone into “uncertainty of actions/consequences” in the market. Rumors also claim it will be the universally hated villain, Craig Wright). Do you think the role will go to another villain, Roger Ver? Or have these two characters already played out and the role will go to someone else? Or maybe the plot itself will be canceled? Perhaps. Time will tell, the manipulators can come up with anything, that's not the point.
Immunity from news nonsense. The main thing is to treat such "crypto stories", even if there is a real imitation of provability, with the utmost equanimity. Remember, no matter what is going on, it is all a hoax to capitalize on the direction of the trend. The news background that is created to accompany price movement.
Line chart.
Secondary trend. Timeframe 3 days

LINK LONG — FROM MATH TO MARKET STRUCTURE: An Extensive AnalysisTraders,
In my latest BINANCE:LINKUSDT analysis I started my thesis with " I BELIEVE THE CRYPTO MARKET IS SETTING UP FOR A BIG, BIG, BIG DUMP! NOT JUST LINK! "
It wasn’t coincidence that I wrote those words in caps lock. The market was whispering louder than usual: not in price, but in data. Every metric pulsed in rhythm, like the heartbeat of a system about to release its tension. The numbers weren’t random; they were poetry in motion, quietly syncing toward one inevitable point. Sometimes, data doesn’t just inform — it sings. And when it does, your fingertips start typing before your mind even realizes what the melody means.
Now we’re back — same chart, same logic, but a different side of the market.
I’m going to analyze it the same way I did before — step by step, math-backed, structure-based, and logic-driven.
Only this time, it’s even more extensive.
For free. For nothing. So that you, the people who actually care to learn, can start to see how markets truly work. How they breathe, trap, rotate, rebalance — and how every candle hides intent.
I believe the BINANCE:LINKUSDT dump might be over — for now, at least — and that the market is slowly starting to build upward momentum. This post is not a quick “looks bullish” statement. It’s a structured walkthrough from mathematical foundation to market structure, liquidity, and order flow, showing why the $20–$21 region might become the next key target before a rotation lower.
Let’s go step by step.
Step 1 – Is There a Mathematical Reason to Say the Current Auction Might Be Finished?
By “auction,” I mean the move from a clear swing high to a clear swing low where sellers were in control. Markets move in auctions — from high to low, then pull back, then extend again. To determine whether a sell auction is finished, we measure how far it has retraced and extended.
After the 10 Oct liquidation event, price printed a clean new high — more valid than the liquidation spike. That’s point A (~20.15). From there, it sold off to point B (~15.70).
So our first auction is:
A → B | Direction: Down
Step 2 – Measuring the Retrace
Since the move was downward, I drew a Fibonacci retracement from A to B (high → low). nThat gives us retracement levels above price on TradingView.
Price retraced almost perfectly to the 0.786 level (~19.23) — not shallow (0.382 or 0.5), not extreme (0.886), but deep enough to classify as a “normal” yet decisive retrace.
That means sellers regained control after a 0.786 pullback, a key ratio in the Fibonacci family.
Step 3 – What Does a 0.786 Retrace Usually Lead To?
Here’s where the Fibonacci logic becomes meaningful. The 0.786 level is derived from the square root of the golden ratio inverse: √(1/φ). Its natural mirror on the other side of price is √(φ), or 1.272.
That’s why 0.786 retraces often project toward 1.272 extensions — the two are mathematically linked. Beyond that, the next probable extensions are 1.414 and 1.618.
So, for a 0.786 retrace, the Fibonacci extension ladder is:
Primary: 1.272
Intermediate: 1.414
Extended: 1.618
Step 4 – Did BINANCE:LINKUSDT Reach One of These Fibonacci Targets?
To check that, we reverse the Fibonacci — draw it from B to A (low → high). That prints the extension levels below the swing low.
Price hit the 1.414 extension almost perfectly before structure began shifting:
Lower lows stopped forming
Higher lows began to appear
Small higher highs emerged on lower timeframes
That’s a structural sign the sellers exhausted their leg — a textbook confirmation that the 1.414 zone completed the auction.
Step 5 – Confirming the Auction
The A → B auction retraced to 0.786, extended to 1.414, and then reversed in structure. This matches the Fibonacci expectation for a completed wave.
If the retrace had been 0.886 instead, we’d likely expect continuation to 1.618 — but since it was 0.786, the 1.414 tap followed by reversal fits perfectly.
✅ 0.786 retrace → 1.272 / 1.414 / 1.618 extension
✅ 1.414 tapped → structure reversed
We can reasonably call this auction finished.
Step 6 – Confluence from the Smaller ABC Swing
After the main leg, the market made a small rally and a lower high — point C. Using the Fibonacci Extension tool (A → B → C), we project this smaller swing.
Interestingly, the ABC projection lands exactly on the same 1.414 zone as the larger A → B measurement. That’s two independent Fibonacci constructions converging on the same price.
From a math perspective, this isn’t coincidence — both patterns use the same ratio family.
It’s proportion — the geometry folding back onto itself.
Nature’s Geometry on a Price Chart
This is where Fibonacci goes beyond numbers. The same proportions that define growth patterns in seashells, tree branches, sunflowers, hurricanes, and galaxies are present in the market’s structure.
Two distinct swings produce the same 1.414 target.That’s natural proportion — mathematical harmony showing up in price behaviour.
It’s not random. It’s geometry repeating itself.
Part 2 – The Structural Context: Liquidity and Value
We’ve identified our Potential Reversal Zone (PRZ) using Fibonacci confluence. Now let’s look inside the structure and the market’s underlying “memory.”
We’ll answer three questions:
Where does liquidity sit — which levels might the market hunt next?
What is the order flow showing — is there absorption or continuation?
What do the next extensions project mathematically?
1. Liquidity via TPO (Market Profile)
TPO (Time Price Opportunity) shows how much time price spent at each level. Clusters = acceptance and value. Gaps = imbalance and rejection.
Around $19.00, during TPO periods G, H, N, and O, price built acceptance but didn’t explore higher. That created a weak high — a level that often acts as a magnet for future liquidity hunts.
Another, slightly weaker high sits near $20.00, which is still unfinished.
And as James Bond said, “I never leave loose ends.” Neither does the market.
2. Anchored VWAP Confluence
Anchoring VWAP from the major swing high shows the blue AVWAP aligning almost perfectly with that $20.00 region. That gives strong confluence between volume-weighted value, liquidity, and structure.
3. Low Volume Nodes (LVNs) and Imbalance
Using the Fixed Range Volume Profile (FRVP) from A → B reveals clear low-volume zones — “air pockets” where price moved too fast to build volume.
Between $20.00 and $20.50, there’s a notable LVN, meaning price skipped over it during the selloff.Such zones often act as magnets — the market tends to revisit them to rebalance unfinished business.
Now we have three layers of confluence:
Weak high at $19.00–$20.00
Anchored VWAP aligning with $20.00
LVN pocket at $20.00–$20.50
That defines a clear liquidity and target zone.
Structure and Confluence Summary
PRZ established through Fibonacci symmetry
Structure showing higher lows and early accumulation
Confluence cluster between $20.00 and $20.50, combining:
Weak highs
Low-volume node
Anchored VWAP
Market Profile imbalance
The setup aligns across math, volume, and structure.
Part 4 – Order Flow: What Lies Beneath the Candles
From the outside, price action looks calm — clean candles, defined Fibonacci levels, and structure that seems perfectly balanced. But the real story is hidden underneath, inside the Order Flow.
Every candle represents a battle — between aggression and absorption, buyers and sellers, liquidity and imbalance. Understanding who is winning that battle tells us whether a move is genuine strength or a trap waiting to unwind.
Order Flow allows us to look beneath the surface and see where transactions are actually happening — where volume clusters, where buyers are absorbed, and where sellers are defending. It’s the market’s heartbeat.
The Current Picture
Here’s what we see right now on BINANCE:LINKUSDT :
CVD (Cumulative Volume Delta) — across both spot and futures (stablecoin- and coin-margined contracts) — is making lower highs, showing persistent sell aggression.
Yet price itself is not breaking down. Instead, it’s holding steady and even forming higher lows.
Meanwhile, the A/D (Accumulation/Distribution) line is rising, indicating that despite heavy selling pressure, buyers continue to absorb and accumulate.
That means one thing:
aggressive sellers are being absorbed by large passive buyers quietly taking the other side.
Recognizing the Setup
Let’s break down the pattern:
CVD ↓ → sustained sell aggression
OI ↑ → new short positions entering the market
Price ↔ or ↑ slightly → absorption and accumulation taking place
When these three align:
It often signals a short trap forming.
Sellers feel in control because CVD shows selling dominance.
In reality, their aggression is being absorbed by larger passive buyers.
Once that liquidity runs out and buyers stop absorbing, shorts are trapped.
Those trapped shorts must cover — triggering a fast, aggressive short squeeze upward.
Also: CVD on Stablecoin Margined Contracts remains flat while Stablecoin Margined Open Interest rises — showing aggressive shorting being absorbed by larger buyers. Price stability suggests accumulation, not weakness. Since OI stays high, those shorts are still in the game, meaning their positions haven’t been closed yet. If price starts to move up, they’ll be forced to cover — setting up the conditions for a short squeeze.
Absorption in Context
Absorption isn’t random — it’s the footprint of strong hands quietly taking in sell pressure without letting price break down. While most see weakness, they’re actually witnessing controlled accumulation.
Here, price holds steady as CVD trends flat and OI stays high — meaning aggressive shorts are still in the game, being absorbed by larger buyers. Every new short adds fuel to the spring.
When that pressure releases, it doesn’t drift — it snaps. Shorts are forced to cover, triggering a sharp, emotional squeeze toward the next liquidity zone around $20–$20.50, where Fibonacci confluence and a weak high align.
This is where microstructure meets the macro picture — absorption building the base for a violent move higher.
Part 5 – Fibonacci Extension Confirmation
To justify the $20–$21 target mathematically, we apply one more Fibonacci extension —
from the last swing low to the recent high, projected forward.
The 1.618 extension aligns almost perfectly around $20.00, adding strong mathematical confluence to our previously defined liquidity and structure zone.
That makes $20.00–$20.50 a textbook target cluster — a Fibonacci, liquidity, and volume alignment.
Final Outlook – The Path Ahead
Based on all the combined data:
Fibonacci structure shows completion and new expansion potential
Market Profile and VWAP reveal unfinished business around $20–$20.50
Order Flow confirms absorption and hidden accumulation
The 1.618 Fibonacci projection reinforces this level as a natural mathematical destination
I believe the market will squeeze upward toward $20–$21, taking out the weak high and the LVN pocket — and once that liquidity is collected, rotate back down to restore balance.
The setup is mathematically justified, structurally valid, and order-flow supported — a complete picture of how Fibonacci geometry, structure, and liquidity align to reveal where the next phase of this auction may unfold.
If price slips lower instead, the key level to watch is $12.90 — the latest 1.618 extension from the initial wave we measured earlier. That remains the deep liquidity and structural boundary where balance could be restored.
Last words.
Everything we have mapped — Fibonacci structure, confluence, liquidity, and absorption — means nothing without the psychology behind it. The market is not just math and candles; it is a mirror of collective emotion. Every trapped short, every breakout chase, every hesitation is human behaviour written in numbers.
When confidence is at its peak, risk is usually greatest.
When fear dominates, opportunity hides in plain sight.
That is why sentiment often reaches its extreme just before reversals. Most traders only see what is already visible, not what is quietly building beneath the surface.
So next time you scroll through social media or read the news about what everyone expects, remind yourself of this:
When everyone sees the same breakout, the trade was over hours ago.
And the markets whisper long before they speak.
From the depths of the sands,
ThetaNomad
------------------------------------
If you enjoy this kind of analysis, leave a like and drop a comment. I don’t ask for anything — I just want to help more people learn to look behind the charts, to see the story that price and volume quietly write together.

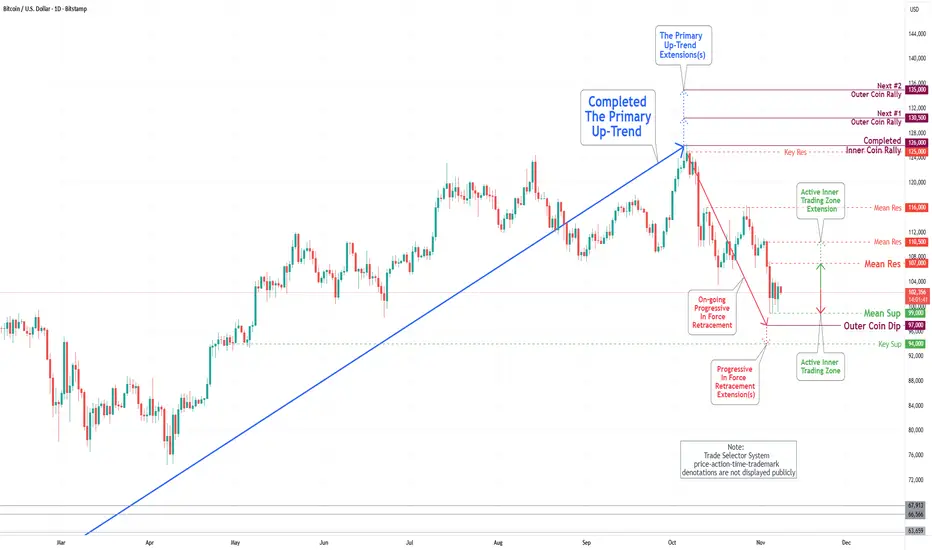
Bitcoin(BTC/USD) Daily Chart Analysis For Week of Nov 7, 2025Technical Analysis and Outlook:
In the previous trading session, the Bitcoin market experienced a notable drawdown over the past week, with the Mean Support established at 101,000, around which trading activity was concentrated. Presently, the price is actively maintained within the range defined by the Mean Resistance at 107,000 and the Mean Support at 97,000.
Current market analysis suggests the likelihood of a retest toward the Mean Support level at 99,000, with a primary emphasis on the potential for further downward movement toward the Outer Coin Dip at 97,000, which may extend to the Key Support level at 94,000. Nonetheless, it is vital to recognize the substantial rebound potential present at these critical levels.
Bottom of BTC?Everyone says the crypto market is already in a bearish season, but I have a different scenario
Yes in the past few weeks BYBIT:BTCUSDT has dropped significantly, around -21% from its peak at $126,195. However, I see that on the weekly chart, the price is still holding above $100,731 and $98,185. As long as the weekly candle doesn’t close below $102,329, there’s still a chance for BYBIT:BTCUSDT to continue its bullish move.
Now, let’s zoom in to the hourly chart to find potential areas for a price rebound.
On the hourly timeframe, there was a break below $100,288, with the next downside target around $99,548 – $98,961. But if we look closely, the drop that happened on November 6th, 2026, at 02:00 AM (GMT+7) wasn’t as aggressive as the previous one.
It seems that the seller’s momentum has started to fade since that period, which could indicate a shift from sellers to buyers.
Since the selling pressure is weakening, my scenario is that the decline in BYBIT:BTCUSDT will likely stop around $99,548 – $98,961, and from there, a significant rebound may follow.
That’s my view on BYBIT:BTCUSDT , what’s yours?
