BCHUSD H4| Bullish Bounce Off Major SupportBCH/USD has bounced off the buy entry which is a multi-swing low support and could rise from this level to the upside.
Buy entry is at 527.26, which is a multi-swing low support.
Stop loss is at 509.38, which is a pullback support that aligns with the 127.2% Fibonacci extension.
Take profit is at 566.31, which is a pullback resistance that lines up with the 50% Fibonacci retracement.
High Risk Investment Warning
Trading Forex/CFDs on margin carries a high level of risk and may not be suitable for all investors. Leverage can work against you.
Stratos Markets Limited (tradu.com ):
CFDs are complex instruments and come with a high risk of losing money rapidly due to leverage. 65% of retail investor accounts lose money when trading CFDs with this provider. You should consider whether you understand how CFDs work and whether you can afford to take the high risk of losing your money.
Stratos Europe Ltd (tradu.com ):
CFDs are complex instruments and come with a high risk of losing money rapidly due to leverage. 66% of retail investor accounts lose money when trading CFDs with this provider. You should consider whether you understand how CFDs work and whether you can afford to take the high risk of losing your money.
Stratos Global LLC (tradu.com ):
Losses can exceed deposits.
Please be advised that the information presented on TradingView is provided to Tradu (‘Company’, ‘we’) by a third-party provider (‘TFA Global Pte Ltd’). Please be reminded that you are solely responsible for the trading decisions on your account. There is a very high degree of risk involved in trading. Any information and/or content is intended entirely for research, educational and informational purposes only and does not constitute investment or consultation advice or investment strategy. The information is not tailored to the investment needs of any specific person and therefore does not involve a consideration of any of the investment objectives, financial situation or needs of any viewer that may receive it. Kindly also note that past performance is not a reliable indicator of future results. Actual results may differ materially from those anticipated in forward-looking or past performance statements. We assume no liability as to the accuracy or completeness of any of the information and/or content provided herein and the Company cannot be held responsible for any omission, mistake nor for any loss or damage including without limitation to any loss of profit which may arise from reliance on any information supplied by TFA Global Pte Ltd.
The speaker(s) is neither an employee, agent nor representative of Tradu and is therefore acting independently. The opinions given are their own, constitute general market commentary, and do not constitute the opinion or advice of Tradu or any form of personal or investment advice. Tradu neither endorses nor guarantees offerings of third-party speakers, nor is Tradu responsible for the content, veracity or opinions of third-party speakers, presenters or participants.
Cryptocurrencysignals

BITCOIN Short squeeze in action with 1W MA50 saving the day?Bitcoin (BTCUSD) is rebounding rather as aggressively as it flash crashed on Friday following President Trump's threats on new China tariffs. We've seen the outcome of such Trade War threats back in February - April. In fact that was the last time (April 09 2025) that BTC hit its 1W MA50 (red trend-line). Following that, an enormous long-term rally followed that made new All Time Highs (ATH).
Friday was the first time since then that the price almost touched the 1W MA50, while breaking through the 1D MA200 (orange trend-line) for the first time since April 22. Friday's Low is so far technically a Higher Low on the 1-year Rising Wedge pattern.
The more U.S. and China seem to agree on a new truce and not move forward to escalate threats into actions, the stronger the current short squeeze will be in the market and the current rally will most likely target the top (Higher Highs trend-line) of the Rising Wedge on the key psychological level of $130000.
If however it appears that agreements fall through and the bottom (Higher Lows trend-line) of the Rising Wedge breaks, we expect a deeper and potentially more aggressive fall to he 1W MA100 (green trend-line) around $85000. It also has to be mentioned that Friday's Low hit the 1D RSI 4-month Support Zone and rebounded.
Which scenario do you think is more likely to happen? Feel free to let us know in the comments section below!
-------------------------------------------------------------------------------
** Please LIKE 👍, FOLLOW ✅, SHARE 🙌 and COMMENT ✍ if you enjoy this idea! Also share your ideas and charts in the comments section below! This is best way to keep it relevant, support us, keep the content here free and allow the idea to reach as many people as possible. **
-------------------------------------------------------------------------------
💸💸💸💸💸💸
👇 👇 👇 👇 👇 👇

Bearish reversal off pullback resistance?The Bitcoin (BTC/USD) is rising towards the pivot which acts as a pullback resistance and could reverse to the 1st support which aligns with the 138.2% Fibonacci extension.
Pivot: 117,432.32
1st Support: 101,396.53
1st Resistance: 125,524.83
Disclaimer:
The above opinions given constitute general market commentary, and do not constitute the opinion or advice of IC Markets or any form of personal or investment advice.
Any opinions, news, research, analyses, prices, other information, or links to third-party sites contained on this website are provided on an "as-is" basis, are intended only to be informative, is not an advice nor a recommendation, nor research, or a record of our trading prices, or an offer of, or solicitation for a transaction in any financial instrument and thus should not be treated as such. The information provided does not involve any specific investment objectives, financial situation and needs of any specific person who may receive it. Please be aware, that past performance is not a reliable indicator of future performance and/or results. Past Performance or Forward-looking scenarios based upon the reasonable beliefs of the third-party provider are not a guarantee of future performance. Actual results may differ materially from those anticipated in forward-looking or past performance statements. IC Markets makes no representation or warranty and assumes no liability as to the accuracy or completeness of the information provided, nor any loss arising from any investment based on a recommendation, forecast or any information supplied by any third-party.

BITCOIN Are you worried about this?Bitcoin (BTCUSD) is pulling back aggressively today following Trump's China-tariffs related news and this weekly rejection is far from ideal technically as well.
In recent years it's been unusual to look at the market on anything but a logarithmic scale, which is natural as it offers a fair representation of BTC's remarkable gains and parabolic Cycles.
On today's analysis however we present the long-term price action on the 1W time-frame without being on the log scale. And as you can see what stands out is a Higher Highs trend-line that dates back to the December 11 2017 Cycle Top, almost 8 years ago.
This trend-line is anything but comforting at the moment as it has caused numerous rejections with the strongest being the April 12 2021 High. More recently it has formed the July 14 2025 High, the August 11 2025 High, last week's (September 29 2025) High and so far the current one (October 06 2025).
This is far from ideal and it gets worse seeing that since the March 04 2024 High, the 1W RSI has been under Lower Highs, which is of course a Bearish Divergence against the markets Higher Highs, similar to the Lower Highs of the previous Cycle that formed the November 08 2021 Top.
This time is indeed a little different though as the RSI's current 3rd Lower High is still a Higher High for BTC while on the previous Cycle it was (March 21 2022) already a Lower High for the price as well inside a Bear Cycle that has already started.
Still, do you believe this 8-year Higher Highs trend-line rejection is alarming or not? Feel free to let us know in the comments section below!
-------------------------------------------------------------------------------
** Please LIKE 👍, FOLLOW ✅, SHARE 🙌 and COMMENT ✍ if you enjoy this idea! Also share your ideas and charts in the comments section below! This is best way to keep it relevant, support us, keep the content here free and allow the idea to reach as many people as possible. **
-------------------------------------------------------------------------------
💸💸💸💸💸💸
👇 👇 👇 👇 👇 👇

$ETH Performing Ascending Channel
An ascending channel, or rising channel, is a chart pattern used in technical analysis to identify a security's ongoing uptrend. It is characterized by the price fluctuating between two parallel, upward-sloping trendlines.
Key components
Higher highs and higher lows:
The price consistently makes higher swing highs and higher swing lows over a period of time, indicating steady bullish momentum.
Parallel trendlines:
Two parallel lines are drawn to frame the price action.
Upper line (resistance):
Connects the higher swing highs. It represents the point where selling pressure is strong enough to temporarily stop the price from rising.
Lower line (support):
Connects the higher swing lows. This line indicates where buying pressure is strong enough to prevent the price from falling further.

Bearish drop off?Ethereum (ETH/USD) is rising towards the pivot, which is a pullback resistance and could reverse to the 61.8% Fibonacci retracement.
Pivot: 4,422.34
1st Support: 4,129.91
1st Resistance: 4,566.08
Disclaimer:
The above opinions given constitute general market commentary, and do not constitute the opinion or advice of IC Markets or any form of personal or investment advice.
Any opinions, news, research, analyses, prices, other information, or links to third-party sites contained on this website are provided on an "as-is" basis, are intended only to be informative, is not an advice nor a recommendation, nor research, or a record of our trading prices, or an offer of, or solicitation for a transaction in any financial instrument and thus should not be treated as such. The information provided does not involve any specific investment objectives, financial situation and needs of any specific person who may receive it. Please be aware, that past performance is not a reliable indicator of future performance and/or results. Past Performance or Forward-looking scenarios based upon the reasonable beliefs of the third-party provider are not a guarantee of future performance. Actual results may differ materially from those anticipated in forward-looking or past performance statements. IC Markets makes no representation or warranty and assumes no liability as to the accuracy or completeness of the information provided, nor any loss arising from any investment based on a recommendation, forecast or any information supplied by any third-party.

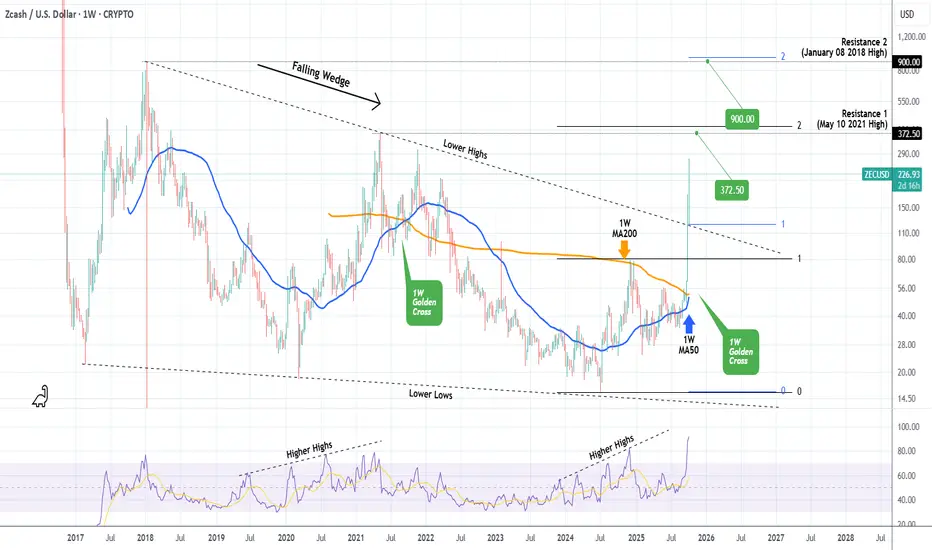
ZCASH Eyes $372.50 but might surprise us with an even higher TopZcash (ZECUSD) has been essentially trading within a multi-year Falling Wedge since the February 20 2017 Low, which effectively broke last week. This week continued equally impressively with the price currently at $239, having increased by almost +1000% since the February 2025 Low.
This Falling Wedge bullish break-out it technically targeting the 2.0 Fibonacci extension from the December 02 202 High. This falls marginally above the $372.50 Resistance (1), which is the May 10 2021 High of the previous Cycle. We expect this to get hit soon and most likely price the Top of the current Bull Cycle.
However, there is an optimistic scenario, which may push the Cycle Top to Resistance 2 (January 08 2018 High, the top of the first Cycle) at $900, which is the 2.0 Fibonacci extension (blue levels) from the Falling Wedge's break-out point. But that is assuming ZEC closes a full 1W candle above Resistance 1.
-------------------------------------------------------------------------------
** Please LIKE 👍, FOLLOW ✅, SHARE 🙌 and COMMENT ✍ if you enjoy this idea! Also share your ideas and charts in the comments section below! This is best way to keep it relevant, support us, keep the content here free and allow the idea to reach as many people as possible. **
-------------------------------------------------------------------------------
💸💸💸💸💸💸
👇 👇 👇 👇 👇 👇
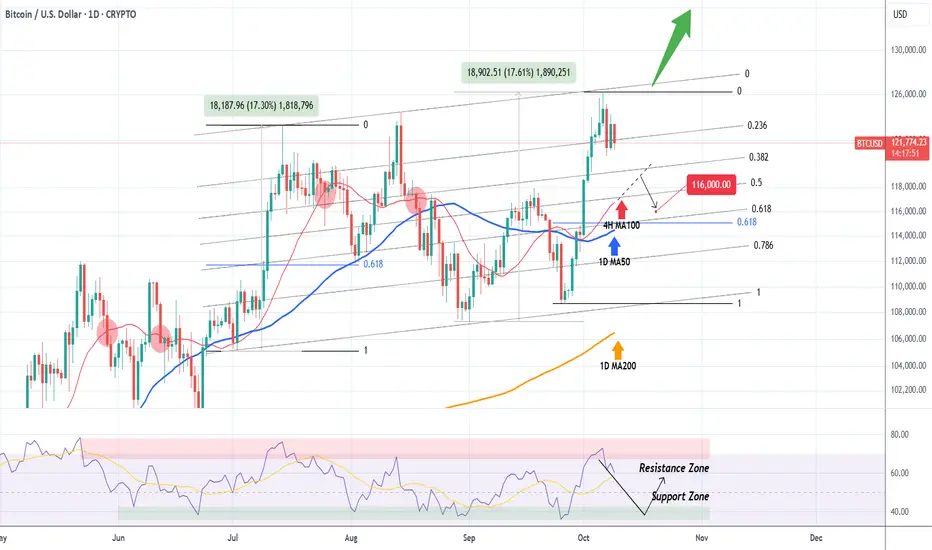
BITCOIN How low can it pull back??Bitcoin (BTCUSD) got rejected on the Higher Highs trend-line we mentioned on our last analysis and is already pulling back. The question is how far can it drop?
Today we expand on that analysis by applying the Fibonacci Channel on the Higher Highs trend-line. Instantly we can see that the Channel Up has two almost perfectly symmetrical Bullish Legs (+17.30% and +17.61% respectively).
The key on this pattern is the 4H MA100 (red trend-line). Every time BTC broke below it since May 29, the decline extended all the way to at least the 1D MA50 (blue trend-line).
Since the 1D RSI also got rejected on its Resistance Zone, we expect a pull-back towards its Support Zone and if the 4H MA100 breaks, further extension towards the 1D MA50. We estimate a potential target to be $116000, which is marginally above the 0.618 Fibonacci retracement level, where the August 02 bounce took place. Needless to say, a break (and 1D candle close) above the Channel's top (Higher Highs trend-line), invalidates any pull-back scenario and, as mentioned previously, constitutes a bullish break-out to a new pattern/ rally.
What do you think will happen next? Feel free to let us know in the comments section below!
-------------------------------------------------------------------------------
** Please LIKE 👍, FOLLOW ✅, SHARE 🙌 and COMMENT ✍ if you enjoy this idea! Also share your ideas and charts in the comments section below! This is best way to keep it relevant, support us, keep the content here free and allow the idea to reach as many people as possible. **
-------------------------------------------------------------------------------
💸💸💸💸💸💸
👇 👇 👇 👇 👇 👇
BTCUSD H4 | Price Rejection Signals Bearish MoveBitcoin (BTC/USD) has reacted off the sell entry at 122,135.86, which is a pullback resistance and could potentially drop from this level to the downside.
Stop loss is at 126,215.15, whic is a swing high resistance.
Take profit is at 117,768.13, which is a pullback support that lines up with the 50% Fibonacci retracement.
High Risk Investment Warning
Trading Forex/CFDs on margin carries a high level of risk and may not be suitable for all investors. Leverage can work against you.
Stratos Markets Limited (tradu.com ):
CFDs are complex instruments and come with a high risk of losing money rapidly due to leverage. 65% of retail investor accounts lose money when trading CFDs with this provider. You should consider whether you understand how CFDs work and whether you can afford to take the high risk of losing your money.
Stratos Europe Ltd (tradu.com ):
CFDs are complex instruments and come with a high risk of losing money rapidly due to leverage. 66% of retail investor accounts lose money when trading CFDs with this provider. You should consider whether you understand how CFDs work and whether you can afford to take the high risk of losing your money.
Stratos Global LLC (tradu.com ):
Losses can exceed deposits.
Please be advised that the information presented on TradingView is provided to Tradu (‘Company’, ‘we’) by a third-party provider (‘TFA Global Pte Ltd’). Please be reminded that you are solely responsible for the trading decisions on your account. There is a very high degree of risk involved in trading. Any information and/or content is intended entirely for research, educational and informational purposes only and does not constitute investment or consultation advice or investment strategy. The information is not tailored to the investment needs of any specific person and therefore does not involve a consideration of any of the investment objectives, financial situation or needs of any viewer that may receive it. Kindly also note that past performance is not a reliable indicator of future results. Actual results may differ materially from those anticipated in forward-looking or past performance statements. We assume no liability as to the accuracy or completeness of any of the information and/or content provided herein and the Company cannot be held responsible for any omission, mistake nor for any loss or damage including without limitation to any loss of profit which may arise from reliance on any information supplied by TFA Global Pte Ltd.
The speaker(s) is neither an employee, agent nor representative of Tradu and is therefore acting independently. The opinions given are their own, constitute general market commentary, and do not constitute the opinion or advice of Tradu or any form of personal or investment advice. Tradu neither endorses nor guarantees offerings of third-party speakers, nor is Tradu responsible for the content, veracity or opinions of third-party speakers, presenters or participants.

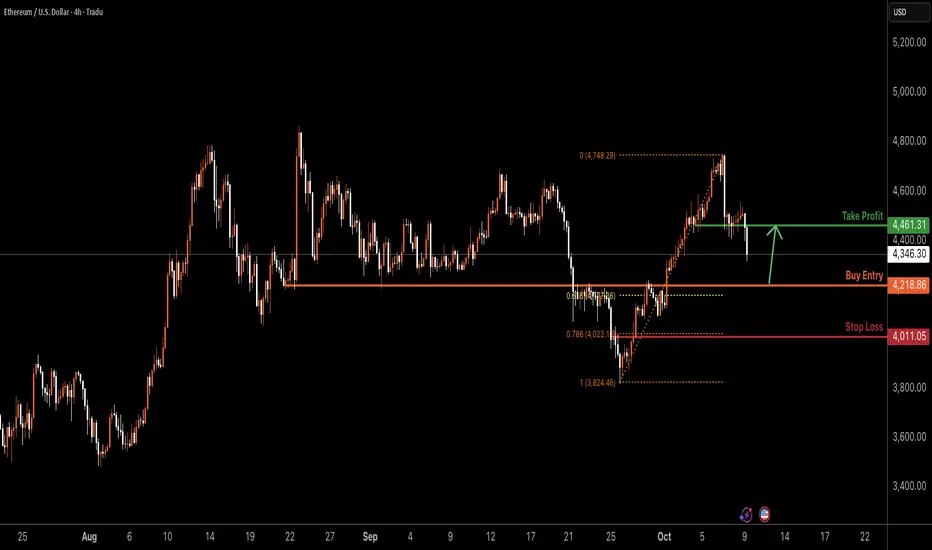
ETHUSD H4 | Bullish Reversal at Key SupportETH/USD is falling towards the buy entry at 4,218.86, which is an overlap support that is slightly above the 61.8% Fibonacci retracement and could bounce from this level ot the upside.
Stop loss is at 4,011.05, which is a pullback support that aligns with the 78.6% Fibonacci retracement.
Take profit is at 4,461.31, which is a pullback resistance.
High Risk Investment Warning
Trading Forex/CFDs on margin carries a high level of risk and may not be suitable for all investors. Leverage can work against you.
Stratos Markets Limited (tradu.com ):
CFDs are complex instruments and come with a high risk of losing money rapidly due to leverage. 65% of retail investor accounts lose money when trading CFDs with this provider. You should consider whether you understand how CFDs work and whether you can afford to take the high risk of losing your money.
Stratos Europe Ltd (tradu.com ):
CFDs are complex instruments and come with a high risk of losing money rapidly due to leverage. 66% of retail investor accounts lose money when trading CFDs with this provider. You should consider whether you understand how CFDs work and whether you can afford to take the high risk of losing your money.
Stratos Global LLC (tradu.com ):
Losses can exceed deposits.
Please be advised that the information presented on TradingView is provided to Tradu (‘Company’, ‘we’) by a third-party provider (‘TFA Global Pte Ltd’). Please be reminded that you are solely responsible for the trading decisions on your account. There is a very high degree of risk involved in trading. Any information and/or content is intended entirely for research, educational and informational purposes only and does not constitute investment or consultation advice or investment strategy. The information is not tailored to the investment needs of any specific person and therefore does not involve a consideration of any of the investment objectives, financial situation or needs of any viewer that may receive it. Kindly also note that past performance is not a reliable indicator of future results. Actual results may differ materially from those anticipated in forward-looking or past performance statements. We assume no liability as to the accuracy or completeness of any of the information and/or content provided herein and the Company cannot be held responsible for any omission, mistake nor for any loss or damage including without limitation to any loss of profit which may arise from reliance on any information supplied by TFA Global Pte Ltd.
The speaker(s) is neither an employee, agent nor representative of Tradu and is therefore acting independently. The opinions given are their own, constitute general market commentary, and do not constitute the opinion or advice of Tradu or any form of personal or investment advice. Tradu neither endorses nor guarantees offerings of third-party speakers, nor is Tradu responsible for the content, veracity or opinions of third-party speakers, presenters or participants.
DOGEUSD H4 | Potential Short-Term Bullish ReboundDOGEUSD is falling towards the buy entry, whic is an overlap support that lines up with the 100% Fibonacci projection and also slightly below the 61.8% Fibonacci retracement, and could bounce from this level to the upside.
Buy entry is at 0.23494, which is an overlap support that lines up with the 100% Fibonacci projection and also slightly below the 61.8% Fibonacci retracement.
Stop loss is at 0.22155, which is a pullback support.
Take profit is at 0.25563, which is a pullback resistance.
High Risk Investment Warning
Trading Forex/CFDs on margin carries a high level of risk and may not be suitable for all investors. Leverage can work against you.
Stratos Markets Limited (tradu.com ):
CFDs are complex instruments and come with a high risk of losing money rapidly due to leverage. 65% of retail investor accounts lose money when trading CFDs with this provider. You should consider whether you understand how CFDs work and whether you can afford to take the high risk of losing your money.
Stratos Europe Ltd (tradu.com ):
CFDs are complex instruments and come with a high risk of losing money rapidly due to leverage. 66% of retail investor accounts lose money when trading CFDs with this provider. You should consider whether you understand how CFDs work and whether you can afford to take the high risk of losing your money.
Stratos Global LLC (tradu.com ):
Losses can exceed deposits.
Please be advised that the information presented on TradingView is provided to Tradu (‘Company’, ‘we’) by a third-party provider (‘TFA Global Pte Ltd’). Please be reminded that you are solely responsible for the trading decisions on your account. There is a very high degree of risk involved in trading. Any information and/or content is intended entirely for research, educational and informational purposes only and does not constitute investment or consultation advice or investment strategy. The information is not tailored to the investment needs of any specific person and therefore does not involve a consideration of any of the investment objectives, financial situation or needs of any viewer that may receive it. Kindly also note that past performance is not a reliable indicator of future results. Actual results may differ materially from those anticipated in forward-looking or past performance statements. We assume no liability as to the accuracy or completeness of any of the information and/or content provided herein and the Company cannot be held responsible for any omission, mistake nor for any loss or damage including without limitation to any loss of profit which may arise from reliance on any information supplied by TFA Global Pte Ltd.
The speaker(s) is neither an employee, agent nor representative of Tradu and is therefore acting independently. The opinions given are their own, constitute general market commentary, and do not constitute the opinion or advice of Tradu or any form of personal or investment advice. Tradu neither endorses nor guarantees offerings of third-party speakers, nor is Tradu responsible for the content, veracity or opinions of third-party speakers, presenters or participants.

EOSUSD H4 | Momentum Set to ContinueBased on the H4 chart analysis, we can see that the price has rejected off the sell entry, which is a pullback resistance and could drop from this level to the downside.
Sell entry is at 0.4051, which is a pullback resistance.
Stop loss is at 0.44221, which is a pullback resistance that is slightly above the 61.8% Fibonacci retracement.
Take profit is at 0.3390, which lines up with the 61.8% Fibonacci projection and the 161.8% Fibonacci extension.
High Risk Investment Warning
Trading Forex/CFDs on margin carries a high level of risk and may not be suitable for all investors. Leverage can work against you.
Stratos Markets Limited (tradu.com ):
CFDs are complex instruments and come with a high risk of losing money rapidly due to leverage. 65% of retail investor accounts lose money when trading CFDs with this provider. You should consider whether you understand how CFDs work and whether you can afford to take the high risk of losing your money.
Stratos Europe Ltd (tradu.com ):
CFDs are complex instruments and come with a high risk of losing money rapidly due to leverage. 66% of retail investor accounts lose money when trading CFDs with this provider. You should consider whether you understand how CFDs work and whether you can afford to take the high risk of losing your money.
Stratos Global LLC (tradu.com ):
Losses can exceed deposits.
Please be advised that the information presented on TradingView is provided to Tradu (‘Company’, ‘we’) by a third-party provider (‘TFA Global Pte Ltd’). Please be reminded that you are solely responsible for the trading decisions on your account. There is a very high degree of risk involved in trading. Any information and/or content is intended entirely for research, educational and informational purposes only and does not constitute investment or consultation advice or investment strategy. The information is not tailored to the investment needs of any specific person and therefore does not involve a consideration of any of the investment objectives, financial situation or needs of any viewer that may receive it. Kindly also note that past performance is not a reliable indicator of future results. Actual results may differ materially from those anticipated in forward-looking or past performance statements. We assume no liability as to the accuracy or completeness of any of the information and/or content provided herein and the Company cannot be held responsible for any omission, mistake nor for any loss or damage including without limitation to any loss of profit which may arise from reliance on any information supplied by TFA Global Pte Ltd.
The speaker(s) is neither an employee, agent nor representative of Tradu and is therefore acting independently. The opinions given are their own, constitute general market commentary, and do not constitute the opinion or advice of Tradu or any form of personal or investment advice. Tradu neither endorses nor guarantees offerings of third-party speakers, nor is Tradu responsible for the content, veracity or opinions of third-party speakers, presenters or participants.

BCHUSD | H4 Bearish ReversalBased on the H4 chart analysis, we can see that the price has rejected off the sell entry, which is a pullback resistance, and could drop from this level to the downside.
Sell entry is at 583.57, which is a pullback resistance.
Stop loss is at 606.73, which is a pullback resistance.
Take profit is at 547.24, which his a pullback support that lines up with the 78.6% Fibonacci retracement.
High Risk Investment Warning
Trading Forex/CFDs on margin carries a high level of risk and may not be suitable for all investors. Leverage can work against you.
Stratos Markets Limited (tradu.com ):
CFDs are complex instruments and come with a high risk of losing money rapidly due to leverage. 65% of retail investor accounts lose money when trading CFDs with this provider. You should consider whether you understand how CFDs work and whether you can afford to take the high risk of losing your money.
Stratos Europe Ltd (tradu.com ):
CFDs are complex instruments and come with a high risk of losing money rapidly due to leverage. 66% of retail investor accounts lose money when trading CFDs with this provider. You should consider whether you understand how CFDs work and whether you can afford to take the high risk of losing your money.
Stratos Global LLC (tradu.com ):
Losses can exceed deposits.
Please be advised that the information presented on TradingView is provided to Tradu (‘Company’, ‘we’) by a third-party provider (‘TFA Global Pte Ltd’). Please be reminded that you are solely responsible for the trading decisions on your account. There is a very high degree of risk involved in trading. Any information and/or content is intended entirely for research, educational and informational purposes only and does not constitute investment or consultation advice or investment strategy. The information is not tailored to the investment needs of any specific person and therefore does not involve a consideration of any of the investment objectives, financial situation or needs of any viewer that may receive it. Kindly also note that past performance is not a reliable indicator of future results. Actual results may differ materially from those anticipated in forward-looking or past performance statements. We assume no liability as to the accuracy or completeness of any of the information and/or content provided herein and the Company cannot be held responsible for any omission, mistake nor for any loss or damage including without limitation to any loss of profit which may arise from reliance on any information supplied by TFA Global Pte Ltd.
The speaker(s) is neither an employee, agent nor representative of Tradu and is therefore acting independently. The opinions given are their own, constitute general market commentary, and do not constitute the opinion or advice of Tradu or any form of personal or investment advice. Tradu neither endorses nor guarantees offerings of third-party speakers, nor is Tradu responsible for the content, veracity or opinions of third-party speakers, presenters or participants.

Bearish momentum building?The Bitcoin (BTC/USD) has rejected off the pivot and could drop to the 1st support that aligns with the 38.2% Fibonacci retracement.
Pivot: 124,139.15
1st Support: 119,294.96
1st Resistance: 126,282.29
Disclaimer:
The above opinions given constitute general market commentary, and do not constitute the opinion or advice of IC Markets or any form of personal or investment advice.
Any opinions, news, research, analyses, prices, other information, or links to third-party sites contained on this website are provided on an "as-is" basis, are intended only to be informative, is not an advice nor a recommendation, nor research, or a record of our trading prices, or an offer of, or solicitation for a transaction in any financial instrument and thus should not be treated as such. The information provided does not involve any specific investment objectives, financial situation and needs of any specific person who may receive it. Please be aware, that past performance is not a reliable indicator of future performance and/or results. Past Performance or Forward-looking scenarios based upon the reasonable beliefs of the third-party provider are not a guarantee of future performance. Actual results may differ materially from those anticipated in forward-looking or past performance statements. IC Markets makes no representation or warranty and assumes no liability as to the accuracy or completeness of the information provided, nor any loss arising from any investment based on a recommendation, forecast or any information supplied by any third-party.

BTCUSD H4 | Potential Bullish Continuation SetupBitcoin (BTC/USD) is falling towards the buy entry at 118,647.96, which is a pullback support that is slightly above the 50% Fibonacci retracement and could bounce from this leve lto the upside.
Stop loss is at 114,705.13, which is a pullback support that lines up with the 61.8% Fibonacci retracement.
Take profit is at 125,444.07, which is a swing high resistance.
High Risk Investment Warning
Trading Forex/CFDs on margin carries a high level of risk and may not be suitable for all investors. Leverage can work against you.
Stratos Markets Limited (tradu.com ):
CFDs are complex instruments and come with a high risk of losing money rapidly due to leverage. 65% of retail investor accounts lose money when trading CFDs with this provider. You should consider whether you understand how CFDs work and whether you can afford to take the high risk of losing your money.
Stratos Europe Ltd (tradu.com ):
CFDs are complex instruments and come with a high risk of losing money rapidly due to leverage. 66% of retail investor accounts lose money when trading CFDs with this provider. You should consider whether you understand how CFDs work and whether you can afford to take the high risk of losing your money.
Stratos Global LLC (tradu.com ):
Losses can exceed deposits.
Please be advised that the information presented on TradingView is provided to Tradu (‘Company’, ‘we’) by a third-party provider (‘TFA Global Pte Ltd’). Please be reminded that you are solely responsible for the trading decisions on your account. There is a very high degree of risk involved in trading. Any information and/or content is intended entirely for research, educational and informational purposes only and does not constitute investment or consultation advice or investment strategy. The information is not tailored to the investment needs of any specific person and therefore does not involve a consideration of any of the investment objectives, financial situation or needs of any viewer that may receive it. Kindly also note that past performance is not a reliable indicator of future results. Actual results may differ materially from those anticipated in forward-looking or past performance statements. We assume no liability as to the accuracy or completeness of any of the information and/or content provided herein and the Company cannot be held responsible for any omission, mistake nor for any loss or damage including without limitation to any loss of profit which may arise from reliance on any information supplied by TFA Global Pte Ltd.
The speaker(s) is neither an employee, agent nor representative of Tradu and is therefore acting independently. The opinions given are their own, constitute general market commentary, and do not constitute the opinion or advice of Tradu or any form of personal or investment advice. Tradu neither endorses nor guarantees offerings of third-party speakers, nor is Tradu responsible for the content, veracity or opinions of third-party speakers, presenters or participants.

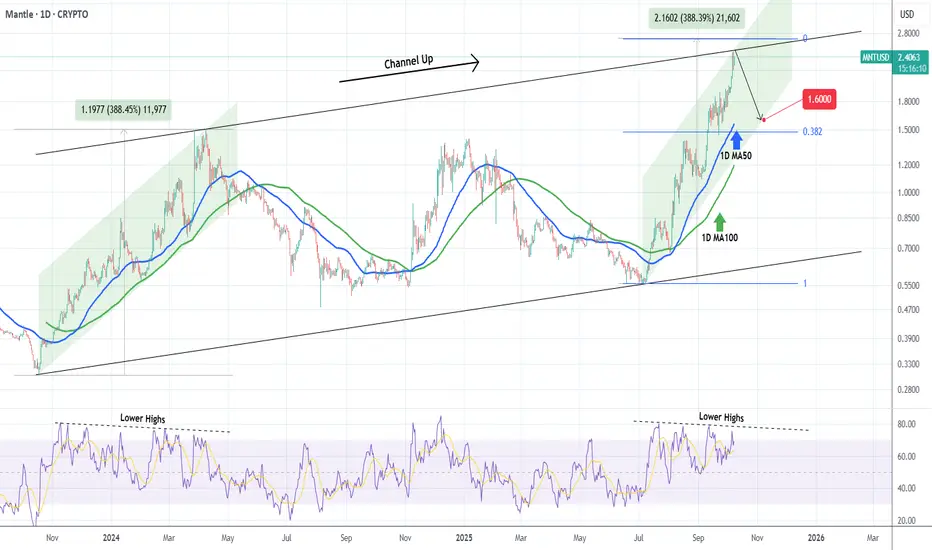
MANTLE Hit the top of its 2-year Channel Up. Correction ahead?Mantle (MNTUSD) has been trading within a Channel Up since its October 18 2023 market bottom and right now the price just hit the top (Higher Highs trend-line) of this pattern.
The current Bullish Leg has almost risen as much as the first one (+388.45%) so technically a pull-back wouldn't be unexpected at this point. Before it resumes the long-term trend and potentially breaks above the Channel Up, we expect the price to test at least its 1D MA100 (green trend-line), which is the typical Support during such Legs, a 1.600.
-------------------------------------------------------------------------------
** Please LIKE 👍, FOLLOW ✅, SHARE 🙌 and COMMENT ✍ if you enjoy this idea! Also share your ideas and charts in the comments section below! This is best way to keep it relevant, support us, keep the content here free and allow the idea to reach as many people as possible. **
-------------------------------------------------------------------------------
💸💸💸💸💸💸
👇 👇 👇 👇 👇 👇
BITCOIN This is the last Resistance standing.Bitcoin (BTCUSD) got rejected (and is currently pulling back) on the Higher Highs trend-line that started on July 14. This is technically the last Resistance before a complete technical bullish break-out that will take the market to a new pattern out of this 3-month consolidation phase.
Until that happens, there are high probabilities to extend this pull-back all the way to the 0.382 Fibonacci extension ($119.5k), which is the minimum level that all similar corrections within these 3 months pulled back to.
As you can see such similar corrections have all been on 4H RSI Bearish Divergences, which have been Lower Highs against BTC's Higher Highs, typical indicator of a Top.
So what do you think will happen next, pull-back or break-out? Feel free to let us know in the comments section below!
-------------------------------------------------------------------------------
** Please LIKE 👍, FOLLOW ✅, SHARE 🙌 and COMMENT ✍ if you enjoy this idea! Also share your ideas and charts in the comments section below! This is best way to keep it relevant, support us, keep the content here free and allow the idea to reach as many people as possible. **
-------------------------------------------------------------------------------
💸💸💸💸💸💸
👇 👇 👇 👇 👇 👇

SOLUSD H4 | Could we see a bearish reversal from here?Based on the H4 chart analysis, we can see the price reacting off the sell entry which is a pullback resistance that aligns with the 78.6% Fibonacci retracement and could reverse from this levle to the take profit.
Sell entry is at 238.31, which is a pullback resistance that aligns with the 78.6% Fibonacci retracement.
Stop loss is at 253.39, which is a swing high resistance.
Take profit is at 216.84, which is a pullback support that is slightly below the 38.2% Fibonacci retracement.
High Risk Investment Warning
Trading Forex/CFDs on margin carries a high level of risk and may not be suitable for all investors. Leverage can work against you.
Stratos Markets Limited (tradu.com ):
CFDs are complex instruments and come with a high risk of losing money rapidly due to leverage. 65% of retail investor accounts lose money when trading CFDs with this provider. You should consider whether you understand how CFDs work and whether you can afford to take the high risk of losing your money.
Stratos Europe Ltd (tradu.com ):
CFDs are complex instruments and come with a high risk of losing money rapidly due to leverage. 66% of retail investor accounts lose money when trading CFDs with this provider. You should consider whether you understand how CFDs work and whether you can afford to take the high risk of losing your money.
Stratos Global LLC (tradu.com ):
Losses can exceed deposits.
Please be advised that the information presented on TradingView is provided to Tradu (‘Company’, ‘we’) by a third-party provider (‘TFA Global Pte Ltd’). Please be reminded that you are solely responsible for the trading decisions on your account. There is a very high degree of risk involved in trading. Any information and/or content is intended entirely for research, educational and informational purposes only and does not constitute investment or consultation advice or investment strategy. The information is not tailored to the investment needs of any specific person and therefore does not involve a consideration of any of the investment objectives, financial situation or needs of any viewer that may receive it. Kindly also note that past performance is not a reliable indicator of future results. Actual results may differ materially from those anticipated in forward-looking or past performance statements. We assume no liability as to the accuracy or completeness of any of the information and/or content provided herein and the Company cannot be held responsible for any omission, mistake nor for any loss or damage including without limitation to any loss of profit which may arise from reliance on any information supplied by TFA Global Pte Ltd.
The speaker(s) is neither an employee, agent nor representative of Tradu and is therefore acting independently. The opinions given are their own, constitute general market commentary, and do not constitute the opinion or advice of Tradu or any form of personal or investment advice. Tradu neither endorses nor guarantees offerings of third-party speakers, nor is Tradu responsible for the content, veracity or opinions of third-party speakers, presenters or participants.

DOGEUSD H4 | Bullish Bounce from SupportBased on the H4 chart analysis, we could see the price fall to the buy entry, which is a pullback support that is slightly below the 23.6% Fibonacci retracement and could bounce from this level to the upside.
Buy entry is at 0.25444, which is a pullback support that is slightly below the 23.6% Fibonacci retracement.
Stop loss is at 0.23819, which is a pullback support that aligns with the 61.8% Fibonacci retracement.
Take profit is at 0.28459, which is a swing high resistance.
High Risk Investment Warning
Trading Forex/CFDs on margin carries a high level of risk and may not be suitable for all investors. Leverage can work against you.
Stratos Markets Limited (tradu.com ):
CFDs are complex instruments and come with a high risk of losing money rapidly due to leverage. 65% of retail investor accounts lose money when trading CFDs with this provider. You should consider whether you understand how CFDs work and whether you can afford to take the high risk of losing your money.
Stratos Europe Ltd (tradu.com ):
CFDs are complex instruments and come with a high risk of losing money rapidly due to leverage. 66% of retail investor accounts lose money when trading CFDs with this provider. You should consider whether you understand how CFDs work and whether you can afford to take the high risk of losing your money.
Stratos Global LLC (tradu.com ):
Losses can exceed deposits.
Please be advised that the information presented on TradingView is provided to Tradu (‘Company’, ‘we’) by a third-party provider (‘TFA Global Pte Ltd’). Please be reminded that you are solely responsible for the trading decisions on your account. There is a very high degree of risk involved in trading. Any information and/or content is intended entirely for research, educational and informational purposes only and does not constitute investment or consultation advice or investment strategy. The information is not tailored to the investment needs of any specific person and therefore does not involve a consideration of any of the investment objectives, financial situation or needs of any viewer that may receive it. Kindly also note that past performance is not a reliable indicator of future results. Actual results may differ materially from those anticipated in forward-looking or past performance statements. We assume no liability as to the accuracy or completeness of any of the information and/or content provided herein and the Company cannot be held responsible for any omission, mistake nor for any loss or damage including without limitation to any loss of profit which may arise from reliance on any information supplied by TFA Global Pte Ltd.
The speaker(s) is neither an employee, agent nor representative of Tradu and is therefore acting independently. The opinions given are their own, constitute general market commentary, and do not constitute the opinion or advice of Tradu or any form of personal or investment advice. Tradu neither endorses nor guarantees offerings of third-party speakers, nor is Tradu responsible for the content, veracity or opinions of third-party speakers, presenters or participants.

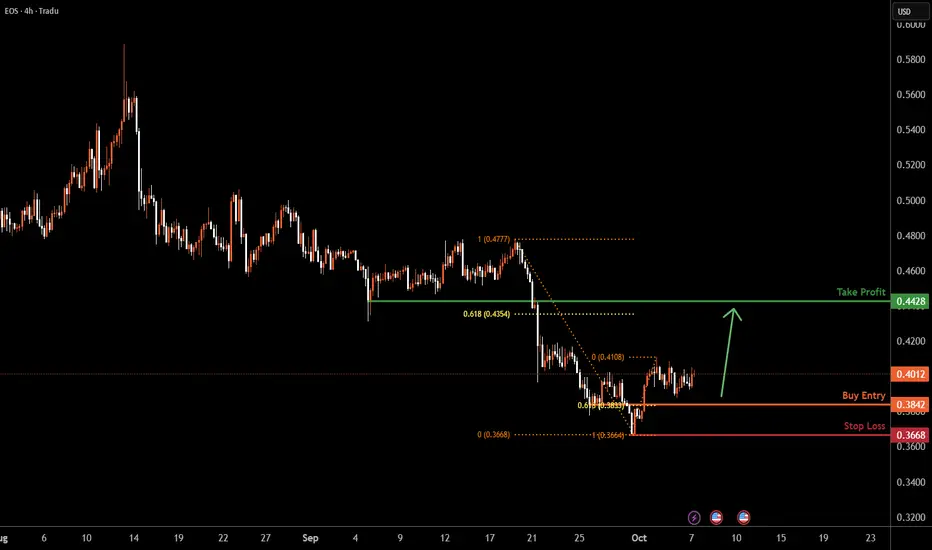
EOSUSD H4 | Potential Bullish Reversal FormingEOSUSD is falling towards the buy entry, which is a pullback support that aligns with the 61.8% Fibonacci retracement and could bounce from this level to the upside.
Buy entry is at 0.3842, which is a pullback support that aligns with the 61.8% Fibonacci retracement.
Stop loss is at 0.3668, which is a pullback support.
Take profit is at 0.4428, which is a pullback resistance that is slightly above the 61.8% Fibonacci retracement.
High Risk Investment Warning
Trading Forex/CFDs on margin carries a high level of risk and may not be suitable for all investors. Leverage can work against you.
Stratos Markets Limited (tradu.com ):
CFDs are complex instruments and come with a high risk of losing money rapidly due to leverage. 65% of retail investor accounts lose money when trading CFDs with this provider. You should consider whether you understand how CFDs work and whether you can afford to take the high risk of losing your money.
Stratos Europe Ltd (tradu.com ):
CFDs are complex instruments and come with a high risk of losing money rapidly due to leverage. 66% of retail investor accounts lose money when trading CFDs with this provider. You should consider whether you understand how CFDs work and whether you can afford to take the high risk of losing your money.
Stratos Global LLC (tradu.com ):
Losses can exceed deposits.
Please be advised that the information presented on TradingView is provided to Tradu (‘Company’, ‘we’) by a third-party provider (‘TFA Global Pte Ltd’). Please be reminded that you are solely responsible for the trading decisions on your account. There is a very high degree of risk involved in trading. Any information and/or content is intended entirely for research, educational and informational purposes only and does not constitute investment or consultation advice or investment strategy. The information is not tailored to the investment needs of any specific person and therefore does not involve a consideration of any of the investment objectives, financial situation or needs of any viewer that may receive it. Kindly also note that past performance is not a reliable indicator of future results. Actual results may differ materially from those anticipated in forward-looking or past performance statements. We assume no liability as to the accuracy or completeness of any of the information and/or content provided herein and the Company cannot be held responsible for any omission, mistake nor for any loss or damage including without limitation to any loss of profit which may arise from reliance on any information supplied by TFA Global Pte Ltd.
The speaker(s) is neither an employee, agent nor representative of Tradu and is therefore acting independently. The opinions given are their own, constitute general market commentary, and do not constitute the opinion or advice of Tradu or any form of personal or investment advice. Tradu neither endorses nor guarantees offerings of third-party speakers, nor is Tradu responsible for the content, veracity or opinions of third-party speakers, presenters or participants.
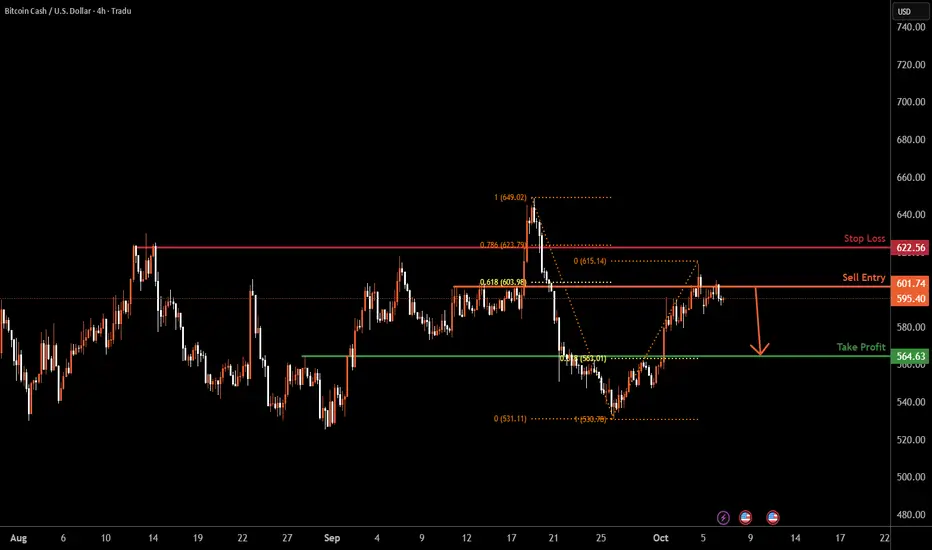
BCHUSD H4 | Bearish reversal from 61.8% Fibonacci resistanceBCH/USD has rejected off the sell entry, which is a pullback resistance that aligns with the 61.8% Fibonacci retracement and could drop from this level to the downside.
Sell entry is at 601.74, which is a pullback resistance that aligns with the 61.8% Fibonacci retracement.
Stop loss is at 643.95, which is a pullback resistance that aligns with the 78.6% Fibonacci retracement.
Take profit is at 564.63, which is a pullback support that aligns with the 61.8% Fibonacci retracement.
High Risk Investment Warning
Trading Forex/CFDs on margin carries a high level of risk and may not be suitable for all investors. Leverage can work against you.
Stratos Markets Limited (tradu.com ):
CFDs are complex instruments and come with a high risk of losing money rapidly due to leverage. 65% of retail investor accounts lose money when trading CFDs with this provider. You should consider whether you understand how CFDs work and whether you can afford to take the high risk of losing your money.
Stratos Europe Ltd (tradu.com ):
CFDs are complex instruments and come with a high risk of losing money rapidly due to leverage. 66% of retail investor accounts lose money when trading CFDs with this provider. You should consider whether you understand how CFDs work and whether you can afford to take the high risk of losing your money.
Stratos Global LLC (tradu.com ):
Losses can exceed deposits.
Please be advised that the information presented on TradingView is provided to Tradu (‘Company’, ‘we’) by a third-party provider (‘TFA Global Pte Ltd’). Please be reminded that you are solely responsible for the trading decisions on your account. There is a very high degree of risk involved in trading. Any information and/or content is intended entirely for research, educational and informational purposes only and does not constitute investment or consultation advice or investment strategy. The information is not tailored to the investment needs of any specific person and therefore does not involve a consideration of any of the investment objectives, financial situation or needs of any viewer that may receive it. Kindly also note that past performance is not a reliable indicator of future results. Actual results may differ materially from those anticipated in forward-looking or past performance statements. We assume no liability as to the accuracy or completeness of any of the information and/or content provided herein and the Company cannot be held responsible for any omission, mistake nor for any loss or damage including without limitation to any loss of profit which may arise from reliance on any information supplied by TFA Global Pte Ltd.
The speaker(s) is neither an employee, agent nor representative of Tradu and is therefore acting independently. The opinions given are their own, constitute general market commentary, and do not constitute the opinion or advice of Tradu or any form of personal or investment advice. Tradu neither endorses nor guarantees offerings of third-party speakers, nor is Tradu responsible for the content, veracity or opinions of third-party speakers, presenters or participants.
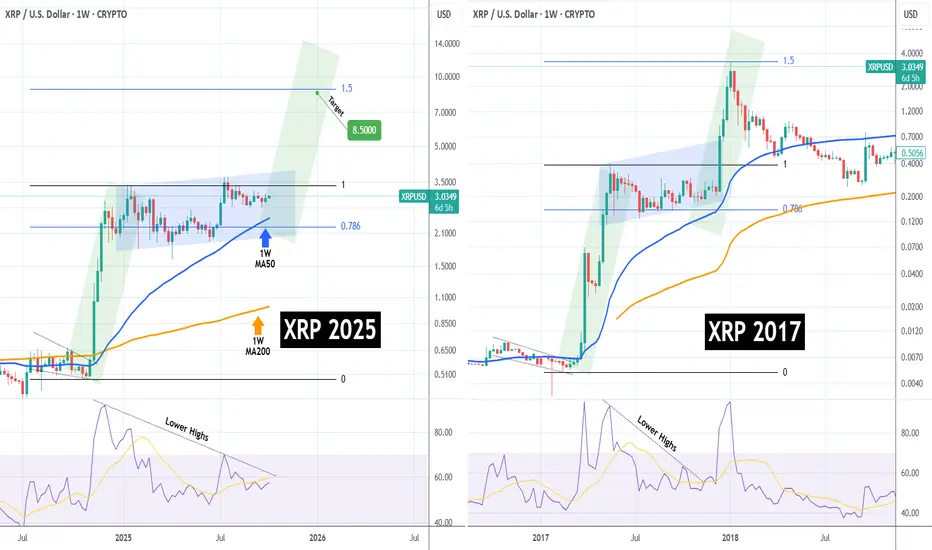
XRPUSD getting ready for its NOW-or-NEVER moment to $8.500XRP (XRPUSD) has been trading sideways since the July 14 2025 High in a growth pattern that resembles 2017. As it approaches the 1W MA50 (blue trend-line), the market gets closer to its now-or-never moment as the 1W MA50 is expected to hold and provide a bullish boost similar to December 11 2017, which made the price rally to its 1.5 Fibonacci extension.
With even the 1W RSI sequences among the two fractals also looking identical, we can see XRP peaking around $8.500 (Fib 1.5 ext), if this model repetition is completed.
-------------------------------------------------------------------------------
** Please LIKE 👍, FOLLOW ✅, SHARE 🙌 and COMMENT ✍ if you enjoy this idea! Also share your ideas and charts in the comments section below! This is best way to keep it relevant, support us, keep the content here free and allow the idea to reach as many people as possible. **
-------------------------------------------------------------------------------
💸💸💸💸💸💸
👇 👇 👇 👇 👇 👇
BITCOIN 125k broke (new ATH) and it's not stopping there!Bitcoin (BTCUSD) hit $125700 yesterday, making a new All Time High (ATH), closing the 2nd strongest 1W candle of the year. This is a confirmed detachment from the Former Resistance-turned-Support trend-line, following a double bottom bounce on the Bull Cycle's (Higher Lows) Buy Zone.
As you can see, this structure is similar to the first green zone bounce in August 2023 that eventually rose to its 2.0 Fibonacci extension before turning sideways for a while. Even the December 16 2024 High was on the 2.0 Fibonacci extension, even though the formation that preceded it (March - October 2024), wasn't that much similar to the other two.
Based on that, we can see BTC approaching $160000 (Fib 2.0 ext).
Do you expect the market to hit that level? Feel free to let us know in the comments section below!
-------------------------------------------------------------------------------
** Please LIKE 👍, FOLLOW ✅, SHARE 🙌 and COMMENT ✍ if you enjoy this idea! Also share your ideas and charts in the comments section below! This is best way to keep it relevant, support us, keep the content here free and allow the idea to reach as many people as possible. **
-------------------------------------------------------------------------------
💸💸💸💸💸💸
👇 👇 👇 👇 👇 👇
