USDT.D - This is the main of reason why BTC Crash!#USDTD
One of the main reasons behind the recent BTC dump is the move in USDT.D.
When USDT dominance goes up, BTC usually goes down, and vice versa.
Over the past few weeks, USDT.D clearly broke out and moved higher, which pressured BTC and led to the drop. When BTC reached around 60k earlier, USDT.D was also hitting a major resistance zone and got strongly rejected. That rejection is what allowed BTC to bounce back toward the 71k area.
Right now, there’s still a chance USDT.D pushes a bit higher into the supply zone and then turns down. If that happens, it would be supportive for BTC and could lead to a move back toward the 80k–83k area.
The negative scenario is if USDT.D continues higher and breaks above resistance. If that plays out, BTC would likely see another strong leg down, with downside risk much lower and USDT.D potentially making new highs above 10%.
For now, everything depends on how USDT.D reacts around this resistance area.
Cryptoidea

BTC.D What's Next? Key confirmation for Altcoin movement.BTC.D
BTC Dominance is now sitting right below a major resistance at 60% – 60.30%. This area has already rejected price multiple times, so this is a decision zone. As long as BTC.D stays below 60%, dominance is vulnerable to a pullback toward 59.44% – 59.15%, which would give more room for altcoins to breathe.
If BTC.D manages to break and hold above 60.30%, then dominance expansion continues and altcoins will likely stay under pressure. Until that breakout happens, this move is still just a test of resistance, not confirmation.
Bias stays neutral here. Let the level decide.

SENT Breakout Confirmed — Next Leg is Loading!#SENT
SEED_ALEXDRAYM_SHORTINTEREST2:SENT has successfully executed a textbook breakout! After a strategic liquidity sweep that cleared out early sellers, the price launched into a significant upward move.
We are currently observing a healthy pullback to retest the newly formed support zone between 0.0305 – 0.0285. This retest is a crucial "loading zone" to gather momentum for a powerful bullish continuation. If the support holds, our primary targets are set at the 2.618 ($0.050) and 3.618 ($0.060) Fibonacci extension levels.
However, disciplined trading requires a plan for every scenario. We must remain cautious; if the support fails to sustain the price and we see a breakdown, the bias shifts.
Specifically, if the price drops below the previous swing low, the bullish structure will be invalidated. Such a move would signal a trend reversal from bullish to bearish, potentially leading to a deeper "lower-low" sequence.
Keep a close eye on the 4H candle closes to confirm if the support is flipping back to resistance.

UAI/USDT Confirms Breakout — Momentum Shifts Up!#UAI
UAI has successfully broken out from its hourly accumulation base, signaling the end of the consolidation phase. Price has also confirmed a breakout above the bullish flag, while the broader structure shows a clean breakout from the symmetrical triangle.
This confluence of structural breaks strengthens the bullish bias and suggests that upside continuation is a matter of timing, with price having room to expand toward higher targets.
However, caution remains necessary. The bullish scenario is only valid as long as price can sustain above the newly formed demand zone.
A failure to hold this area, followed by a breakdown back below demand, would invalidate the bullish structure and shift momentum back to the downside, opening the door for a deeper pullback.

PEPE/USDT Pullback After Breakout — Next Move Loading!PEPE is consolidating after a clear structure shift from the previous downtrend. The descending trendline has already been broken and momentum has flipped, which is a good sign.
Price is now pulling back into a strong demand area. This looks like a healthy retracement, not weakness. As long as this zone holds, the bias stays bullish and PEPE has room to continue higher after consolidation.
If this demand fails, the structure becomes weak again and a deeper pullback is likely. Until then, this is simply a reset before the next move.

BIO/USDT On Accumulation, Get Ready For Exploding Soon?#BIO
BIO has completed a long downtrend and is now moving sideways inside an accumulation base.
Selling pressure is slowing, and price is stabilizing after the breakdown phase
As long as this base holds, the chart favors a slow recovery.
A break above the descending trendline would be the first real sign of trend shift 🚀
If the price loses the bottom support, downside pressure could return

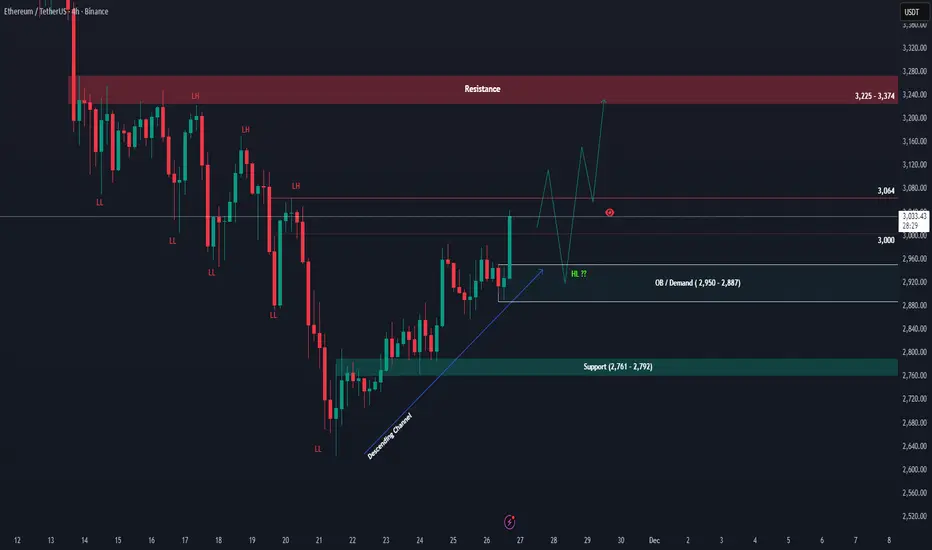
ETH Is Quietly Setting Up a Massive Reversal — Don’t Miss This!ETH 4H & Daily Outlook Update
ETH continues to follow the broader plan we've been watching over the last few days. After tapping the monthly demand zone, price reacted strongly and rebounded from the daily order block, confirming that the higher-timeframe accumulation area is still holding well. This zone remains the key foundation for ETH’s medium-term structure.
On the 4H timeframe, the trend is still technically bearish, with a series of lower highs visible. Price is now testing the supply zone and sitting right around the previous lower low at 3,064. If ETH can break and hold above this level, it would be the first meaningful sign of a trend shift, opening the door for a move toward the major resistance band at 3,225 – 3,374.
If buyers can push higher, a pullback into support or even a revisit of the 2,950 – 2,887 order block is still likely, forming a higher low before continuation. As long as this OB area remains intact, ETH maintains a strong chance to extend upward and retest the resistance zone. But if this OB breaks, the structure weakens and price could slide back toward the deeper support at 2,761 – 2,792.
Overall, ETH returning to the monthly OB was a healthy reset. As long as this region is protected, the higher-timeframe accumulation narrative remains valid.
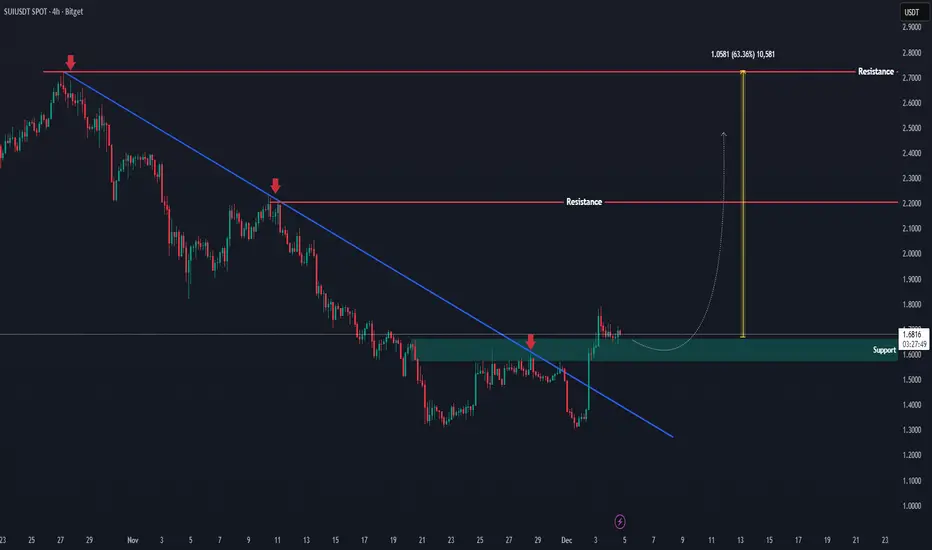
SUI Just Broke Out — A Big Move Might Be Loading!!SUI has finally broken out from its extended downtrend, showing a clean breakout above the descending structure. Price is now retesting the previous rejection zone, which has flipped into an important support area after the breakout.
If this retest holds, the chart suggests a potential continuation toward the next major resistance zone. The structure is showing early signs of a bullish reversal, with momentum beginning to shift to the upside.
For now, the key focus is how price reacts at this reclaimed zone — a strong confirmation here could open the path for a larger move upward.
LINK/USD LONG SET UP(Swing Trade)Entry 1 $12.50
Entry 2 $10.00
Stop loss $8.50
Take profit 1- $16.50
(Close 25%)
Take profit 2- $20.50
(Close 50%)
Take profit 3-$24.50
(Close 75%)
Take profit 4-$28.50
(Close 100%)

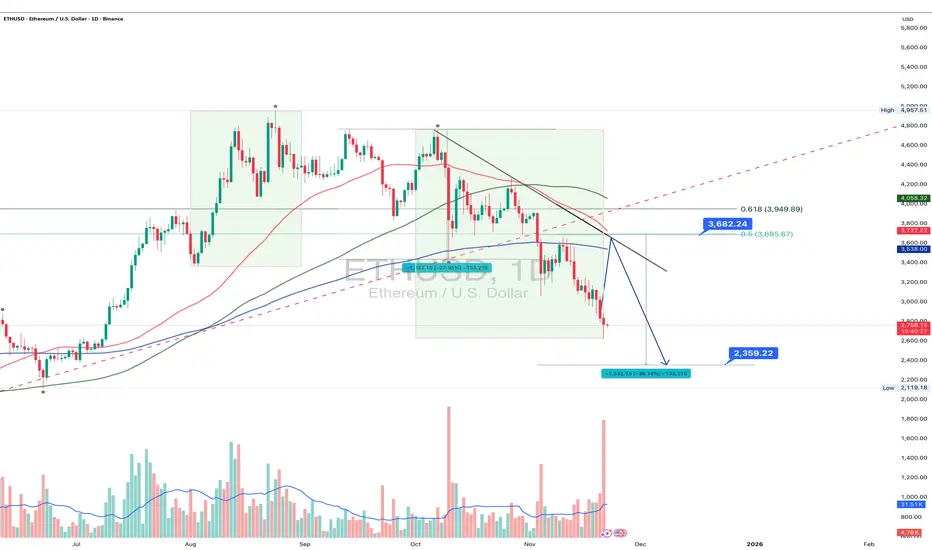
ETH 1D: correction unfolding or just a warm-up?Ethereum continues to trade within a clear bearish structure: after breaking below key daily moving averages, the decline accelerated, pushing the price into the 2720–2800 zone an area that previously acted as a short-term reversal cluster. The trendline from the recent top is broken, and a retest of the 3600–3700 resistance (0.5–0.618 Fib) remains the key scenario before any continuation of the downtrend. Only a confirmed breakout above 3700 would shift the structure back to bullish.
A deeper correction target sits around 2360–2400, where symmetry projections and previous accumulation zones converge.
Fundamental snapshot (Nov 22): network activity is stable, but downward pressure persists due to lower transaction fees and reduced validator revenue. Capital inflows remain weak, and ETH’s dominance continues to erode against L2 networks and alternative L1s. The market is waiting for strong catalysts such as real-world asset tokenization and institutional adoption. In the short term, sentiment leans neutral-to-bearish, supporting the probability of a move toward 2360–2400.
As long as ETH remains below 3600–3700, the bearish scenario holds priority. A breakout above 3700 would flip the structure, but current price action still favors continuation of the correction.
Ethereum is full of surprises - yet price levels tend to be much more disciplined than traders.
LRC/USDT – Horizontal channel. Continuing to work.Loopring - is an open protocol designed for building decentralized crypto exchanges.
CoinMarketCap : #262
Since the publication of my trading idea, the price has reached the resistance zone of the inner channel at $0.3338 (+158%). From there, it retraced back to the support of the outer channel, following the overall market movement.
I've marked potential liquidity grabs (wicks) as well as future target zones in case of a trend reversal on the chart.
Remember, if you're feeling scared right now, so is everyone else. Many have lost faith in a market recovery. Typically, these are strong triggers for position accumulation.
There's no need to guess where the price will go—just build your strategy and follow it.
My previous idea generated solid profit, and I'm now reinvesting from profits using compound interest.

NOTUSDT – broken faith and potential for a reversalNotcoin(NOT) - is a Web3 gaming project launched on January 1 within the TON ecosystem. Technically, Notcoin is an application inside the Telegram messenger. The project attracted users' attention through an announced token airdrop. The developers invited users to mine tokens simply by tapping on their smartphone screens. Within a few months, the game's audience exceeded 35 million people.
📍CoinMarketCap: #170
📍Twitter(X): 2.4M
________________
The NOT token dropped by -94.5% following its listing and a wave of hype. Such a decline is typically accompanied by a loss of faith in its growth and potential.
🔍 What I observe:
The price is moving within a descending channel.
A reversal pattern, the "inverse head and shoulders," is forming in the current zone, with a potential upside of around ~75%.
The key point is a breakout above the outer resistance of the channel.
The token has high liquidity.
NOT is traded on all major exchanges, including the top-tier ones.
It has excellent access to marketing and PR, which is important for pump scenarios.
💭 All key levels, possible scenarios, and targets are marked on the chart. Take them into account when building your own strategy.
________
📌 Not financial advice. Personal view and experience.

ETHUSDT – Reclaiming Liquidity Zone, Eyeing Supply TestETH successfully closed above the $3,350 liquidity area on both the 3D and weekly timeframe, confirming a clean liquidity sweep and reclaim. This type of move often signals the start of a bullish rebound, which we’ve already seen with ETH recovering strongly over the weekend.
Currently, price is likely heading toward the supply zone between $3,930 – $3,795, where we should monitor the reaction closely. A rejection from this zone could trigger a short-term pullback, potentially revisiting the $3,350 support area once again. However, if ETH manages to break and close above this supply, the next major challenge will be the key resistance near $4,089, a crucial level before retesting the All-Time High (ATH) region.
On the flip side, the bearish scenario would be a weekly close below $3,350, opening the door for a deeper retracement toward the Monthly Order Block (OB) zone around $2,878 – $2,125. This could unfold if Bitcoin also drops below the $100K level, reinforcing broader market weakness.

ASTERUSDT – Potential Reaccumulation Phase Before ExpansionAfter a strong impulsive rally in late September, ASTERUSDT is now entering a correctional phase, showing signs of a possible reaccumulation structure. The price has broken below the short-term trendline and is currently trading under the previous supply zone (1.75–1.80), confirming short-term weakness before potential re-entry opportunities.
The Support Zone (1.15–1.30) aligns perfectly with the hourly Order Block (OB) and liquidity pocket, suggesting this region as a high-probability area for manipulation or a liquidity sweep before the next bullish leg.
The ideal scenario would be a fake breakdown toward 0.85–1.00, triggering stop hunts, followed by a sharp rebound reclaiming the 1.15–1.30 levels — confirming bullish intent.
A successful manipulation and reclaim could drive the next expansion phase toward 2.40+, completing the reaccumulation cycle.
Key Highlights:
Trendline break with short-term bearish correction
Support Zone and OB (1H) between 0.85–1.02
Potential bullish continuation target: 2.40
Setup invalid below 0.80
Final Thoughts:
ASTER is likely setting up for a deep retest before continuation. Patience is key here — let liquidity form around the lower range. If structure confirms recovery from the support zone, the next impulsive wave could deliver a strong upside toward the previous high.

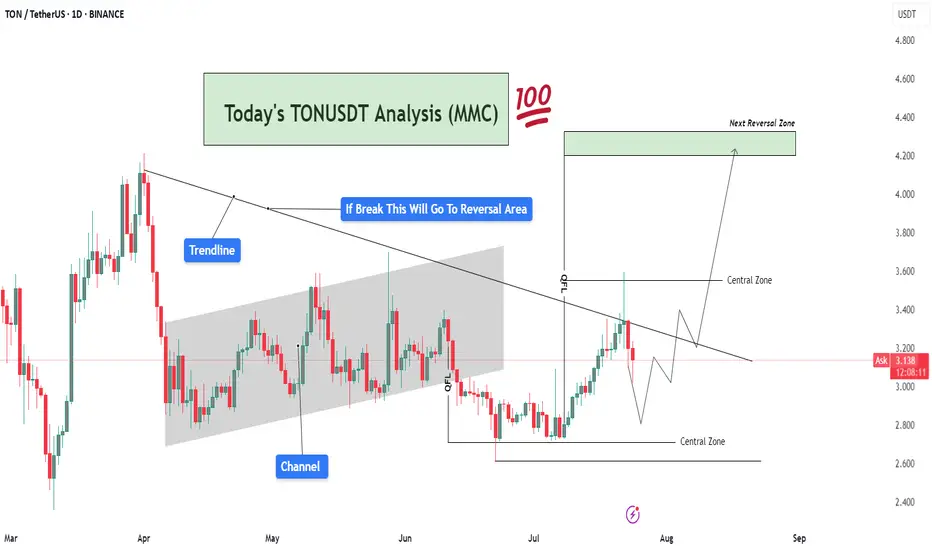
TONUSDT Analysis – Trendline Breakout Target To Reversal Area🧠 Market Sentiment & Context:
TONUSDT (Toncoin vs USDT) is currently trading at $3.13, showing signs of compression within a well-defined MMC structure. After forming a clear QFL (Quick Flip Level) base, the market is approaching a decisive breakout level, with a strong rejection or breakout likely in the coming days.
This chart displays confluence from trendlines, channel breaks, central zones, and QFL demand zones, providing multiple layers of structure-based decision-making. Here's a deeper dive 👇
🔍 Technical Breakdown – What the Chart Is Telling Us:
🔸 1. Major Trendline Resistance – Bearish Control Zone
The descending trendline drawn from prior highs is acting as dynamic resistance.
Price tested this line recently and faced rejection, showing that sellers are still active.
However, the consolidation below the trendline suggests accumulation, not panic selling — a classic sign of smart money positioning before a breakout.
🔸 2. Previous Channel Structure – Broken & Retested
The price previously moved inside a slightly rising parallel channel, reflecting a slow and steady bullish phase.
The channel has now been broken, but TON quickly reclaimed structure via a strong bullish engulfing candle from the QFL base, hinting that this was a liquidity grab (stop hunt) before the real move.
🔸 3. QFL (Quantity Following Line) – Institutional Demand Zone
The QFL base at around $2.85–$3.00 was created after a swift sell-off followed by immediate bullish response.
This is a high-probability MMC reversal structure, where large buyers typically enter.
Since this QFL held firm, it has created a solid foundation for bullish momentum, provided the trendline is eventually broken.
🧭 What's Happening Now – Price Action Update:
Price is caught between two major Central Zones:
Lower Zone: $2.85 – $3.15 (Support)
Upper Zone: $3.50 – $3.70 (Resistance)
The current movement shows price creating higher lows, indicating bullish pressure building beneath the trendline.
Volume remains low, which means the market is waiting for a catalyst (news or breakout) before a directional push.
📌 Key Reversal Zone Ahead – Eyes on $4.20 to $4.40
If price breaks and closes above the descending trendline and crosses the upper central zone, we can anticipate a strong bullish move toward the Next Reversal Zone marked around $4.20–$4.40.
This zone has historical confluence as:
Previous strong supply zone
Psychological round number
Fibonacci extension alignment
This will likely be the profit-booking area for swing traders and early buyers from the QFL zone.
📈 Trade Scenarios Based on MMC:
✅ Bullish Scenario (High Probability If Breakout)
Price breaks the trendline → Pullback → Retest of $3.50–$3.60 zone
Bullish continuation to $4.20–$4.40 Reversal Zone
Ideal entry on retest after breakout
Stop-loss below $3.00
❌ Bearish Scenario (If Rejected Again)
Rejection from trendline leads to re-test of lower Central Zone
Breakdown of QFL level (~$2.85) would invalidate bullish setup
Potential drop toward $2.60 zone for liquidity sweep
🧠 MMC-Based Observations:
🔹 MMC Element 📍 Explanation
🔺 Trendline Key resistance from macro downtrend
🟩 Central Zones Neutral battleground for buyers/sellers
🔻 Channel Break Confirmed bearish momentum earlier, now tested
✅ QFL Strong base, showing early smart money entries
🎯 Reversal Zone High-risk area, expect volatility and profit-taking
📌 Strategic Summary:
Bias: Bullish (as long as price holds above $3.00)
Confirmation Needed: Daily candle close above trendline & $3.50 zone
Target 1: $3.85
Target 2: $4.20–$4.40 (main reversal)
Invalidation: Close below $2.85 (QFL loss)
🚨 Final Thoughts:
TONUSDT is showing clear smart money footprints via the QFL formation and trendline pressure. The setup is ideal for MMC-based breakout traders waiting for confirmation before entering. Volume spike + trendline break will likely spark the next impulsive rally.
Stay patient, and trade the reaction, not the prediction.
BTC/USDT LONG SET UP (BITCOIN)Entry Price 1: $118,000
Entry Price 2: $116,500
Stop Loss: $115,000
Take Profit 1: $121,000 (Close 25%)
Take Profit 2: $124,000 (Close 50%)
Take Profit 3: $127,000 (Close 75%)
Take Profit 4: $130,000 (Close 100%)

BTC Forming Bullish Structure — But Wait for the Higher LowAfter months of lower lows and lower highs, Bitcoin has finally broken structure by pushing above the previous lower high, officially forming a new higher high (HH). This is an early sign of a potential trend reversal back into bullish territory.
However, before momentum continues upward, a healthy retracement could occur. The key level to watch is the support zone around $91,200. If price pulls back and forms a higher low (HL) here or slightly lower around the $88,700–$87,500 zone, it would confirm the bullish structure and potentially kickstart the next leg up.
Patience is key here — let the higher low form before looking for long setups.

SOL/USD LONG SET UPTitle: BUY SOL/USD LONG
Order Type: MARKET BUY
Time Frame: 1D
entry 1- 200.50
entry 2- 180.50
stop loss 160.50
take profit 1 $220.50
take profit 2- $240.50
take profit 3- $260.50
take profit 4- $280.50

#Ether is breaking out#EthUsd is breaking out with wave 3. #Ethereum could reach $6500 per coin with wave 3.

Is TAOUSDT Ready to Skyrocket? The 250% Opportunity Awaits!The big picture is coming together for TAOUSDT, and it’s looking explosive! Let’s break down this visually stunning setup that could catapult this asset by an incredible 250%. Are you ready to ride this wave? Here’s why this could be a game-changing breakout:
1️⃣ The Perfect Rounded Bottom Formation
The chart paints a classic rounded bottom, a powerful bullish reversal pattern.
Key Support Zone : TAOUSDT built a solid foundation within the support area, tested multiple times for strength.
Steady Volume Accumulation: The increasing volume during the base formation hints at smart money quietly entering the market.
This setup signals that momentum is building, and the next leg up is in sight.
2️⃣ Breakout from the Bullish Flag
After the rounded bottom, the market formed a bullish flag, a textbook continuation pattern. This flag represents a brief consolidation phase, preparing for the next explosive move upward.
Volume Surge : Notice how volume spiked at the breakout point? That’s confirmation of buyer interest stepping in.
Momentum Reset : The consolidation allowed TAOUSDT to cool off, priming for a much bigger move ahead.
3️⃣ The Target: A Staggering 250% Move
The measured move projection for this breakout is 1,800$, representing a massive 250% gain from current levels. With the pattern's precision and volume confirmation, this target becomes a realistic possibility.
Here’s why this move could be the real deal:
✅ Rounded bottom = trend reversal signal.
✅ Bullish flag = continuation of momentum.
✅ Exceptional volume = confirmation of strength.
4️⃣ What Traders Should Watch For
💡 Key Support Zone: If the price retests the green support area around 470-500, it could offer a golden entry opportunity.
💡 Breakout Continuation: A clean break above the recent highs of around 640 will confirm that the momentum is intact.
💡 Volume Spike: Sustained volume will fuel this potential 250% rally.
Conclusion: A Bullish Wave is Loading! 🌊
The TAOUSDT chart is screaming opportunity, with a rounded bottom, a bullish flag, and exceptional volume setting the stage for a parabolic move. With a 250% target on the horizon, now is the time to stay sharp and capitalize on this explosive setup.
🚨 Don’t just watch the move – position yourself for it. TAOUSDT is ready to make history. Are you? 🚨

MKRUSDT LONG ideaThis is my view on MKR.
I don't like to get inCMP long right now, I prefer to wait for a smaller pullback.
The green box is the space for long, the red box is for taking profit.
I recommend leverage 2 - 4. And SL based on your risk management!
GL!
MLong

FXSUSD 1WFXS ~ 1W 📈
#FXS This is an accumulation area, make purchases gradually from here with a minimum target of 20%++

RAREUSD 1W RARE ~ 1W 📈
#RARE Make purchases gradually from here, with a minimum target of 20%+ from here.
