Ethereum Daily Technical Signal: Buy and Target 4330Ethereum Daily Technical Analysis
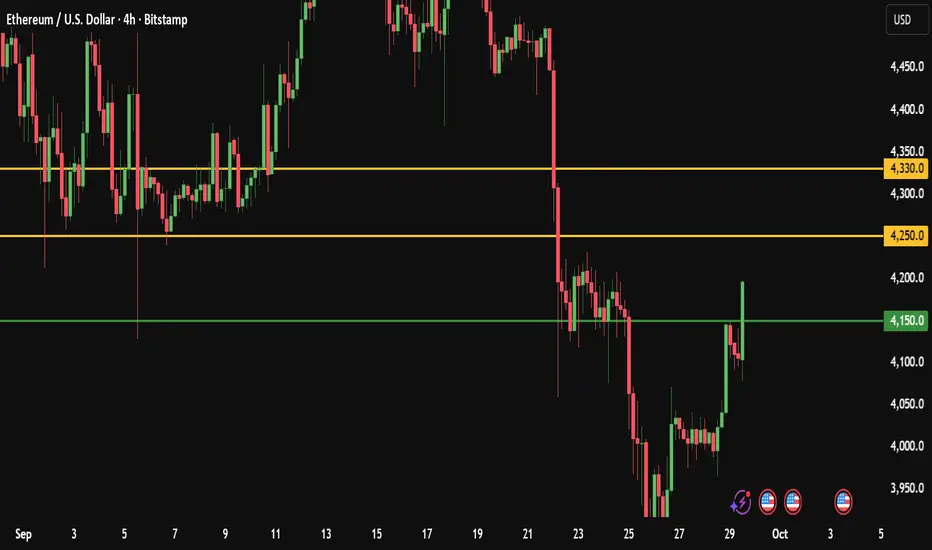
Ethereum is currently showing signs of strength as it tests the key resistance level around 4150.
A confirmed 4H candle breakout above this zone could trigger fresh bullish momentum, opening the door for higher targets in the short term.
My Personal Long Setup
If the price breaks and closes a 4H candle above 4150, I will enter a long position.
🎯 Target 1: 4250
🎯 Target 2: 4330
❌ Stop-loss: 4040
👍 Don’t forget to boost this trading idea if you found it helpful,
and follow me for more daily crypto insights and trade setups.
⚠️ Please note:
This is not financial advice – I’m only sharing my personal trades.
Always do your own research before taking action.
Best of luck 🌹
Cryptolevels
Daily Bitcoin Signal: Watching the 112,600 Breakout, target 115K
Bitcoin Daily Numeric Analysis
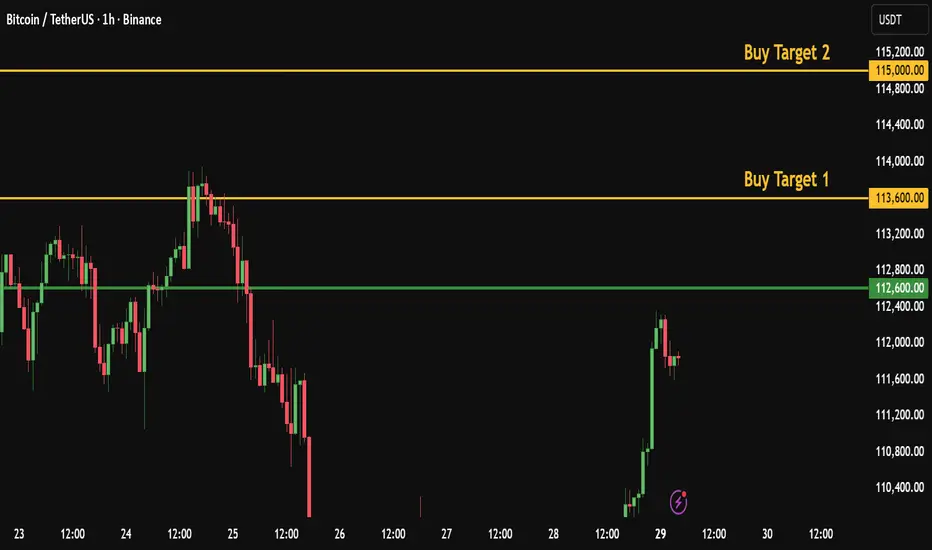
Bitcoin is currently showing signs of strength as it tests the key resistance level around 112,600. A confirmed breakout above this zone could trigger fresh bullish momentum, opening the door for higher targets in the short term.
My Personal Long Setup
If price breaks and closes a 1H candle below 109,150, I will enter a short trade.
🎯 Target 1: 108,250
🎯 Target 2: 107,500
❌ Stop-loss: 110,600
👍 Don’t forget to boost this trading idea if you found it helpful,
and follow me for more daily crypto insights and trade setups.
Please note:
This is not financial advice – I’m only sharing my personal trades.
Always do your own research before taking action.
Best of luck 🌹
Ethereum $ETH crypto trade idea using the weekly demand levelThere is an Ethereum CRYPTOCAP:ETH crypto trade idea using the weekly demand at $3,872. This is a very similar crypto swing trade idea I recently shared with BitCoin. Let's see if it wants to rally for a couple of weeks. You can use the smaller timeframes to trade crypto intraday strategies or scalping strategies.

BTC where are going from here?See the analysis I have made with BTC still some lows to be had however if we break that high then possible run up to the 120's makes sense
Stay cautious
Kris/Mindbloome Exchange

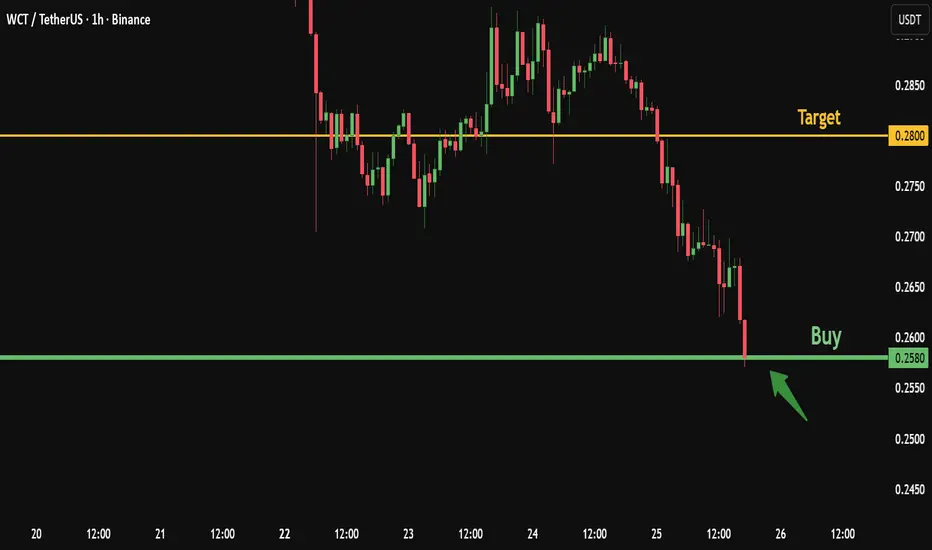
Don’t Miss WCT at Its Lowest Levels – Strong Buy SetupWCT is currently trading near its lowest levels, with the downtrend showing signs of exhaustion and price approaching its historical listing zone.
This creates an attractive risk–reward setup for potential buyers.
Here’s my personal trade plan:
✅ Entry : Buy from current price 0.2580
🎯 Target : 0.2800
The coin is at its bottom range, so if it falls further to 0.2300, I will add another buy position.
And if it reaches the historical listing price at 0.216, that would provide a great long-term buying opportunity once again
Please note:
This is not financial advice – I’m only sharing my personal trades.
Always do your own research before taking action.
👍 Don’t forget to like if you found this useful, and feel free to follow me for more analysis of this kind.
Best of luck 🌹
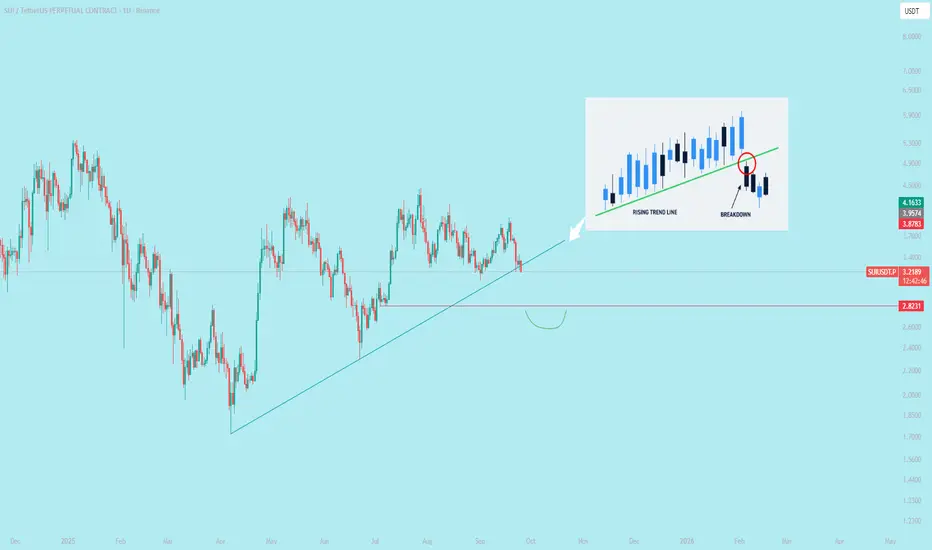
$SUI Trendline breakdownA trendline breakdown occurs when the price of an asset falls below a trendline, signaling a potential reversal or shift in market momentum. Here’s how it works, explained concisely:
1. **Trendline Definition**: A trendline is a diagonal line drawn on a price chart connecting higher lows in an uptrend or lower highs in a downtrend, indicating support or resistance levels.
2. **Breakdown Process**:
- In an **uptrend**, a trendline connects higher lows, acting as support.
- A breakdown happens when the price closes below this trendline, suggesting buyers are losing control and sellers are gaining momentum.
- The break often indicates the end of the uptrend, potentially leading to a price decline or consolidation.
3. **Confirmation**:
- A single candle closing below the trendline may not confirm a breakdown.
- Traders often wait for additional signals, like a strong bearish candle, increased selling volume, or a retest of the trendline (where price fails to reclaim it).
4. **Key Factors**:
- **Volume**: Higher volume on the breakdown strengthens its validity.
- **Timeframe**: Breakdowns on longer timeframes (e.g., daily or weekly) are more significant than on shorter ones (e.g., hourly).
- **Retest**: Price may return to test the broken trendline as resistance before continuing downward.
5. **Implications**:
- A breakdown can signal a trend reversal (from bullish to bearish) or a temporary pullback.
- Traders may use it to enter short positions, set stop-losses above the trendline, or exit long positions.
6. **False Breakdowns**:
- Sometimes, price briefly dips below the trendline but quickly recovers, known as a "fake out."
- To avoid this, traders use additional indicators like moving averages, RSI, or support levels for confirmation.
**Note**: Always combine trendline analysis with other technical indicators and risk management, as breakdowns are not foolproof signals. Market conditions and news can also impact outcomes.
Double Bottom!25-09-2025
Double bottom with Bullish Divergence.
Crossing the LH may lead it towards the mentioned target.

$BTC beautiful range to play i will looking for short!lower time frame rejection call lead us for more downside ! keep eye on it..

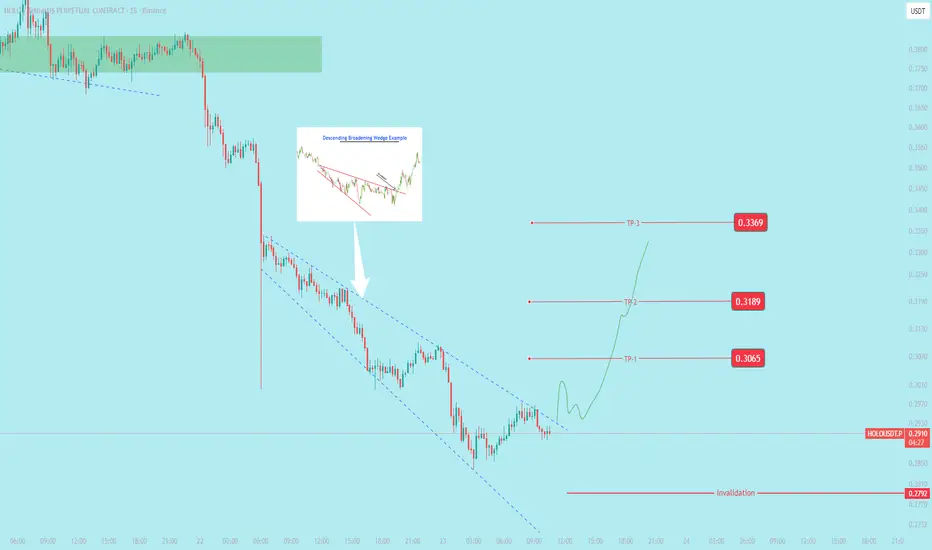
$holoworld forming descending broadening wedge pattern; await bbullish chart pattern that signals a potential reversal of a downtrend. Unlike a normal wedge, where trendlines converge, the trendlines in a broadening wedge diverge, showing increased volatility
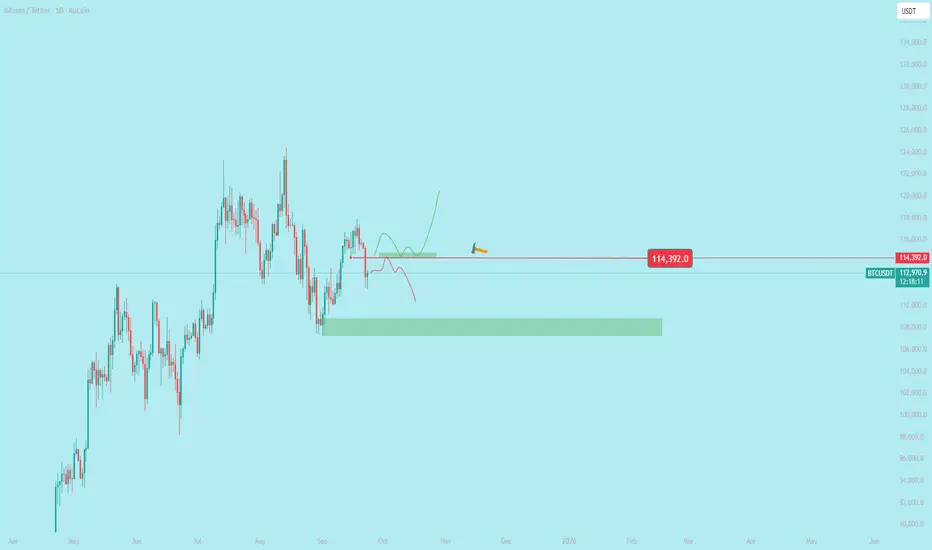
Bitcoin Price Update and Trading Plan
**Current Situation**:
Bitcoin (BTC) is at a critical level, and its weekly closing price is highly important for traders. A strong bounce from the current price, followed by a weekly close above **$114,500**, is needed to confirm bullish momentum. This could lead to a significant upward move, allowing traders to capitalize on the next strong price movement. However, BTC should first retest its key support level, which it previously broke, to confirm its strength. If rejected at this support, a downward move toward **$108,000** is possible.
**Trading Plan**:
1. **Bullish Case**:
- **Condition**: If BTC bounces from its current level and closes above **$114,500** on the weekly chart, it signals strong bullish momentum.
- **Action**: Enter a long position targeting higher levels, such as **$117,200-$120,000**.
- **Stop Loss**: Place below **$114,000** to manage risk.
- **Rationale**: A close above **$114,500** confirms support and sets the stage for the next upward move.
2. **Bearish Case**:
- **Condition**: If BTC fails to hold above **$114,500** and breaks below the key support, it may retest the **$108,000-$110,000** zone, where it previously found support.
- **Action**: Wait for confirmation of a bounce at **$108,000** for a potential long trade, or short if rejection occurs at this level.
- **Stop Loss**: For shorts, place above **$115,000** to limit risk.
- **Target**: A downward move could target **$108,000**, with further declines possible if selling pressure increases.
- **Rationale**: A rejection at **$108,000** after breaking key support indicates bearish pressure, potentially leading to a deeper correction.
**Key Levels to Monitor**:
- **Support**: **$114,500** (immediate), **$108,000-$110,000** (major support zone).
- **Resistance**: **$117,200-$118,000** (immediate), **$120,000+** (next target).
- **Weekly Close**: The weekly close on September 28, 2025, will determine whether BTC confirms bullish strength or signals a deeper pullback.
**Conclusion**:
For a bullish outlook, BTC needs to close above **$114,500** to confirm a bounce and target higher levels. If it fails, traders should prepare for a potential retest of **$108,000**, where a rejection could lead to further downside. Monitor price action closely and use tight risk management due to BTC’s volatility.
*Disclaimer*: Cryptocurrency trading is highly risky. This is not financial advice; always conduct your own research before trading.
Bitcoin Long Trade Signal, Buying with the Whales at 110KI noticed large buy orders from market whales and strong buying momentum accumulating around the 110,000 level.
The current drop supports demand accumulation at the same area.
I will enter a long position from 110,000 with quick targets.
Here’s my personal trade plan:
✅ Entry 1: Buy from 110K
✅ Entry 2: If price dips, add another buy at 107K
🎯 Target 1: 111,100
🎯 Target 2: 112,000
Stop-loss: For both entries, a daily close below 107K
Please note:
This is not financial advice – I’m only sharing my personal trades.
Always do your own research before taking action.
👍 Don’t forget to like if you found this useful, and feel free to follow me for more analysis of this kind.
Best of luck 🌹

HYPE Swing Long IdeaHYPE Swing Long Idea
📊 Market Sentiment
FED has resumed its rate-cutting cycle, starting with a 0.25% cut in September, with two more 0.25% cuts expected in the coming months. Additionally, institutional liquidity inflows have accelerated as the U.S. officially adopts crypto as part of its reserves. While inflation remains elevated, the weakening labor market is forcing the FED to ease, driving more capital into risk-on assets.
📈 Technical Analysis
Price broke the HTF Key Level and closed above, leading to price discovery.
It is also supported by the HTF Bullish Trendline.
Currently, price is retracing from its discovery highs.
📌 Game Plan
1-Retest of HTF Key Level at $50
2-Retest of HTF Bullish Trendline
3-Possible retrace into Fibonacci EQ (discount zone) at $47.55
🎯 Setup Trigger
• 4H break of structure after retest
• Alternative: Daily close back above HTF Bullish Trendline in case of deviation (deviation entry method)
📋 Trade Management
Stoploss: Below the 4H swing low that breaks structure
Target: $59.5 (ATH)
Carrying 25% runner with stop at breakeven for extended gains
💬 Like, follow, and comment if you find this setup valuable!
⚠️ Disclaimer: This content is for informational and educational purposes only and does not constitute financial, investment, or trading advice. Always DYOR before making any financial decisions.

Ethereum Elliott Wave Buy Setup: Targets 4550 and 4600Ethereum Daily Update (Elliott Wave Setup)
Based on my daily monitoring of Ethereum and according to the Elliott Wave count (which I’ll share shortly with the full analysis), I see a long opportunity forming.
Here’s my personal trade plan:
✅ Entry 1: Buy from current price 4450 / 4445
✅ Entry 2: If price dips, add another buy at 4400
🎯 Target 1: 4550
🎯 Target 2: 4600
Stop-loss: For both entries, a daily close below 4350
Please note:
This is not financial advice – I’m only sharing my personal trades.
Always do your own research before taking action.
👍 Don’t forget to like if you found this useful, and feel free to follow me for more analysis of this kind.
Best of luck 🌹

BTC Trade Idea: Short from 117,850 at previous resistance level
Bitcoin is currently at a previous resistance level 117,500 where the price has bounced down before.
Personally, I will enter a short trade from the current price with a tight stop-loss.
✅ My Personal Strategy:
Entry: Sell from current price 117,850
🎯 Target 1: 116,000
🎯 Target 2: 115,500
Stop Lose : Daily close above the resistance level 117,500
Please note:
This is not financial advice – I’m only sharing my personal trades.
Always do your own research before taking action.
👍 Don’t forget to like if you found this useful, and feel free to follow me for more analysis of this kind.
Best of luck 🌹

BitCoin $BTC weekly demand level helping the strong rallyWeekly demand imbalance is still in control and is playing out well. A third large bullish candlestick body is being created. Trying to break the resistance level and the all-time highs.

BCH 1D analysisHere is an analysis of BCH on daily TF. If it break the resistance with successful retest it will go up. possible targets are given on charts. Higher target is up tp $900.

Bitcoin Under Pressure, Correction or Breakout Ahead ?Regarding the overall trend, BTC is currently in a corrective phase after a strong rally from March to July, and is now facing a key resistance zone between 114,500 – 117,500 USDT.
🔸 The price failed to break the recent high at 117,500.
🔸 A clear supply order block is visible between 116,500 – 117,300 USDT, acting as strong selling pressure.
🔸 There’s also a partial Fair Value Gap (FVG) between 111,000 – 113,000 USDT, which may get retested.
📈 If BTC breaks above 117,500, the likely scenario is a rally toward the major resistance at 124,000 USDT, where a potential Double Top formation may occur with a possible failed second high.
📉 On the other hand, if support at 114,500 is broken, the price could head toward the strong support zone around 110,000 – 107,000 USDT.
💡 Trade Idea (Short-Term):
Entry: Sell from price ~117,500
🎯 TP1: 114,600 (Consider closing 50% here)
🎯 TP2: If 114,600 breaks, hold the remaining position for a move toward 110,000
SL: Daily close above 117,500 (If this happens, trend flips bullish and a long trade toward 124,000 can be considered).
Please note:
This is not financial advice – I’m only sharing my personal trades.
Always do your own research before taking action.
👍 Don’t forget to like if you found this useful, and feel free to follow me for more analysis of this kind.
Best of luck 🌹

ANFIBO | BTCUSD on 09.17.2025 to 09.21.2025 I guess ???Hello guys, Anfibo's here! 👋
I think BITSTAMP:BTCUSD is bullish on the uptrend channel and still holding strong without any break. BTC may retest the support zone of $111.000 and re-reach the resistance levels of $123.000 and $127.000, and possibly up to $135.000.
Here's my setup:
✅ BUY SCALP: 110 - 111, SL 107, TP 122 - 126
❌ SELL SCALP: 126 - 128, SL 130, TP 120 - 114
Wishing my followers all the best <3

Liquidity Trap or Smart Money Play? SUI Price Poised for Big Liquidity Trap or Smart Money Play? SUI Price Poised for Big Move Ahead”\
👋 Hello Traders & Investors,
Looking at SUI, the price action is showing a very interesting structure between the support zone ($11B – $11.5B) and the resistance zone ($14.5B – $15.5B). We already saw a strong impulse leg earlier, followed by a deep pullback, which created a clear lower high formation. Since then, the market has been rejecting each rally attempt and moving inside a descending structure, proving that sellers are still trying to keep control.
What stands out is the fake break below support — a classic liquidity grab where weak hands were shaken out before price quickly bounced back. Since then, liquidity has been building along the descending line, suggesting that the market is preparing for a possible stronger move.
From my perspective, the support zone is the key. As long as $11B continues to hold, there’s a high probability of seeing a sharp bullish reaction targeting the $14B area and potentially higher if momentum follows through. But if this support breaks convincingly, we may first see a deeper correction before any meaningful reversal begins.
⚡ My Opinion: This setup is worth watching closely. I believe buyers are waiting at the support to trigger a strong move upward, and the next liquidity sweep could fuel the rally. For me, the plan is simple — watch the reaction at $11B and ride the momentum toward the $14B–$15B region if confirmation comes.

SUI Swing Long Opportunity - AltcoinSUI Swing Long Opportunity
📊 Market Sentiment
Market sentiment remains strongly bullish as the FED is expected to deliver a 0.25% rate cut, with speculation building for a possible 0.5% cut in September. Monetary policy shifts are being driven by both inflation trends and weakening labor market data. The latest August and September job reports were soft, signaling that the economy is cooling rapidly. This environment continues to fuel expectations for a major bullish run in the weeks ahead.
📈 Technical Analysis
Price ran the HTF liquidity and bounced from there.
Price tested the HTF key resistance level three times and was rejected, but today it finally broke and closed above the HTF key SR. I expect this level to hold.
Price also broke the bearish trendline that had been controlling the bearish trend since July 27th.
📌 Game Plan
I will be looking to build a long position when we retest the broken HTF Key Level at $3.44.
Possibly, price may also retest the broken trendline, but I won’t be relying on that scenario.
🎯 Setup Trigger
Retest of the broken HTF key level.
📋 Trade Management
Stoploss: $3.34 (below the HTF key level with 2 consecutive 4H candle closures)
Target:
TP: $3.71
💬 Like, follow, and comment if you find this setup valuable!
⚠️ Disclaimer: This content is for informational and educational purposes only and does not constitute financial, investment, or trading advice. Always do your own research before making any financial decisions.

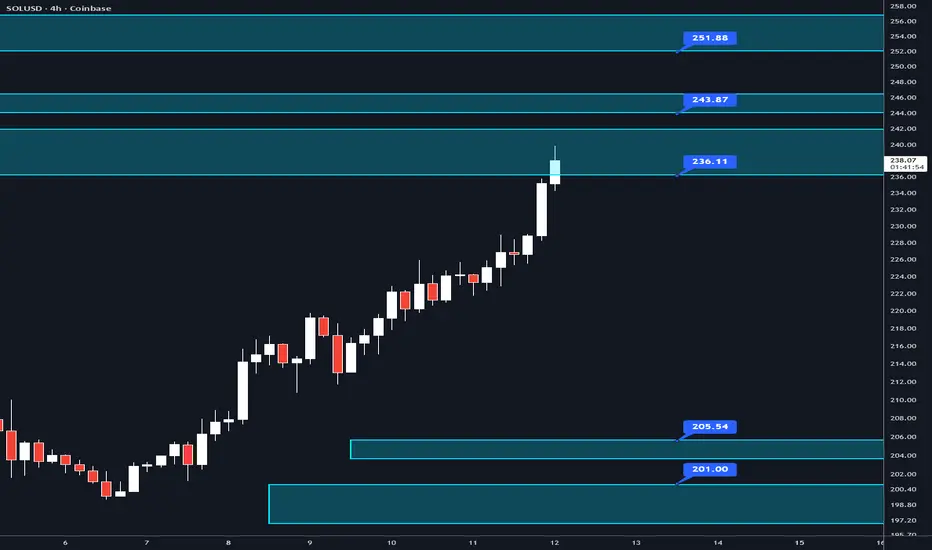
SOLUSD – Key Confluence Levels to WatchHere are some levels on SOLUSD worth noting. The goal is to show how confluence builds around certain areas of price, not to predict direction.
$197 - $201 → Naked weekly level, two naked daily levels, daily naked POC, poor low, and a naked weekly VAL.
$203.50 - $205.50 → Current monthly POC, weekly naked POC, and a poor low.
WHERE SOL IS NOW: $237 - $242 → All time high range POC which is extremely important, and weekly naked VAH.
$244 - $246.50 → Important wick high, all time high range VAH, and a single print.
$252 - $256.50 → Naked weekly, monthly naked POC, weekly naked POC, daily naked POC, weekly time POC, and a naked daily level.
When multiple levels line up (high timeframe levels, point of controls, value areas, liquidity levels, TPO levels, etc), the level tends to attract more attention and liquidity. That makes it an important ‘decision point’ — even without predicting bullish or bearish outcome.
If you’re new to concepts and levels like these, don’t worry — these terms can feel overwhelming at first. Feel free to drop a comment or send me a message if you’d like me to explain any of them in more detail. Always happy to help.
This post is educational only. No predictions or trade signals. If you find this helpful, follow for more breakdowns of confluence levels.
Bullish rise?Ethereum (ETH/USD) is reacting off the pivot and could rise to the 1st resistance, which is a pullback resistance.
Pivot: 4,437.74
1st Support: 4,264.46
1st Resistance: 4,691.58
Disclaimer:
The above opinions given constitute general market commentary, and do not constitute the opinion or advice of IC Markets or any form of personal or investment advice.
Any opinions, news, research, analyses, prices, other information, or links to third-party sites contained on this website are provided on an "as-is" basis, are intended only to be informative, is not an advice nor a recommendation, nor research, or a record of our trading prices, or an offer of, or solicitation for a transaction in any financial instrument and thus should not be treated as such. The information provided does not involve any specific investment objectives, financial situation and needs of any specific person who may receive it. Please be aware, that past performance is not a reliable indicator of future performance and/or results. Past Performance or Forward-looking scenarios based upon the reasonable beliefs of the third-party provider are not a guarantee of future performance. Actual results may differ materially from those anticipated in forward-looking or past performance statements. IC Markets makes no representation or warranty and assumes no liability as to the accuracy or completeness of the information provided, nor any loss arising from any investment based on a recommendation, forecast or any information supplied by any third-party.

SOLUSDT NEW TIMES COMING? Thank you for reading this update.
Solona looks to have a new incoming volume
Will this bring this volume Solana to $100 with time?
This volume depends on day trade and has no guarantees for the long term.
