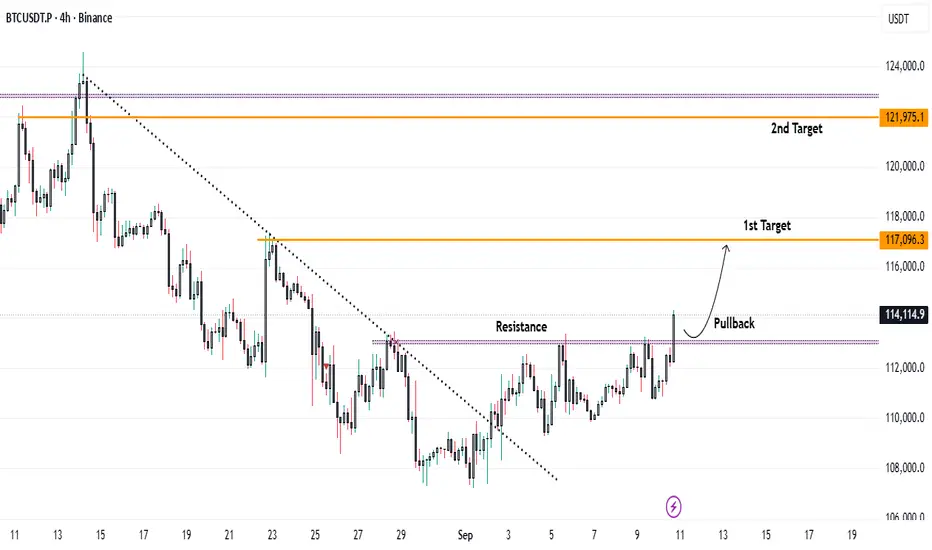
Bitcoin Breaks Key Resistance – Upside Targets in Focus...Bitcoin has been consolidating below the $113,000 resistance level over the past few sessions. On the hourly timeframe, price has now successfully broken above this barrier and is sustaining the breakout.
📈 Trading Outlook:
* A pullback towards $113,000 could offer a favorable long entry opportunity.
* Upside Targets:
* First target: $117,000
* Second target: $122,000
The breakout and successful close above resistance suggest strong bullish momentum, provided price holds above the $113,000 zone.
Cryptolevels
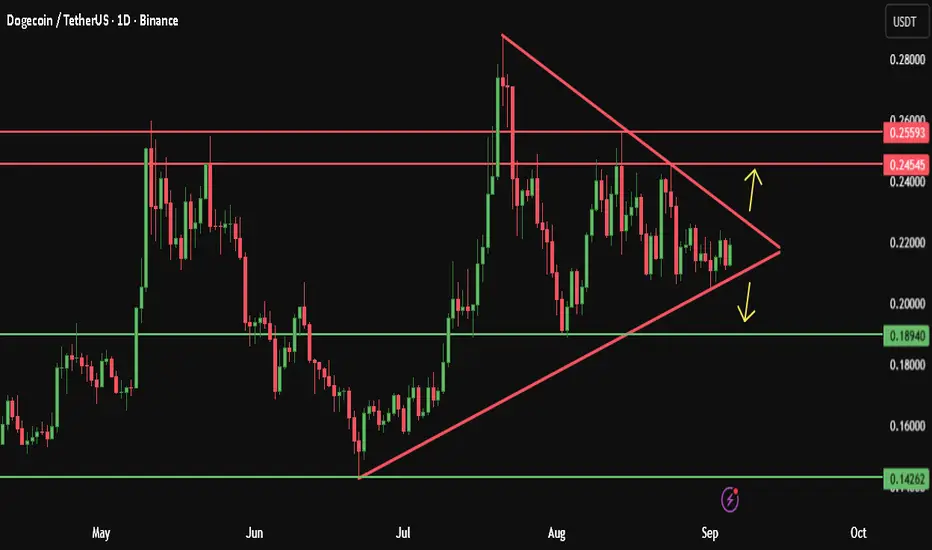
Dogecoin A potential explosive move is comingWe are currently observing the formation of a Symmetrical Triangle, suggesting the market is coiling up for a significant move.
A bullish breakout to the upside would likely target the upper resistance zone 0.2454 and 0.25593.
In the event of a bearish breakdown, we could see a decline towards the lower support at 0.18940 and 0.14262.
Let’s keep a close eye on this pattern for a confirmed direction.
please note :
this is not financial advice — it reflects only my personal opinion.
PLEASE always do your own research before trading .. Good luck with your trades.
ETH Game PlanETH Game Plan
📊 Market Sentiment
Market sentiment remains strongly bullish as the FED is expected to deliver a 0.25% rate cut, with speculation building for a possible 0.5% cut in September. Monetary policy shifts are being driven by both inflation trends and weakening labor market data. The latest August and September job reports were soft, signaling that the economy is cooling rapidly. This environment continues to fuel expectations for a major bullish run in the weeks ahead.
📈 Technical Analysis
Price has shown strong HTF bullish momentum, recently reaching all-time highs.
Currently, ETH appears to be in an accumulation phase, gathering liquidity and energy before the next expansion higher.
📌 Game Plan
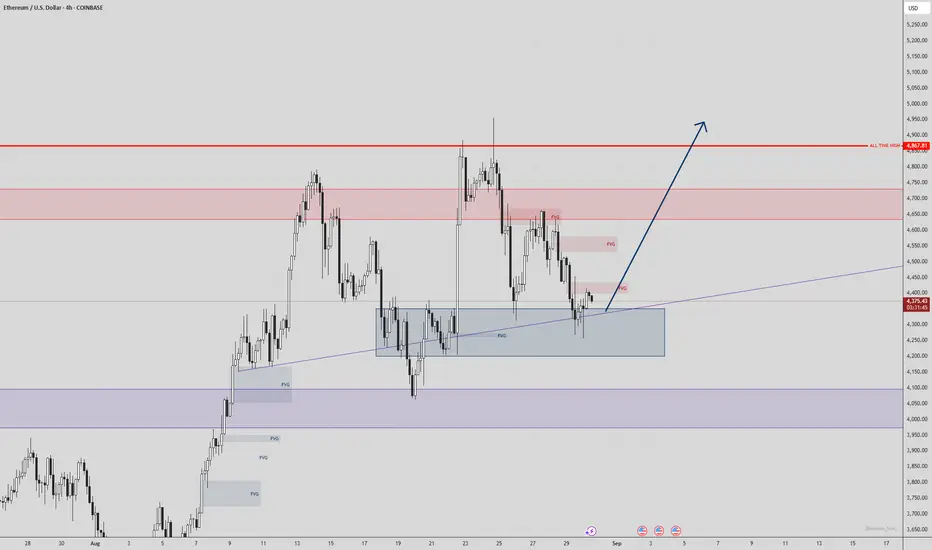
Price should run the $4200 level, which is equal lows and likely contains significant liquidity.
I will then look for a close back above $4200 with a newly formed 4H demand zone.
🎯 Setup Trigger
4H structure break following the liquidity run.
📋 Trade Management
Stoploss: 4H swing low confirming the BOS
Targets:
TP1: $4500
TP2: $4650
TP3: $5000 (All-Time Highs)
💬 Like, follow, and comment if you find this setup valuable!
⚠️ Disclaimer: This content is for informational and educational purposes only and does not constitute financial, investment, or trading advice. Always do your own research before making any financial decisions.

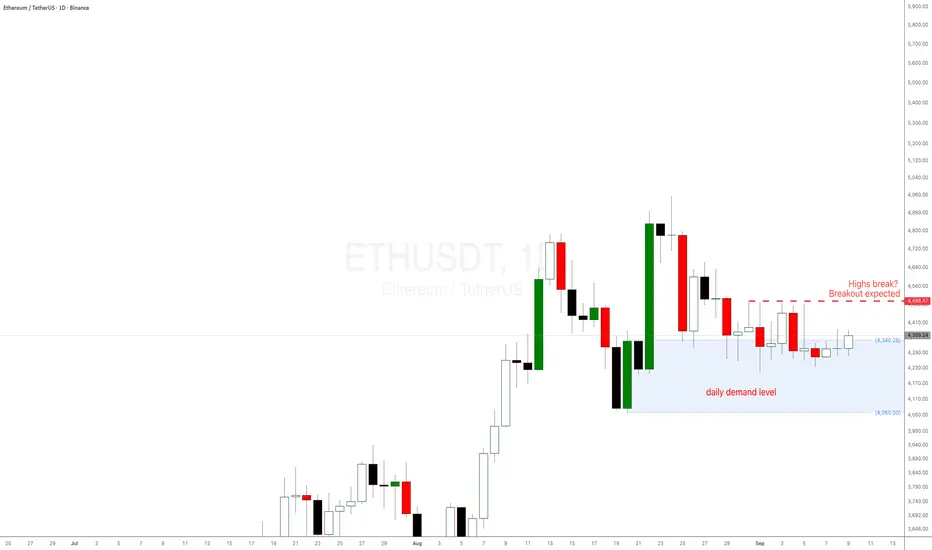
Ethereum ETH 2025 analysis and prediction daily demand levelEthereum ETH 2025 analysis and prediction as a reaction to the daily demand level at $4336. If the daily high in red is broken, a breakout is expected. ETH has been doing nothing for days, price action is not behaving as it usually does at these imbalances.
This is happening with Bitcoin BTC weekly demand level in control and playing out well. Refer to my BTC analysis in another trading idea.
BTC Game Plan – Long OpportunityBTC Game Plan – Long Opportunity
📊 Market Sentiment
Market sentiment remains firmly bullish as the FED is expected to deliver a 0.25% rate cut, with growing speculation of a potential 0.5% cut in September. Monetary policy adjustments are being driven not only by inflation but also by weakening labor market data. The latest August and September job reports came in soft, signaling that the economy is cooling rapidly. This backdrop strengthens expectations for one of the most significant bullish runs in the weeks ahead.
📈 Technical Analysis
BTC has confirmed bullish momentum after breaking the bearish trendline.
Price action currently looks like an accumulation phase, preparing to expand liquidity higher. I see this as a range-bound delivery where price takes both sides of liquidity pools located at the extremes, rather than running directly into new all-time highs.
📌 Game Plan
1)Watch for price to retrace into the 4H demand zone around $109,400.
2)Look for liquidity sweep at the 4H swing lows.
3)Possible deeper retracement into the 0.75 discount zone near $108,700.
🎯 Setup Trigger
I will look for a confirmed 1H break of structure before entering long.
📋 Trade Management
Stoploss: Below the 1H swing low responsible for the BOS
Targets:
• TP1: $103,450
• TP2: $117,400
💬 Like, follow, and comment if you find this setup valuable!
⚠️ Disclaimer: This content is for informational and educational purposes only and does not constitute financial, investment, or trading advice. Always do your own research before making any financial decisions.

Moodeng Meme Coin sell-off happening as expectedMoodeng Meme Coin sell-off is happening as expected. It's taking some weeks and this meme coin is dropping as a reaction to the very strong supply imbalance in the bigger timeframes. This trade idea has been shared in the past and for those swing traders holding this meme coin it's time to manage the short positons.

SOL Swing Long IdeaSOL Swing Long Idea
📊 Market Sentiment
Overall sentiment remains bullish, supported by expectations of a 0.25% rate cut in the upcoming FOMC meeting. A weakening USD and increasing global risk appetite continue to create favorable conditions for further upside in crypto assets.
📈 Technical Analysis
The market aggressively broke the HTF bearish downtrend and closed above it on the daily timeframe. This indicates that price wants to move higher. Moreover, price also broke the HTF resistance level, which is now acting as HTF support.
📌 Game Plan
I already opened a long position since the setup is currently valid.
A possible retest around $196.5 could offer the best entry in my opinion.
📋 Trade Management
Stoploss: Daily close below HTF support at the $171 level
Target: $296 (All-Time High)
💬 Like, follow, and comment if you find this setup valuable!
⚠️ Disclaimer: This content is for informational and educational purposes only and does not constitute financial, investment, or trading advice. Always do your own research before making any financial decisions.

ETHUSD holds support & breaks out📊 ETHUSD – Daily Timeframe Update
ETHUSD had formed a descending broadening pattern, which has already broken out.
Price is now retesting the support zone at 3600–3700.
From its last leg, ETHUSD is moving inside an ascending parallel channel.
Within this channel, it shows range-bound action near the 3650–3700 support zone.
If ETHUSD dips again and sustains above 3650–3700, it may provide a strong long opportunity.
Thank You !!

Ethereum – Bullish Reversal from Demand Zone Towards ATHEthereum has successfully respected the ascending trendline and reacted strongly from the blue demand zone & FVG. Current structure suggests a potential bullish reversal targeting liquidity above 4,680 and eventually the All-Time High (4,887).
BTC Game Plan BTC Game Plan
📊 Market Sentiment
Overall sentiment remains bullish, supported by expectations of a 0.25% rate cut in the upcoming FOMC meeting. A weakening USD and increasing global risk appetite continue to create favorable conditions for further upside in crypto assets.
📈 Technical Analysis
BTC printed a new all-time high but failed to close above it. Since then, price has been retracing inside the range, likely to collect more liquidity before another potential leg higher.
I will be focusing on discount zones and liquidity lows as potential areas for long opportunities.
📌 Game Plan
My key level is $104,750. A close above this level will confirm bullish intent.
This area aligns with 3 major confluences:
Broken trendline retest
0.75 range zone (deep discount level)
Daily swing liquidity
🎯 Setup Trigger
I will wait for a 4H market structure shift as confirmation before entering a trade.
📋 Trade Management
Stoploss: 4H swing low confirming the BOS
Targets:
• TP1: $113,300
• TP2: $117,110
• Runner: Potential push towards new ATH
💬 Like, follow, and comment if you find this setup valuable!
⚠️ Disclaimer: This content is for informational and educational purposes only and does not constitute financial, investment, or trading advice. Always do your own research before making any financial decisions.

Bitcoin – Short-Term Outlook at Key LevelsBitcoin – Short-Term Outlook at Key Levels
Hello traders,
BTC is consolidating around the rising trendline on the daily chart, showing a firm rejection at this level. The broader structure remains in line with the scenario I shared previously, but here’s an updated view to refine short-term opportunities.
The channel is still the main focus. Recent sideways price action has formed a key support–resistance zone, which will decide the next short-term move:
113.3k resistance: A breakout here would confirm fresh long positions.
108.8k support: A breakdown would trigger short opportunities.
Should support fail, the medium-term bias shifts to the bearish path outlined earlier, with potential downside towards the 9x region, supported by the larger timeframe structure.
That’s my current outlook for BTC in the short term. Manage risk carefully, and let’s see how price reacts at these critical levels. Share your view in the comments – do you see BTC breaking higher or lower?

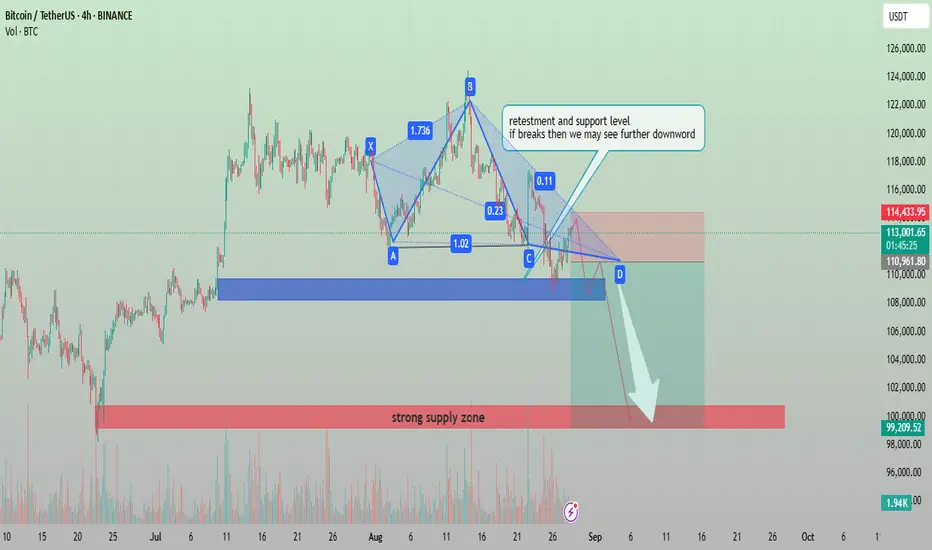
BTCUSDT Bearish Pattern with Key Support RetestAnalysis:
The chart shows Bitcoin (BTCUSDT) forming a harmonic pattern that signals potential bearish continuation. Price is currently retesting a critical support and resistance level around the 113,000–114,000 zone. If this level fails to hold, further downside movement is expected.
Pattern Formation: The harmonic structure (XABCD) suggests a bearish setup.
Support Zone: Around 110,900–111,000, a crucial level to watch.
Downside Target: If support breaks, the price could move toward the 99,000–100,000 strong supply zone.
Volume: A noticeable volume build-up supports potential continuation to the downside.
📉 Outlook: Bearish bias. A breakdown from current retest levels may accelerate selling pressure toward the 100k psychological zone.
BTCUSDT - high placed ? What's next ??#BTCUSDT... so far market placed a very reasonable day high that is 122600-700 around.
So if market holds that then drop expected.
Above current day high it will be invalidate.
Gold luck
Trade wisely

BTC/USD – H1 Trading Plan | Key Levels in FocusBitcoin is still trading within a clear downtrend under the H1 descending trendline. After the recent drop, price is consolidating around short-term equilibrium zones, setting up potential sell continuation setups while leaving room for a possible short-term bounce from demand areas.
📊 Technical Outlook
113,393 → Key resistance (confluence of supply + descending trendline).
111,407 → Short-term support, could provide a reaction.
108,793 → Major demand zone, critical for potential bullish bounce.
📝 Trading Scenarios
Scenario 1 – Sell the pullback (Primary Bias)
Entry: 113,000 – 113,400
Stop Loss: Above 114,000
Targets: 111,400 → 110,000 → 108,800
Scenario 2 – Buy from demand (Countertrend idea)
Entry: 108,800 – 109,000
Stop Loss: Below 108,300
Targets: 110,500 → 111,400 → 113,000
⚠️ Risk Notes
Main trend remains bearish – buy setups are only for short-term retracements.
A clean breakout above 113,400 may shift structure, opening the way towards 115,000+.
H1 may create false signals; wait for confirmation from price action before executing trades.
👉 What do you think? Will BTC continue its drop towards 108,800 📉, or will buyers defend demand and push for a rally back above 113k 🚀?

ZKUSDT - your capital will be doubled on thisIf you want to double your capital in a short period, then ZK is the coin to focus on.
-It’s still at the bottom.
-It formed a symmetrical triangle and already broke out, now doing a retest.
-There’s also an inverse head & shoulders pattern in play.
-Currently sitting right on the 25 EMA support on the daily timeframe.
Buy it spot, and you’ll thank me later.
Best Regards:
Ceciliones🎯

Is Solana about to top?Solana is currently trading just below the target box outlined by the black primary count.
I continue to expect that, over the coming days and weeks, price will eventually reach this zone before any pattern develops that could threaten the red dotted line support areas shown on the below chart.

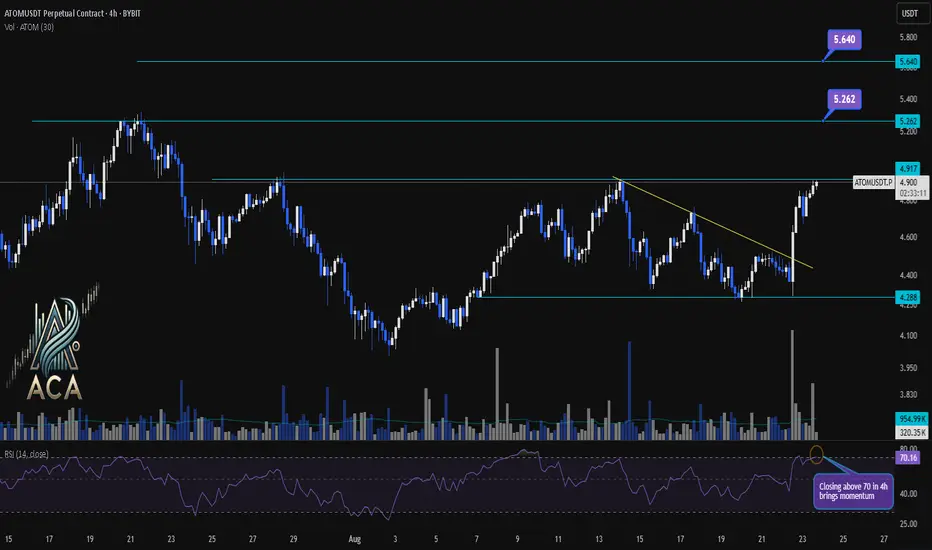
ATOMUSDT 4H Chart Analysis | Momentum Breakout in PlayATOMUSDT 4H Chart Analysis | Momentum Breakout in Play
🔍 Let’s dive into the ATOM/USDT perpetual contract and analyze the latest price action, outlining key bullish setups and momentum signals.
⏳ 4-Hour Overview
The 4-hour chart reveals a strong bullish push, with price surging above the trendline resistance and reclaiming the local $4.917 zone. Volume has notably increased, confirming the move’s strength. Meanwhile, the RSI indicator is closing above 70, marking the overbought territory and highlighting a surge in buyer momentum.
🔺 Long Setup:
On the upside, sustained momentum could ignite a rally toward $5.262 first, with a further target at $5.640 should follow-through buying persist. These levels line up with previous resistance zones and potential trend-based extensions.
📊 Key Highlights:
- 4H breakout confirms bullish bias and momentum shift.
- Volume spike adds conviction to the move.
- RSI closing above 70 signals strong momentum; a continuation could bring further upside.
- Short-term resistance targets are $5.262 and $5.640.
- “Closing above 70 in 4h brings momentum” — if sustained, might hint at a new trend leg.
🚨 Conclusion:
ATOM/USDT is showcasing renewed bullish momentum. Watch for confirmations above resistance and be mindful of short-term exhaustion signals in the overbought zone. If momentum holds, upside targets at $5.262 and $5.640 are in play.
Bitcoin Eyes $100K Re-Entry: Retest, Support Zone,Then Push 130kChart Analysis
1. Price Structure & Trendlines
The chart displays a former upward trendline that has been broken, leading to a corrective pullback.
Following that, price is perched within a “retest zone” (the red-shaded rectangle), which aligns with both historical horizontal resistance—now turning into support—and an area of previous consolidation. This is a classic setup: price often retests key breakout levels before resuming its move.
2. Support Levels
The main support is clearly drawn around the $100K zone, highlighted by a grey bar below the retest zone. This is a psychological and structural area to watch for potential strong buying.
Immediate support appears near $110K–$112K, as noted by the lower edge of the red retest area—this zone has shown to catch corrections before in technical analysis and news reports
AInvest
Mudrex
Barron's
.
3. Resistance & Upside Targets
If the retest holds, the chart charts a potential bounce toward the upper rising trendline and beyond, potentially aiming for the $126K–$130K region, as marked by Fibonacci retracement levels.
This aligns with several external forecasts suggesting resistance or target zones in that range
AInvest
Mudrex
Barron's
.
4. Potential Price Path & Scenarios (Denoted by Red Arrows)
Bearish Scenario: Price may dip down into the retest zone, test support, and—if the breakdown occurs—continue lower toward $100K—a key area of interest.
Bullish Scenario: The support holds, leading to a V-shaped recovery that propels price back above $115K, potentially triggering a rally toward $122K–$130K.
Summary Table
Key Zone / Level Significance & Note
$110K–$112K Critical near-term support; breakdown risks move toward $100K
AInvest
Mudrex
Retest Zone (~$114K–$115K) Area combining horizontal support and trendline; serves as pivot for next move
Mudrex
AInvest
$120K–$123K Major resistance where a breakout could fuel continuation toward $127K–$130K
Mudrex
Barron's
Broader Context & Market Sentiment
Bitcoin is currently consolidating after setting new highs near $124K
MarketWatch
The Economic Times
Barron's
Cointribune
.
Analysts observe that sustaining above the $110K–$112K band is essential to the bullish case; falling below it could invite deeper downside
Barron's
Cointribune
AInvest
.
Conversely, a decisive move above $120K–$123K could validate continuation toward $127K–$130K, and even higher—some forecasts extend to $135K and beyond
Mudrex
Indiatimes
Barron's
CoinCodex
.
Final Thoughts
Your chart beautifully illustrates the classic “retest after breakout” dynamic:
Hold above the retest zone? Look for a rebound toward $120K+, with the potential for a full bullish revival aiming for $130K.
Break below $110K–$112K? Watch for a possible move toward $100K—a critical support level.
Stay alert to macro catalysts too—like Federal Reserve interest rate signals, institutional inflows (ETFs), and regulatory developments—which could steer the next leg substantially

XRPUSDT: Trade 15 minHello, I opened a trade on Ripple, the points where the price is likely to reverse are marked, so in the lower timeframe there is a short-term trend towards gain. Be profitable.

XRP Game PlanXRP Game Plan
📊 Market Sentiment
Market sentiment has slightly shifted as expectations for a 0.25 bps cut in September are no longer strongly priced in. Current probabilities still show around a 60% chance of easing, but overall, the market remains uncertain. This uncertainty has led to risk-off moves and sell-offs across multiple assets, starting with NQ and extending into crypto.
📈 Technical Analysis
Price is retracing towards a higher timeframe (HTF) key support level.
The main liquidity zone sits around $2.73, where I would expect a significant bounce.
📌 Game Plan
I expect price to run into the $2.73 liquidity zone and close back above it. From there, I will look for price to reclaim the HTF key level as confirmation of bullish continuation.
🎯 Setup Trigger
I will monitor the 4H market structure for confirmation before initiating a position.
📋 Trade Management
Stoploss: 4H swing low confirming the BOS
Targets:
TP1: $3.14
TP2: $3.38
💬 Like, follow, and comment if you find this setup valuable!
⚠️ Disclaimer: This content is for informational and educational purposes only and does not constitute financial, investment, or trading advice. Always do your own research before making any financial decisions.

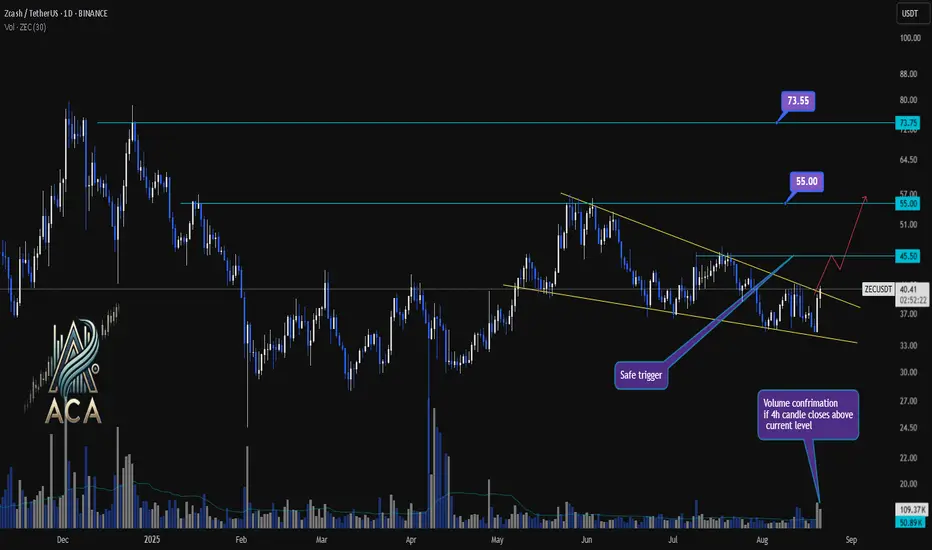
ZECUSDT Daily Chart Analysis | Symmetrical Triangle BO WatchZECUSDT Daily Chart Analysis | Symmetrical Triangle Breakout Watch
🔍 Let’s dissect the ZEC/USDT daily chart, where price action is nearing a pivotal breakout from a symmetrical triangle—often a precursor to major moves when combined with rising volume.
⏳ Daily Chart Overview
Zcash has been consolidating over recent weeks, forming a clear symmetrical triangle pattern bounded by converging trendlines. This pattern, characterized by lower highs and higher lows, signals that volatility is being compressed and a decisive breakout may be imminent.
🔺 Long Setup:
A daily close above the $45.50 resistance, especially with strong volume, will act as a “safe trigger” and confirm breakout validity. If bulls take charge here, the next upside objectives are $55.00 followed by $73.55. Watch for volume confirmation, ideally on a 4H candle close above resistance, to further add confidence to the breakout.
📊 Key Highlights:
- Symmetrical triangle pattern shows growing pressure for a directional move.
- Recent price tested triangle resistance; a close above $45.50 is the bullish trigger.
- Upside targets post-breakout are $55.00 and $73.55, provided volume supports the move.
- Volume spike serves as crucial confirmation—don’t chase without it.
🚨 Conclusion:
ZEC is coiling within a symmetrical triangle, setting the stage for potential breakout action. Bulls are watching $45.50 for a clean breakout trigger, eyeing $55 and $73.55 as next targets. Always wait for strong volume and confirmed closes before acting—symmetrical triangles can break both ways if conviction is lacking.
BTC Game PlanBTC Game Plan
📊 Market Sentiment
Overall sentiment remains bullish, supported by expectations of a 0.25% rate cut in the upcoming FOMC meeting. A weakening USD and increasing global risk appetite are creating favorable conditions for further upside in crypto assets.
📈 Technical Analysis
Price is currently retracing lower after printing new all-time highs.
It is moving toward the 112,000$ level, which contains significant liquidity. Therefore, I expect a strong bounce from that zone.
Additionally, price is approaching the equilibrium level (0.5 Fibonacci), which represents a discount for me.
📌 Game Plan
I expect price to retrace to the 111,316$ level and bounce from there.
🎯 Setup Trigger
I will be watching the 4H market structure for confirmation before initiating a position.
📋 Trade Management
Stoploss: 4H swing low confirming the BOS
Targets:
TP1: 118,446$
TP2: 124,351$
💬 Like, follow, and comment if you find this setup valuable!
⚠️ Disclaimer: This content is for informational and educational purposes only and does not constitute financial, investment, or trading advice. Always do your own research before making any financial decisions.

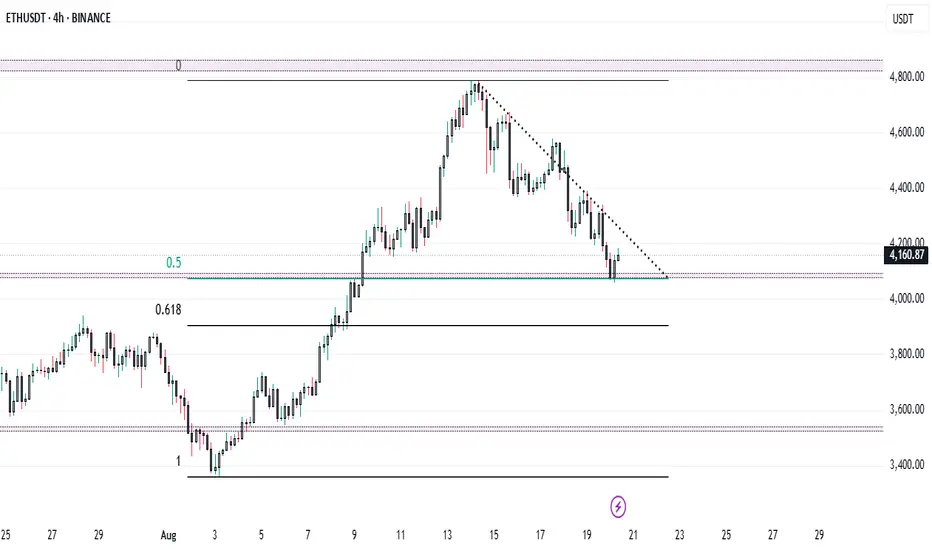
ETH at $4,100 – Can Bulls Defend Key Support Before FOMC..?ETH + FOMC = Volatility Ahead ? 🔥
Ethereum at Make-or-Break Zone: $4,100 Support in Focus!
Ethereum (ETH/USDT) on the 4H timeframe is showing a decisive battle between bulls and bears. After topping near $4,700, ETH has been in a steady downtrend, respecting the descending trendline.
🔑 Key Levels to Watch
* Immediate Support: $4,100 – $4,150 (0.5 Fib retracement)
* Major Support: $3,950 – $4,000 (0.618 Fib retracement)
* Resistance Zone: $4,300 – $4,350 (descending trendline)
* Major Resistance: $4,600 – $4,700 (recent swing high)
📈 Bullish Scenario
✅ A breakout above $4,300 trendline resistance could trigger strong momentum toward $4,500 - $4,600.
✅ Holding $4,100 support will keep buyers in control.
📉 Bearish Scenario
❌ If ETH fails to hold $4,100, expect a deeper retracement toward $4,000 (0.618 Fib).
❌ A break below $3,950 may extend the fall to $3,700 – $3,600.
⚠️ Market Note
📌 Today’s FOMC meeting could heavily impact the crypto market trend.
Expect volatility as Fed commentary on interest rates may guide ETH’s next major move.
⚖️ Conclusion
ETH is at a critical support zone where the next move will define short-term direction.
* Above $4,300 → Bulls regain control.
* Below $4,100 → Bears target $4,000 and lower.