DAM/USDT: Analyzing the Accumulation Floor & Asymmetric UpsideThe Macro Context After a prolonged correction phase (-69% YTD), DAM (Datamine) appears to be establishing a definitive "Market Bottom" structure on the Daily timeframe. The aggressive selling pressure has subsided, leading to a period of stabilization and quiet accumulation.
Why this setup is on our radar:
Seller Exhaustion: The chart shows a classic "rounding bottom" formation. The lack of lower lows suggests that the capitulation phase is over.
Asymmetric Risk-to-Reward: Entering near historical lows offers a unique advantage. The distance to the invalidation level (zero or recent low) is minimal compared to the upside potential of returning to previous valuations.
Market Cycle : With altcoins showing signs of life (+21% in the last month), rotation into undervalued, bottomed-out assets often follows.
Technical Levels & Plan:
Buy Zone: We are looking to accumulate positions in the 0.027 - 0.028 region.
Invalidation Level: A weekly close below the swing low (~0.015) would compromise the structure. ( Note: Due to volatility, manage position size carefully).
Structural Resistance (Targets):
Short Term: 0.030 - 0.034 (Local Supply)
Mid Term: 0.052 - 0.067 (Break of structure)
Macro / Moonbag: If price discovery kicks in, we look towards 0.17 and higher (0.50+) as widely spaced psychological targets.
Risological Note: This is a "Position Trade," not a scalp. The thesis relies on the market pricing this asset as "oversold." Patience is the strategy here.
Disclaimer: This analysis is for educational purposes only. Crypto assets are highly volatile. This is not financial advice.
Cryptolong

Crypto: Risk on! Memes gonna lead, PEPE on the way!Crypto appears to have formed a local bottom, with reversal structures developing across the majority of major assets.
Bitcoin is currently constrained in terms of upside expansion, which increases the probability of capital rotation into altcoins. In this environment, select altcoins are likely to significantly outperform BTC on a relative basis.
Liquidity is stacked higher, and if momentum accelerates, the market may expand aggressively without offering deep pullbacks. From a positioning standpoint, this creates a clear choice: enter at current levels with defined risk, or remain patient and wait for a shallow retracement that may never materialize.
Meme coins are likely to lead the initial phase of the move. While they carry the highest risk profile in the market, they also offer the strongest short-term returns. These should be approached strictly as momentum trades — enter during expansion and exit into strength, as seen in previous cycles (PONKE being a recent example).
Follow for more trading ideas

BMNR HIGH PROBABILITY LONG SETUP SOON!!!!🚨 BMNR HIGH PROBABILITY BUY SETUP 🚨
* Here We Can See Clearly The Next Potential Moves For BMNR Coming Hours/Days.
* Keep Your Eyes Close On Your Trading Positions.
* Happy PIP Hunting Traders.
FXKILLA.

Bitcoin - $250K Target by 2030 is Feasible - Why I'm Still LongSince I established this account on Tradingview in 2017, I have consistently shared positive sentiment regarding Bitcoin. Also, I have been monitoring crypto and blockchain technology since 2011. My optimism about Bitcoin's potential has been longstanding, particularly with the arrival of RSK, Bitcoin subnets, Ivy, the Lightning Network, and Bitcoin Oracles. Furthermore, Bitcoin has gained significant acceptance among institutional investors, as evidenced by the increasing prevalence of Bitcoin ETFs, Index Funds, and BTC being included in more retirement portfolios or mutual funds. Although I have maintained a bullish stance and invested in crypto for an extended period, the technology still faces considerable challenges in terms of scalability and achieving mass adoption. Additionally, I have previously suggested a new Proof of Work (PoW) mechanism for BTC mining; however, HashCash appears to be the preferred choice among Bitcoin Maximalists and the BTC Dev Team. A price of $250K by 2030 is a realistic possibility. As always, none of this is investment or financial advice. Please do your own due diligence and research.

ZEC approaching daily 50SMAZcash aka ZEC is now hitting the daily 50SMA (overlayed on this 4H chart).
Either a strong bounce here or serious crash coming.

BITCOIN BIG HIGH BUY PROBABILITY SETUP SOON!!!🚨 BITCOIN HIGH PROBABILITY BUY SETUP 🚨
* Here We Can See Clearly The Next Potential Moves For BTCUSD Coming Hours/Days.
* Keep Your Eyes Close On Your Trading Positions.
* Happy PIP Hunting Traders.
FXKILLA.

BMNR BIG BULL RUN PROBABILITY SOON!!!🚨 BMNR HIGH PROBABILITY BUY SETUP 🚨
* Here We Can See Clearly The Next Potential Moves For BMNR Coming Hours/Days.
* Keep Your Eyes Close On Your Trading Positions.
* Happy PIP Hunting Traders.
FXKILLA.

Crypto Total Market Cap AnalysisHi Team!
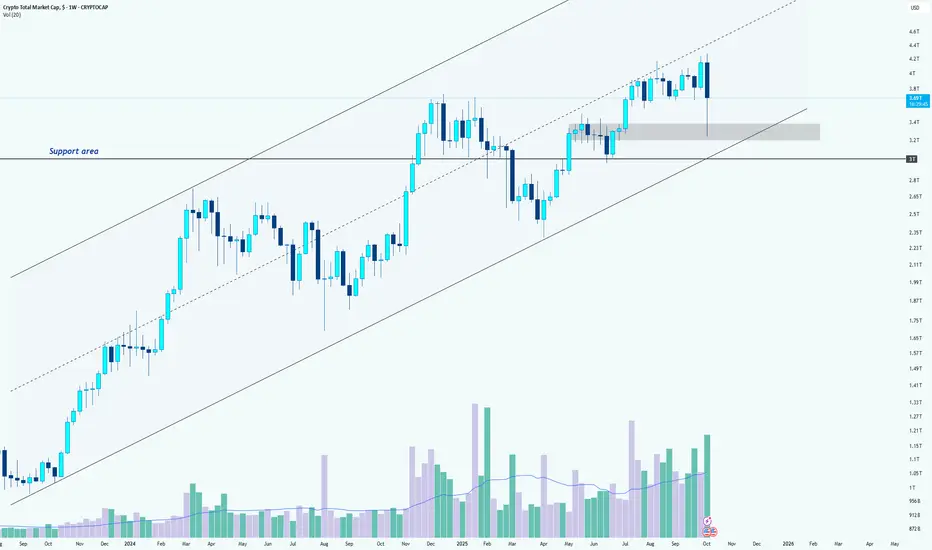
The crypto market continues to show impressive strength, maintaining its position inside the long-term ascending channel. Despite the recent correction, the overall structure remains bullish as long as the lower boundary of this channel holds.
After facing resistance near the upper line of the channel, the total market cap experienced a healthy pullback, which brought it close to the mid-zone of the structure. Buyers stepped in strongly from that area, suggesting that market participants still see dips as opportunities rather than warning signs.
The key support zone lies between 3.1T and 2.84T USD, a region that has acted as both a breakout base and a demand area in the past. As long as this zone remains intact, the broader bullish momentum is likely to continue, keeping the medium- to long-term outlook positive.
If price action stays within the rising channel and the 2.84T support area holds, the total crypto market cap could soon retest the upper trendline, potentially pushing toward new highs.
However, a confirmed breakdown below 2.84T would signal a shift in structure, opening the door to a deeper correction phase.
BNB HIGH PROBABILITY SETUP SOON!!!🚨 BNB HIGH PROBABILITY BUY SETUP 🚨
* Here We Can See Clearly The Next Potential Move For BNB Coming Hours/Days.
* Keep Your Eyes Close On Your Trading Positions.
* Happy PIP Hunting Traders.
FXKILLA.

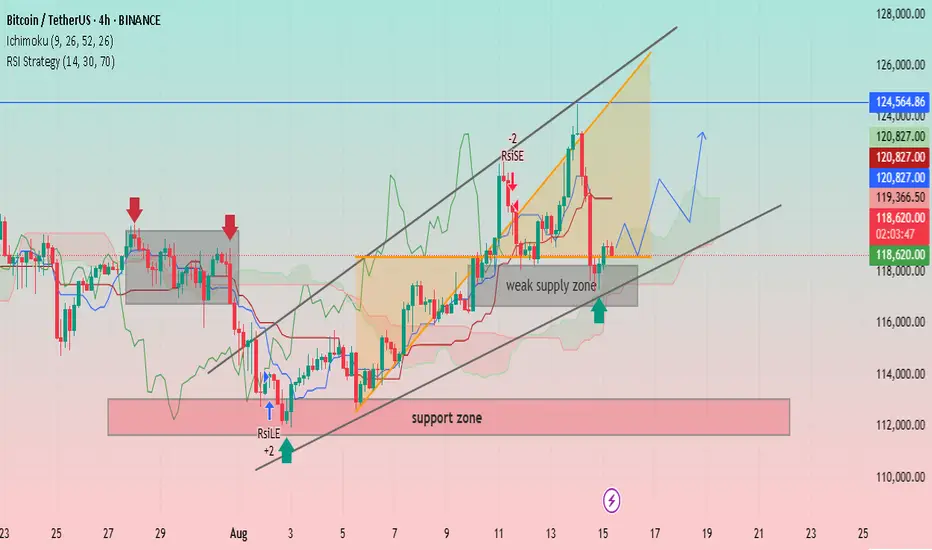
BTC/USDT: Bullish Momentum and Key Support LevelsUptrend Channel: The price is trading within an ascending channel, denoted by two parallel black trendlines. This suggests a bullish trend is in play.
Support and Resistance:
A significant support zone is identified between approximately 112,000 and 114,000 USDT.
A weak supply zone is marked around 118,000 USDT. The price has recently tested this area and found some support.
A strong resistance level is visible at approximately 124,564.86 USDT.
Indicators:
Ichimoku Cloud (9, 26, 52, 26): The price is currently trading above the cloud, indicating a bullish sentiment. The cloud itself appears to be thin and slightly bullish, suggesting potential for continued upward movement.
RSI Strategy (14, 30, 70): The Relative Strength Index (RSI) is used as a strategy, with a "RSILE" signal (likely "RSI Low Entry") marked with a "+2" and a red arrow, suggesting a potential buy signal near the support zone in early August. A "-2" signal is marked near the top of the channel, indicating a potential overbought condition or reversal signal.
Price Action and Projections:
The price recently experienced a sharp decline from the upper trendline, indicating profit-taking or resistance at that level.
The price is currently near the lower trendline and the "weak supply zone," which appears to be acting as support.
A potential future price path is drawn with a blue arrow, suggesting that the price may consolidate or bounce off the current support area and move higher towards the upper boundary of the channel.
Another potential path is drawn with a red arrow, showing a possible further drop towards the lower trendline before a bounce.
HAPPYUSDTBased on the overall output of these analyses, spot buying of this cryptocurrency around 0.001 to 0.00088 is reasonable and less risky. As long as these levels are valid, we can expect the price to grow in the form of wave C.
The ideal target of wave C could be around 0.0047.. which has a very attractive range of movement.
Mid-September could be a reasonable time to complete wave B and start the hypothetical wave C.. Also, important times are clear on the chart.
This is just a scenario. Only if the price reaches these areas by re-examining the market can we look for buying.
It should also be noted that this cryptocurrency is an anonymous meme coin with a very small market cap and carries a lot of risk.

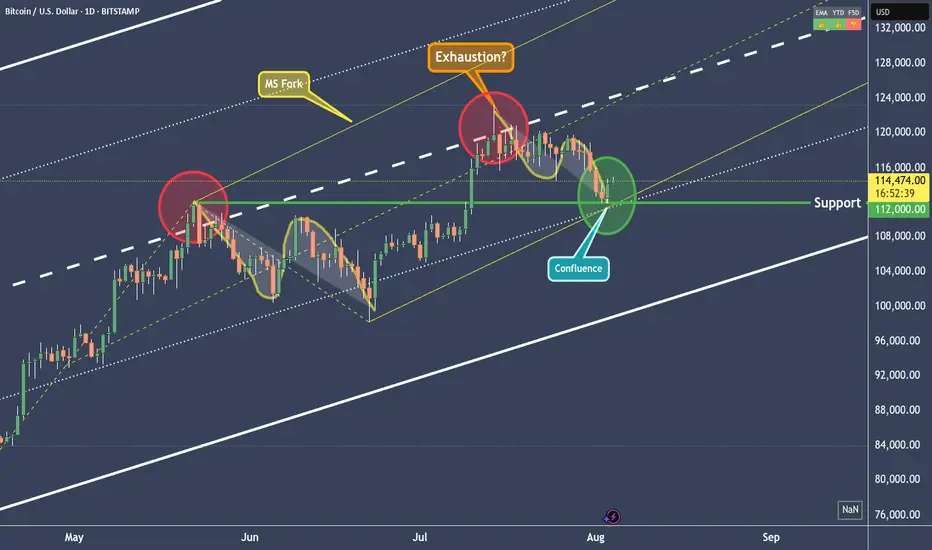
BTCUSD - Right to the point!In the last post (see the Linked Chart), I showed why BTCUSD would fall, and I also pointed out where the first price level for a possible pause might be.
On Friday, that level was reached, and the market seems to be turning *on the dot*. Will we now see higher prices again, or even a new all-time high? Let’s take a closer look:
The “confluence” point is marked by the white fork and the yellow modified Schiff fork. This point lies exactly on the 1/4 line. And this line often indicates temporary levels where at least a pause in the movement can be expected.
When we look at what Bitcoin did at this price level in mid-June, it seems likely that it will rise again. The overall pattern, from the centerline to the 1/4 line, looks extremely similar (see the A-B-C Wave Pattern)!
And yet, I’m not entirely convinced by the picture. Because this was the second time we reached the centerline.
For the brave, this wouldn’t be a bad entry point—or an opportunity to increase the position after this pullback. A possible stop for traders could be placed just below the current low, with targets at the centerline of course.
But why not just lean back, enjoy the profits, and switch into observation mode for now…
I will also make a video that explains the details and connections more clearly.
Happy Monday and stay patient to fight the FOMO! §8-)
BITCOIN Bullish setupBTCUSD bullish setup
Entry - 113090
Stop Loss - 112717
Target - 114260
Risk Reward - 1:3.14

BTCUSDT: Elliot Wave AnalysisAs you can see in the chart, the fourth wave has ended and there is a possibility of an increase in the next stage to the level between 128,000 and 131,000, followed by a correction for a larger fourth wave and finally the last leg of the increase to the fifth wave, which has the possibility of reaching 139,000 to 140,000.

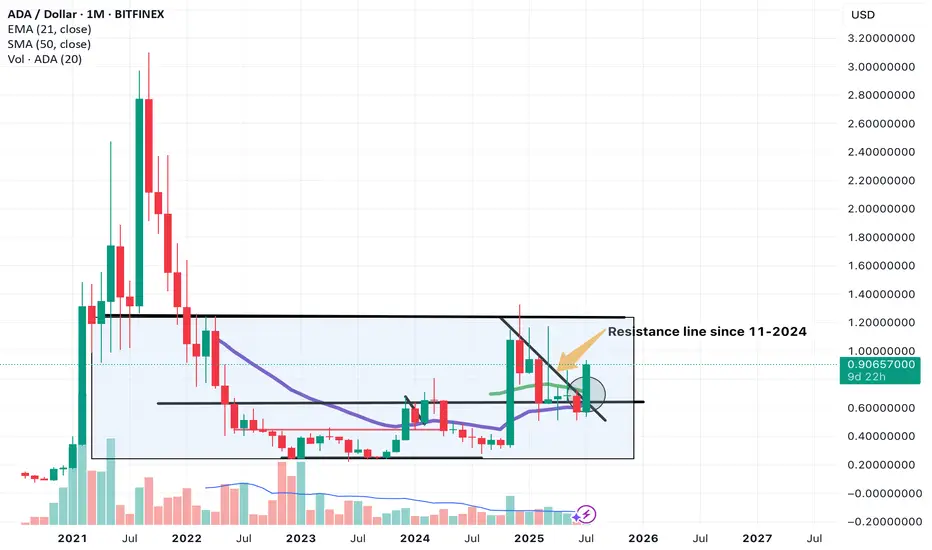
Cardano (ADA) a solid play in crypto, a Macro lookHi guys, so with Bitcoin in price discovery mode. It hints at the final phase of Crypto bull in action. With that comes altseason and in my opinion explosive growth in altcoins.
1 particular coin i've been looking at is Cardano (ADA).
This is a macro technical analysis of ADA on the 1 month timeframe. So each candle is 1 month of price action. This is very powerful on its own. And can give signs into where an asset will trend.
If you compare this to majority of other alts, its looking alot more bullish and is ahead of the game.
SO jumping right in.
Lets look at price action. Notice we are in a macro rectangle or sideways pattern.
Upper limit at $1.24
Lower limit at around $0.25.
This indicates a consolidation phase.
Real action is seen above that upper limit. Where we see explosive price action to the upside. Previously in Sept 2021 seeing highs of up to $3.07.
I believe we are making our way up to this $1.24 level.
Which in the short term will be a solid area to take profit due to it being a major supply zone in my opinion or sell zone. With a potential pull back. This is because if you look previously in price history, cardano price movement heavily involves this level with most of price history being either above or below $1.24.
A key sign but not yet confirmation is a breakout above this slanted resistance line we were being pushed down from that was created in 11-2024.
We have an engulfing candle break out currently. But still awaiting confirmation which will require august monthly candle to stay above this line and present a bullish candle print.
We will be on the look out for this.
There are other signs and signals appearing in Cardano (ADA) that support my theory and Price action developments. To take trades i always look for multiple signs that overlap.
Stay tune for more of that where ill go over many different indicators and other aspects that point to ADA being above other alts as a solid trade or investment for the next altseason.
DYDX Breakout from Falling Wedge | Targeting $1.60+# DYDX Breakout from Falling Wedge | Targeting $1.60+
📈 **DYDX/USDT Analysis – Daily Timeframe**
DYDX has just broken out of a falling wedge pattern – a classic bullish reversal formation – after holding a strong support zone around **$0.50**. This zone has acted as a reliable demand area for several months.
---
🔍 **Technical Highlights:**
- ✅ Falling wedge breakout confirmed with daily candle close above resistance
- 🟢 Strong support at $0.50–$0.52
- ⚠️ Horizontal resistance at $0.75 may act as a short-term barrier
- 🚀 Potential rally toward major resistance at **$1.60–$1.70** (target zone)
---
🎯 **Profit Targets:**
- First Target: **$0.75**
- Final Target: **$1.60 – $1.70**
❌ **Invalidation (Stop-loss idea):**
- If price breaks below $0.48 with volume, the bullish scenario may be invalidated.
---
📊 This setup is based on breakout structure and potential trend reversal. If volume confirms, this could be the beginning of a new mid-term uptrend.
💬 Let me know what you think about this setup! Would love to hear your feedback.

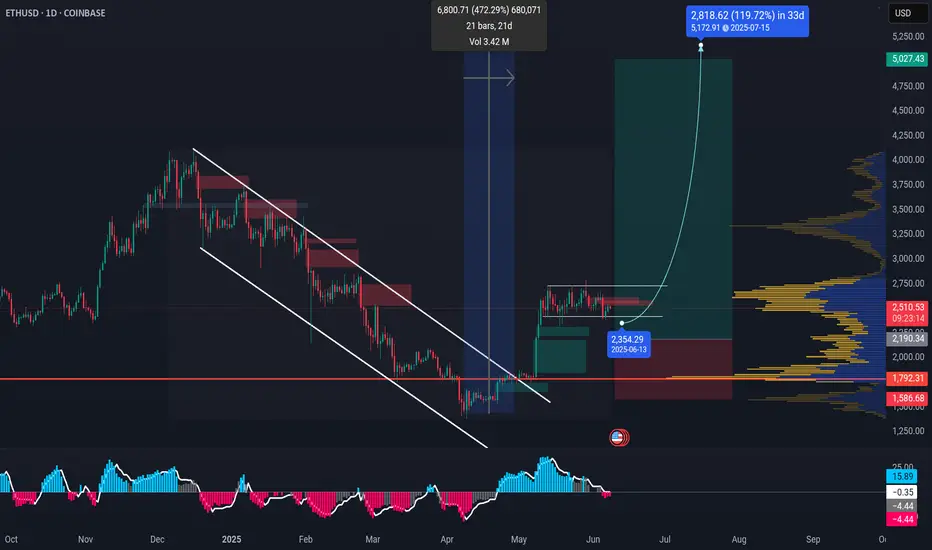
ETHEREUM is stacking up to fly! BINANCE:ETHUSDT ETHEREUM got a lot going for it right now. It's the backbone of a huge chunk of the crypto world, especially with all the DeFi and NFT stuff happening. Plus, there's always talk about big upgrades that could make it even better.
Right now, Ethereum's trading around $2,500, but some experts expect that it could climb way higher, maybe even past $8,000, if everything goes right.
That aside, I personally think $5,000 is achievable and to happen soon. It clearly broke out of the months long downtrend channel and with momentum. There's a lot of hate for ETH just for being expensive. But, let's be real, is not the 2nd biggest player in the market for nothing.
Let me know what you think? Open to counter ideas!
BINANCE:ETHUSDT
Bitcoin's weekly closeBitcoin's weekly close tonight is crucial. It's good if it closes above its all-time weekly high to continue the uptrend and form a new peak.

Bitcoin Daily Bullish CUP pattern but with resistance coming in
Please excuse the number of lines here but this is my working chart and I am short of time but I wanted to share this.
Bitcoin Daily has printed a Bullish CUP and is back on the Rim but we have still to reach the edge of the Cup, which is expected around 15th May, 10 days. When PA entered thhis Cuo, it also ranged sideways for a while.....
Something that PA has to face in the near future is that red 236 fib circle. And PA may be already reacting to that.
Look to the left and see what happened last time we hit a red 236 fib circle.
I think we are in a stronger position this time though but a Drop to the Long term rising trend line is a very real possibility
That is around 92K - > 87K -Not a Major drop and it would actually play into the Bulls hands by resetting the Daily MACD that is already beginning to turn slightly Bearish
This is NOT a reason to PANIC or Sell but is more an opportunity, maybe the last one, to Buy BTC at around this price.
I think a drop back down to the 2.272 Fib extension at 77K is highly unlikely but we should have a plan should this happen.
We do have the DXY support group, sorry, THE FED announcing the Next decision of Rates on 7th and it is very likely that PA will Drop till then, slowly hopefully, resetting the MACD as previously mentioned, and then push through that 236 Fib circle after the continued Freeze on Rates is announced.
We have to wait and see......

The Spring of OM: Wyckoff Signals a Rebirth After the CrashMANTRA ( BYBIT:OMUSDT.P ) Technical Analysis: Post-Crash Recovery and Wyckoff Accumulation Insights
TradingView
On April 13, 2025, MANTRA (OM) experienced a significant price drop, declining approximately 88% within 24 hours. This sharp downturn was attributed to a combination of factors, including market-wide volatility and potential large-scale sell-offs. Despite this abrupt decline, technical indicators suggest that OM may be entering a Wyckoff Accumulation Phase, presenting potential investment opportunities.
Understanding the Recent Price Movement
Following the crash, OM's price stabilized around $0.70, with a 24-hour trading volume exceeding $2.3 billion. The Relative Strength Index (RSI) and Commodity Channel Index (CCI) indicators both entered oversold territories, indicating a potential for price reversal.
CoinMarketCap
CentralCharts
Wyckoff Accumulation Phase Analysis
The Wyckoff Method identifies specific phases in market cycles, with the Accumulation Phase characterized by large investors ("smart money") buying assets at lower prices. Key features of this phase include:
Selling Climax (SC): A sharp price decline with high volume, as seen in OM's recent drop.
TradingView
Automatic Rally (AR): A quick rebound following the SC, indicating initial buying interest.
Secondary Test (ST): Price revisits the SC level to test support, often with lower volume.
Spring: A false breakout below support levels to shake out weak holders, potentially observed in OM's price action.
Mudrex
Sign of Strength (SOS): A strong price increase with higher volume, signaling the end of accumulation.
Currently, OM's price behavior aligns with the early stages of this accumulation pattern.
Investment Considerations
For investors considering entry points:
Risk Tolerance: Given the recent volatility, only risk capital should be used.
Technical Confirmation: Await confirmation of the SOS phase before significant investment.
Volume Analysis: Monitor trading volumes for signs of increased institutional interest.
Understanding the Wyckoff Accumulation Phase can provide insights into potential market reversals.

Litecoin LTF Signals Potential Bullish Catapult in PlayWith SEC decision day for the Litecoin ETF delayed until May 5, 2025 , seems those idle hands are idle no more with Litecoin.
From a fundamentals perspective, the hash rate for Litecoin is in overdrive since November, racing to the 2.37 PH/s handle, and continues to dominate as the most used cryptocurrency for transactions on Bitpay (34.7%), surpassing Bitcoin, Ethereum, and USD stables.
From a very basic fundamentals perspective, it seems Litecoin should be primed for a move higher in the near term.
Potential Bullish Catapult & Target Price
In Point & Figure Charting “a typical Bullish Catapult forms with a Triple Top Breakout, a pullback, and then a Double Top Breakout.”
The formation is showing a clear triple top followed by a Sign of Strength (SOS) on the breakout to the $97 handle. It appears to be a textbook Bullish Catapult formation. The Horizontal Price Count suggests that if this formation plays out, the target price for this move would be the $120 handle.
Always remember this is not trading advice.
Outside of that, Happy Trading.

#BERAUSDT shows bullish momentum 📈 Long BYBIT:BERAUSDT.P from $8.080
🛡 Stop loss $7.905
🕒 1H Timeframe
⚡️ Overview:
➡️ The main POC (Point of Control) is at 6.699, indicating the area of highest volume accumulation.
➡️ The 7.905 level acts as the nearest support zone and is a key stop-loss reference point.
➡️ The chart BYBIT:BERAUSDT.P shows a strong bullish breakout with consolidation above previous range, signaling a possible trend continuation.
➡️ Rising volume confirms strength behind the move.
🎯 TP Targets:
💎 TP 1: $8.204
💎 TP 2: $8.320
💎 TP 3: $8.430
📢 Watch key levels closely — better to enter after signal confirmation!
📢 If the price holds above $8.080, the TP targets are likely to be hit.
📢 If stop level is breached, the setup may need reevaluation.
BYBIT:BERAUSDT.P shows bullish momentum — looking for further upside!

#FARTCOINUSDT is showing bullish momentum📈LONG BYBIT:FARTCOINUSDT.P from $0.3590
🛡 Stop Loss: $0.3465
🕒 Timeframe: 1H
⚡️ Overview:
➡️ BYBIT:FARTCOINUSDT.P is showing bullish momentum on the 1-hour timeframe.
➡️ The price has recently broken through the resistance zone at $0.3590, which could serve as an entry point for a long position.
➡️ The chart shows an accumulation zone in the $0.3374–$0.3590 range, where volumes (visible on the volume profile to the left) indicate strong buyer interest.
➡️ The POC (Point of Control) is at $0.3462, confirming support below the current price.
➡️ The price is maintaining an uptrend structure: higher lows and highs are forming, and the breakout at $0.3590 is accompanied by increasing volumes, signaling bullish activity.
➡️ The #RSI (14) indicator on the 1H timeframe is at 65, indicating bullish momentum without being overbought, leaving room for further growth.
🚀 Plan:
➡️ Entry: Buy above $0.3590 after the 1-hour candle closes above this level to confirm the breakout.
➡️ Stop Loss: Set at $0.3465 (below the support zone and POC), which provides a 3.5% risk from the entry point and protects against false breakouts.
➡️ Risk/Reward Ratio: From 1:2 (for TP1) to 1:5.5 (for TP3), making this trade attractive from a risk management perspective.
🎯 Take Profit Targets:
💎 TP1: $0.3660
(nearest resistance level, +1.9% from entry)
💎 TP2: $0.3730
(zone of previous highs, +3.9%)
💎 TP3: $0.3790
(key growth target, +5.6%)
📢 A price consolidation above $0.3590 with sustained volume increases the likelihood of reaching the targets. The $0.3660 and $0.3730 levels may act as profit-taking zones, so monitor price action in these areas.
📢 Risks: If the price drops below $0.3465, it could signal a false breakout and a return to the consolidation zone of $0.3374–$0.3465. In this case, consider reassessing the position.
📢 Market Context: The rise of BYBIT:FARTCOINUSDT.P may be supported by the overall positive sentiment in the crypto market. As of March 19, 2025, BYBIT:BTCUSDT.P is trading steadily above $90,000, creating a favorable backdrop for altcoins.
BYBIT:FARTCOINUSDT.P is showing strength and potential for growth on the 1H timeframe. A confirmed breakout above $0.3590 is your signal to act! We expect a move toward the $0.3660–$0.3790 levels.
