BTC Bearish cycleAs I see it BTC we are going into a long term retracement below the 50% of the previous bullish range.
The price target is at OTE level (Optimal Target Entry)around 45.000$ .
BTC revolve in cycles ,bearish and bullish and it often ,almost always repeat the same price delivery at the same time.
The bearish cycle :
-365 day
The bullish cycle :
-around 1060 days
But how do I calculate?
Placing a Fib projection from the lower low to the higher high of the BEARISH range, once the leg(range) is broken(the higher have been taken , we can approximate our target as you can see in the image are pretty precise.
To find the bearish target ,always below 50% of the Bullish (explanation on image).
I do so expect to go into a big buy by this year October .
This is a fully technical and only analysis ,but long term calculations do not lie.
Let me know in the comments what you think about it.
Cryptomarket

Weekend Ranges & Algo GrindsWatching the LTF structure here, but I’m keeping my hands off the execution button for now. Historically, the weekend tends to be dominated by algo ranging low volume, high noise. I’m not expecting any major moves until at least the Monday open.
My Weekend Rule: I generally don't like trading the weekend, but I have my alerts set at the key Order Blocks.
If an alert triggers, I won't blind-enter. I'll jump on the charts to monitor if the structure is actually shifting or if it’s just a liquidity grab.
The Plan: If the setup holds into Monday, that’s where the high-probability entry lives.
Sticking to the discipline I’ve picked up over the last 10 years. Let the algos chop the impatient traders; I’ll wait... (Impatiently)

BTC ETH SOL Crypto The pattern within the pattern.
This smaller channel within the zoomed-out channel is starting to form more.
Overall near term we have a rather clear picture on price action and things have remained somewhat predictable for several tradeable plays here.
Sol if anything looks the most suspect here but it's been the most resilient so far this cycle.
I'll continue to use the channel until it doesn't work.
This still just looks like a relief rally thus far and we still need more time to see if the ever famous 4-year cycle is broken.
The theory of that alone invites its own scenario for a push that could be further fueled with a short squeeze along with further fuel from the idea that the cycle is now broken, only to turn around and become the normal fake out double top bear winter.
Patience is the key here and keep it simple and moves small or SL tight

CHAINLINK (LINK) - Are you watching accumulation, or just price?Most traders focus on price swings .
Institutions focus on where price stops falling and time starts doing the work .
That’s exactly what we’re seeing on LINK right now.
⸻
🔍 What TrendGo Accumulate is showing
For 94 bars , LINK has been moving inside a clear Accumulation zone :
• Price is holding above the Accumulate baseline
• Volatility is compressed
• Institutional volume remains low but persistent
• Every deeper pullback gets absorbed, not rejected
This is not a breakout phase.
This is inventory building .
⸻
🧠 How to read this correctly
Accumulation phases are not about speed.
They are about patience and positioning .
Historically, when LINK entered similar Accumulate zones:
• Price stopped trending down
• Time replaced volatility
• Expansion came after most traders lost interest
Right now, price is still boring.
That’s usually when risk is lowest - not highest.
⸻
⚠️ What would invalidate the idea?
• Losing and closing below the Accumulate zone
• Accumulation turning into distribution (no longer absorption)
Until then, this is structure before direction .
⸻
📌 Final thought
You don’t need to predict the breakout.
You need to recognize when the market is preparing one .
This is what TrendGo Accumulate was built for.
What do you see here - accumulation or just another range? 👇

ETH-The final drop before the cows come home (SHORT TERM SHORT)hello all 👋🙋♂️🙋♀️ Thank you so much for coming today
Let's get right to it💡. Today we are looking at a 4 hour view of ETHEREUM. I have noticed several things about ETH price action and what it could indicate.
⬆️ above on chart 📈📉 you can see I have labeled
major trend line (support line)
We have made contact with this long standing trend line and have seen some bullish pressure after doing so.
🤸🤸♂️
HOWEVER
There has been a Head and shoulders bearish pattern formed on the 4 hour view in which we did go down from but bounced back up to make a bearish flag 🐻🧸
🌊🏄♂️🏄♀️
MORE RECENTLY
We have formed a bearish harmonic pattern, which leads me to believe we will try to continue our head and shoulders pattern (with a drop in price) ⏬🔻But will catch support at our major trend line ~(3800)
🐼This is a Short term short Idea. The cryptocurrency market is extremely volatile.💣
This is not financial advice
🐶
Always have a stop loss ✋🛑💲 set🆗
Any thoughts 💭💡, questions 🙋♀️🙋♂️❓, good 👍, bad👎, happy 😄 or sad 😥, in the comments always welcome.😄
Jazerbay ☯️

SOL - Descending Wedge Rejection at $145 | FVG Retest Incoming
What's up traders! 👋
SOLUSD is setting up for a key move. We've got a symmetrical wedge pattern with price respecting the descending resistance perfectly - hitting it and getting rejected. Let me break down what I'm seeing on the 45-minute chart.
The Setup
SOL is trading at $144.85 on the 45-minute timeframe. Price is inside a symmetrical wedge pattern - descending resistance on top (lower highs) and ascending support on bottom (higher lows). The key here: price just hit the descending resistance near $145-$147 and got REJECTED.
This is textbook wedge behavior. Price respects the trendlines until breakout. Right now, it's following the wedge DOWN toward the FVG zone.
Why I'm Leaning Bearish (Short-Term)
Price rejected from descending resistance at $147
Failed to clear $150 resistance - sellers defending
Dropped below $146 and $145 - now below 100-hour SMA
Hourly RSI below 50 - bearish momentum
MACD showing bearish pressure
Long/short ratio at 0.7569 - traders leaning short
$10.5M in liquidations - $7.7M were longs
3M performance: -20.40% | 1Y: -29.60% - macro downtrend
The Wedge Structure
DESCENDING RESISTANCE (Top): Lower highs forming - sellers capping rallies at $145-$147
ASCENDING SUPPORT (Bottom): Higher lows forming - buyers defending around $138-$140
CURRENT ACTION: Price hit descending resistance and rejected
FVG ZONE: $140-$142 is the next target for retest
TREND: Following the wedge DOWN until breakout
The News Context - January 16, 2026
Mixed signals but leaning bearish short-term:
SOL failed to hold above $146 - entered short-term correction
Price below 100-hour simple moving average
Broke below 61.8% Fib retracement of $138-$149 move
$10.5M liquidations - mostly longs ($7.7M)
Long/short ratio 0.7569 - traders positioning short
RSI below 50, MACD bearish
Bullish Catalysts (Watch For Breakout)
Solana ETF inflows $23.57M - highest in 4 weeks
Forward Industries building largest SOL treasury (6.9M SOL)
Alpenglow upgrade coming - transaction finality 100-150ms (from 12.8s)
RWA ecosystem hit $1.15B record valuation
Network processed $1.6T in 2025 trading volume
68M active addresses (up 14%) - most used network
Open Interest jumped from $6.8B to $8.8B
"Clarity Act" could ease SEC requirements for SOL
Key Levels I'm Watching
Resistance:
$145.50 - Day's high / immediate resistance
$146 - First major resistance
$148.29 - MAJOR RESISTANCE (breakout level)
$150 - Psychological round number
$155 - Next target if breakout
$162 - Extended bullish target
$200 - Analyst target (if network growth continues)
Support:
$144.85 - Current price
$141 - Bullish trendline support
$140-$142 - FVG ZONE (key retest target)
$140.23 - MAJOR SUPPORT (76.4% Fib)
$138 - Swing low
$137.72 - CHANNEL BOTTOM
$132 - Next support if breakdown
$124 - Extended bearish target
Two Scenarios
BEARISH CONTINUATION (PRIMARY):
Price continues following the descending wedge. After rejecting from $145-$147 resistance, SOL drops to retest the FVG zone at $140-$142. If FVG fails to hold, continuation to $137.72 channel bottom.
First target: $141 (trendline support)
Second target: $140.23 (major support / 76.4% Fib)
Extended target: $137.72 (channel bottom)
Breakdown target: $132, then $124
Triggers: Continued rejection at descending resistance, break below $140, risk-off sentiment, no major bullish catalyst.
BULLISH BREAKOUT (ALTERNATE):
Big news hits and price breaks above the descending wedge resistance. SOL clears $148.29 with volume and targets higher levels.
First target: $150 (psychological)
Second target: $155 (next resistance)
Extended target: $162, then $173
Moon target: $200 (if network growth accelerates)
Triggers: Break above $148.29 with volume, major ETF news, Alpenglow upgrade hype, institutional buying.
My Take - BEARISH BIAS (Short-Term)
I'm leaning BEARISH here. Here's why:
1. Price respecting descending resistance - SOL hit the wedge top at $147 and got rejected. This is textbook - follow the trend until breakout.
2. Technical indicators bearish - RSI below 50, MACD bearish, below 100-hour SMA. Momentum favors sellers.
3. Liquidation data bearish - $7.7M in long liquidations vs $2.8M shorts. Longs getting squeezed.
4. Long/short ratio bearish - At 0.7569, traders are positioning short. Smart money leaning bearish.
5. Macro structure weak - Down 20.40% in 3 months, down 29.60% in 1 year. Still well below $295 ATH.
BUT - Watch for the Breakout
The bullish catalysts are real:
ETF inflows strongest in 4 weeks
Alpenglow upgrade is massive (100ms finality)
Institutional adoption growing (Forward Industries)
Network fundamentals strong (68M addresses, $1.6T volume)
If big news hits, SOL could spike above $148.29 and invalidate the bearish thesis. But until that happens, I'm following the wedge DOWN.
Trade Plan
Bearish Entry (PRIMARY):
Entry: Rejection at $145-$146 resistance OR break below $141
Stop: Above $148.29 (above major resistance)
Target 1: $141 (trendline)
Target 2: $140.23 (major support)
Target 3: $137.72 (channel bottom)
R:R: ~1:2
Bullish Entry (if breakout):
Entry: Break above $148.29 with volume
Stop: Below $144
Target 1: $150 (psychological)
Target 2: $155
Target 3: $162
R:R: ~1:2.5
The Bottom Line
SOLUSD is respecting the symmetrical wedge perfectly. Price hit descending resistance at $147 and got rejected - now heading toward the FVG zone at $140-$142 for a retest.
Short-term, I'm BEARISH. Follow the wedge until it breaks. The FVG zone at $140-$142 is the next target. If that fails, $137.72 channel bottom is in play.
Long-term, the fundamentals are strong (ETF inflows, Alpenglow upgrade, institutional adoption). But technicals say DOWN until we break above $148.29.
Watch the FVG zone. That's your tell.
What do you think? Continuation down or breakout up? Drop your thoughts below! 👇

$UFD: 100x Extremum Breakout SetupCHART ANALYSIS
Two fake-outs cleared. Year-long base complete. Bottom confirmed. Breakout imminent.
📊 KEY LEVELS:
Current: $0.014516
Resistance: $0.041121 (+183%)
Extremum Target: 100x zone
📈 PATTERN:
12-month accumulation base ✓
May + July fake-outs shook weak hands ✓
February 2025 bottom confirmed with BUY signal ✓
Clean resistance at 0.041121 ready to test
Historic breakout window: March-May 2025
THE FUNDAMENTAL EDGE
365 consecutive days of building. Zero days missed.
While 95% of crypto projects die within 6 months, UFD's developer has shown up EVERY. SINGLE. DAY. for an entire year to build and engage the community.
This isn't normal. This is top 1% commitment that creates:
Unshakeable community loyalty
Zero rug risk
Compounding product development
Cult-like holder conviction
WHY THIS COULD PARABOLIC
Technical + Fundamental Convergence:
When you get a developer building daily for 365 days AND a textbook accumulation pattern completing, you're not looking at a trade. You're looking at a generational setup.
🎯 The Math:
Entry: $0.014516 (NOW)
Target 1: $0.041121 = 183% gain
Target 2: 100x zone = 6,900% gain
Risk/Reward: 1:100+
🔥 The Narrative:
Once CT discovers "the dev that never missed a day for a year" + "the chart that bottomed perfectly," FOMO goes nuclear.
TIMELINE
Now - March 2026: Final accumulation, resistance test
March - May 2026: Breakout window opens
May - July 2026: Extremum 100x zone activation
THE SETUP
✓ 12-month base complete
✓ Weak hands eliminated via 2 fake-outs
✓ Bottom confirmed with technical signal
✓ 365 days proven developer commitment
✓ Battle-tested community
✓ Asymmetric risk/reward (1:100+)
⏳ Breakout pending
This is what accumulation looks like before the parabolic move.
The question isn't IF—it's are you positioned WHEN.
DYOR. Not financial advice. Chart patterns + fundamentals suggest rare alignment. Position accordingly.

ethusdt don't take my word, but a short at this level, to target the bottom of the bull flag is not a bad idea.

aster usdt long trade possible this view is for educational purpose not a buy sell advice aster usdt can pump 20-30% from my zone

BTCUSD — Intraday Local ShortContext:
Within the current daily composite structure, price is showing a local rotation, pointing to potential short-term distribution.
Observation:
• Rotation within daily composites
• Signs of buyer absorption
• Upside momentum stalled after the impulsive move
Expectation:
If absorption holds, a short-term intraday short may develop from the 96,100–96,400 zone, with a potential move toward 92,900.
Invalidation:
The idea is invalidated if price accepts and holds above 97,100.
Risk:
Higher-risk intraday conditions. Strict position sizing and execution discipline are essential.
Note:
Bias does not equal execution.
Confirmation over anticipation.
Follow for updates and next intraday ideas.

DAM/USDT: Analyzing the Accumulation Floor & Asymmetric UpsideThe Macro Context After a prolonged correction phase (-69% YTD), DAM (Datamine) appears to be establishing a definitive "Market Bottom" structure on the Daily timeframe. The aggressive selling pressure has subsided, leading to a period of stabilization and quiet accumulation.
Why this setup is on our radar:
Seller Exhaustion: The chart shows a classic "rounding bottom" formation. The lack of lower lows suggests that the capitulation phase is over.
Asymmetric Risk-to-Reward: Entering near historical lows offers a unique advantage. The distance to the invalidation level (zero or recent low) is minimal compared to the upside potential of returning to previous valuations.
Market Cycle : With altcoins showing signs of life (+21% in the last month), rotation into undervalued, bottomed-out assets often follows.
Technical Levels & Plan:
Buy Zone: We are looking to accumulate positions in the 0.027 - 0.028 region.
Invalidation Level: A weekly close below the swing low (~0.015) would compromise the structure. ( Note: Due to volatility, manage position size carefully).
Structural Resistance (Targets):
Short Term: 0.030 - 0.034 (Local Supply)
Mid Term: 0.052 - 0.067 (Break of structure)
Macro / Moonbag: If price discovery kicks in, we look towards 0.17 and higher (0.50+) as widely spaced psychological targets.
Risological Note: This is a "Position Trade," not a scalp. The thesis relies on the market pricing this asset as "oversold." Patience is the strategy here.
Disclaimer: This analysis is for educational purposes only. Crypto assets are highly volatile. This is not financial advice.

“Bitcoin 4H Bullish Continuation Setup — Liquidity Target at 98KMarket Structure
Bullish overall structure: Strong impulsive move up from the low ~90k area.
CHoCH (Change of Character) on the left confirms a shift from bearish to bullish.
Current price action is consolidating after impulse, which is typical before continuation.
Key Concepts on the Chart
1. Fair Value Gaps (FVG)
Lower FVG (~94k area)
This has already been respected → good sign of bullish strength.
Mid FVG inside the range
Price is currently reacting within this imbalance, suggesting accumulation.
👉 As long as FVGs are respected, bias remains bullish.
2. Fibonacci Levels (Internal Retracement)
From the impulsive leg:
0.618 ≈ 96,691
0.5 ≈ 96,290
0.0 ≈ 94,941
Price is consolidating between 0.5–0.618, which is a classic bullish continuation zone.
3. Support Levels
Primary support: 94,353
Major invalidation / deeper support: 93,073
📌 If price holds above 94,353, bullish continuation is favored.
📌 A clean break and close below 93,073 would weaken this setup significantly.
4. Resistance & Target
Range high / Liquidity: ~97,900 – 98,100
Marked TARGET POINT ≈ 98,117
This aligns with:
Previous highs
Liquidity resting above the range
Measured move from consolidation
Projected Scenario (Blue Path)
Short-term chop / minor pullback within the range
Hold above FVG + support
Expansion move targeting 98k+
This is a textbook continuation model.
Bias Summary
Bias: Bullish 📈
Invalidation: 4H close below ~93k
Target: 97.9k → 98.1k
Key Area to Watch: 94.3k–95k reaction zone

TAO Finds Its Balance After a Long Pullback - What Comes Next?* TAO has managed to reclaim an important level after a long pullback, which is starting to shift how the chart looks in the short term.
* The price is now moving into an area that could decide whether this bounce has real legs or stalls out.
* Momentum is improving, but the chart is still asking for confirmation before calling this a full trend reversal.
When you zoom out and look at TAO, it’s clear the selling pressure has eased, even if the market isn’t ready to call this a full recovery yet.
After a long pullback, the TAO price has finally found some footing, and that alone changes the tone. Price isn’t racing higher, but the constant push to the downside has slowed.
The move above $290 was an important moment. That level had capped the TAO price for months, knocking back every rally. Clearing it didn’t suddenly flip the chart bullish, but it did show that sellers aren’t in full control anymore. TAO has shifted out of defense mode and is now testing whether it can build something higher.
Lately, the price action has been more of a grind than a surge. Momentum has cooled, volume has thinned out, and attention has drifted. That doesn’t automatically signal weakness. After a solid move, markets often pause like this while expectations reset.
The market cap data fits that picture. Instead of slipping lower during the bounce, TAO’s market cap has been holding steady and inching up. That suggests capital is sticking around and traders are more willing to sit through pullbacks rather than rush for the exit.
From here, structure matters more than sentiment. The $355–$360 zone is still the key hurdle. Until TAO can work through that area, the move remains a recovery, not a confirmed trend change. For now, the TAO price is holding its ground, and that’s a meaningful signal on its own.

BTCUSD | Broke 94k | 100k next?Fundamental approach:
- Bitcoin prices advanced this week, supported by renewed institutional inflows into spot Bitcoin ETFs and shifting expectations around US inflation and Fed policy. The move came amid a broader improvement in risk sentiment across crypto assets as prices stabilized above key psychological levels.
- ETF data showed US spot Bitcoin products returning to net inflows from 12 Jan till now, ending several days of redemptions and signaling fresh institutional demand for the asset class. This coincided with easing concerns after the latest US inflation readings, which kept alive the narrative of eventual Fed rate cuts and helped underpin appetite for higher‑beta assets like bitcoin.
- Bitcoin prices may remain sensitive to incoming US labor and growth data, as well as any shifts in Fed rhetoric that could alter the path of rate cuts. Potential catalysts include additional spot Bitcoin ETF flow data and regulatory or legislative headlines on US digital asset policy.
Technical approach:
- After breaking above the previous swing high, BTCUSD has created higher swings. The price is above both EMAs, indicating a potential bullish trend setup.
- If BTCUSD remains above EMA78, the price may advance further and retest the immediate resistance at 100000.
- On the contrary, breaking below EMA78 may prompt a further correction toward the following support at 89000.
Analysis by: Dat Tong, Senior Financial Markets Strategist at Exness

ETHUSD H4 | Bullish Bounce Off Key SupportBased on the H4 chart analysis, we could see the price fall to our buy entry level at 3,201.69, which is an overlap support that is slightly below the 50% Fibonacci retracement.
Our stop loss is set at 3,069.75, which is an overlap support that aligns with the 50% Fibonacci retracement.
Our take profit is set at 3,370.40, which is a multi swing high resistance.
High Risk Investment Warning
Stratos Markets Limited (

marketreview Greetings, traders.
I’d like to comment on the current crypto market situation to clarify why there has been little analysis published in the group recently.
In my opinion, the market is currently in a state of indecision — it lacks a clear directional bias. Consequently, there are no clean charts or structures that would hint at the future trend.
For now, we are simply moving sideways with occasional price spikes up and down. However, this volatility is chaotic, and trading it is, in my view, a lottery.
I have seen this before, and the only correct decision is to wait for better conditions. This market phase is not eternal; the longer it lasts, the closer its end.
I scan the market daily looking for a high-probability setup. But if I don't find anything — I won't publish anything. Better to stay flat than to force a bad trade.
The Traders House

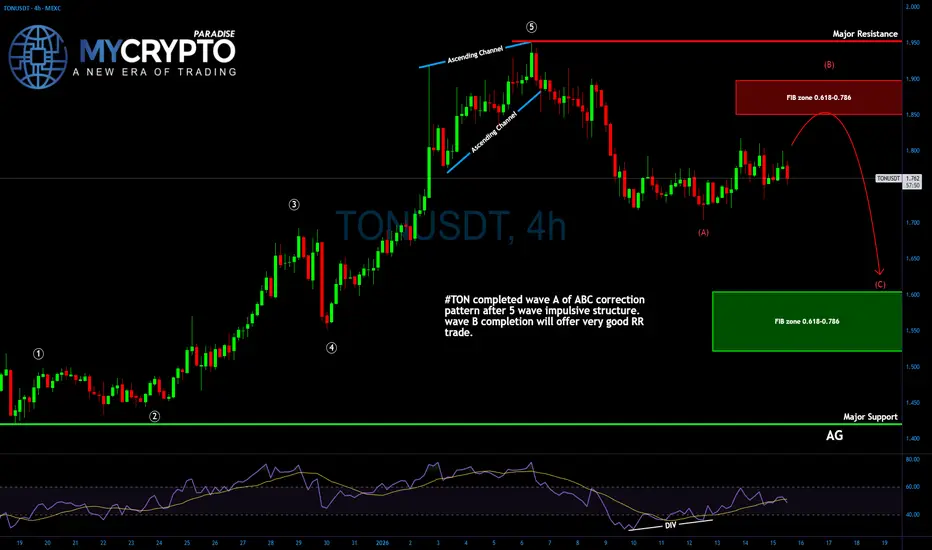
#TON’s Next Move Could Wipe Out Late Bulls – Are You Exposed?
Yello, Paradisers! Are you positioning yourself correctly, or is #TON about to pull a classic fakeout and leave you stuck on the wrong side? What looks like strength to the average trader might actually be the perfect setup for a calculated correction. If you’ve been with us for a while, you know these are the moments that separate pros from gamblers.
💎#TONUSDT has just completed its A wave of the ABC corrective pattern after delivering a clean and aggressive 5-wave impulsive rally. Now, the asset is entering its B wave, and this next phase is where calculated traders thrive. These corrective structures often offer some of the best risk-reward setups—if approached with discipline and proper structure.
💎The top of the fifth wave now stands as a key resistance area. If price breaks through this level with conviction, it will invalidate the current short bias and suggest a broader bullish continuation. On the other side, the $1.420 support level becomes the critical invalidation point for the bullish outlook. If that level fails, bulls need to step aside, and a deeper leg down becomes likely. This is not the time to trade emotionally. It’s the time to stalk the chart like a sniper—waiting for price to come to your area, not the other way around.
💎For now, the Fibonacci zone between $1.850 and $1.900 is emerging as an ideal region to consider as Resistance zone for active trader, especially with clear structure and confluence at that level. Likewise, the $1.600–$1.500 area presents a high-quality support zone if market provide the right reaction. These are the zones where real trading happens—not in the middle of the chart where noise reigns and risk is undefined.
💎It’s also important to remember that we are currently in a corrective move, not an impulsive one. That means exit strategies must be conservative. There is no room for greed here. The priority must be capital preservation, not oversized expectations. Take what the market gives and be ready to move on to the next setup with your capital intact.
But it never is, and never will be a free ride. Make sure you play it smart, Paradisers; the next 6–9 months will be juicy for some and painful for others. Discipline, patience, robust strategies, and trading tactics are the only ways you can make it long-term in this market.
MyCryptoParadise
iFeel the success🌴
HTRUSDT to the riseThe last time I published the idea on HTR when it was $0.255 it did the 10X as I predicted and reached $2.5.
Again, it is not the same now as it was then.
The value of Total2 is now around 1.35T and keep a close eye on this one. Once it reaches around 1.75T Total2 the whole of alt market will gain retail volume and the cycle starts again.
HTRUSD is currently in accumulation phase and I am calling this as their bottom.
There has been a new advancements for their feeless instant settlement chain.
1. DEX (dozer.finance)
2. Nano contracts (About to reach permission less deployment)
3. Great roadmap for 2026 with AI, Privacy, new token release model, blueprint marketplace. (hathor-public-files.s3.us-east-1.amazonaws.com)
4. Incentive for being an early Liquidity provider. (dozer.finance)
The volume is currently low but make use of this opportunity to accumulate both on CEXs and DEX. When the volume finally reaches you won't get such good opportunity.
I am not expecting anything less than 100X this time around. Current price for KUCOIN:HTRUSDT is around 1 cent and the price will definitely reach the previous ATH when altseason begins (Which again I expect in few weeks). Gather and wait is what I will be doing myself. LP on DEX looks attractive if you like to be technical and get advantage of their rewards.
X: @HathorNetwork
Website: hathor.network
DEX: dozer.finance
Telegram: @HathorOfficial
Disclaimer:
The content reflects my personal opinion and is not financial advice.
Always do your own research before trading.
Ideas published from my account are for educational purposes only.

Stablecoin Dominance Pullback = Risk ReturningChart: STABLE.D (Crypto Stablecoin Dominance) vs OTHERS.D
Timeframe: 1D
Context: Crypto market risk appetite
Thesis
Stablecoin dominance has rolled over after an extended uptrend, while OTHERS.D has stabilized and begun to base. This suggests capital is rotating out of stables and back into risk assets, particularly altcoins.
🔍 What the Chart Shows
STABLE.D put in a strong impulsive move higher, signaling prior risk-off behavior
Recent price action shows loss of momentum and a pullback from local highs
At the same time, OTHERS.D stopped making lower lows and is attempting to stabilize
This inverse relationship often marks a transition phase in market structure.
📈 Why This Matters
Rising stablecoin dominance = capital sidelined, defensive positioning
Falling stablecoin dominance = capital redeploying into crypto assets
If STABLE.D continues to trend lower, it supports:
Improved risk appetite
Better conditions for alts to outperform
Less demand for “parking capital” in stables
❌ Invalidation
This view would weaken if:
STABLE.D reclaims recent highs with expansion
OTHERS.D loses its current base and breaks down
That would signal a return to risk-off behavior.
🎯 Takeaway
Stablecoin dominance is a macro sentiment gauge.
This pullback suggests the market may be shifting from defensive to selective risk-on, especially outside BTC.
Watch follow-through — rotations take time.

Bitcoin back in the fight and under pressure. MAJOR resistance
While we all remain ever so Bullish and LONGS increase, we REALLY need to remember just where Bitcoin PA is Right now.
In an area that could very easily turn into a Bear Trap, as it did in 2021
Why could this happen?
WE ARE UNDER MAJOR RESISTANCE.
Why ?
Looking at the chart justt above, we can see that rising Trend line..This is NOT a Weak line.
Here is the same chart zoomed out.
To Cross this line and remain above it Will be just the First Step towards a new ATH.
The MAJOR Wall is as we get near that 100K -> 106K line.
Remember this Chart ?
The Blue Arc of Resistance. The One thing that has rejected EVERY Bitcoin ATH since Bitcoin started.
This line MUST be crossed but is Obviously HUGELY STRONG
A Closer View of where we are now on this chart.
So, that current green candle we know is just under that Cycle line of resistance mentioned earlier.
The next step is that 50 SMA ( Red, Just around where we see that Blue Arc.
AND we see PA in a Squeeze.
We have come back up to this and approach a new APEX around end of March 2026.
PA always reacts before the APEX>
We now have PA snadwiched between the 50 SMA and the 100 SMA ( Blue )
That 100 is also around that LONGGGGG term line of support
We really do NOT want to loose that support.
But this may happen if we do not break through that Blue Arc.
But we have talk of New beginnings for Bitcoin......
New Cycle patterns appear to be forming
Super Cycles are possible as we see signals that the 4 year cyce pattern maybe ending,,Yet to be proved.
And this could happen with out Major change to long term PA patterns.
This would NOT involve dropping out of the Area PA has been in since 2017
PA can drop as low as 60K before long term Channrl is Lost.
So, here we are, New patterns maybe forming and we will not know for a Long time yet. Proof of change is onlly seen afterwards
Should PA break over that Blue Arc, It MUST be used as support after.
Fasinating Times......Watch that 50 Month SMA closely.
We Break that, Off we go
So, we wait

#ICP Is Coiling Up for a Big Move— Classic HNS pattern
Yello Paradisers! Have you spotted what’s shaping up to be a textbook Head and Shoulders pattern on #ICP? If not, you might be missing one of the cleanest bullish setups we’ve seen forming in recent weeks. The structure is clear, and the signals are starting to align—this could be your early heads-up before the next big leg.
💎We’re currently watching a classic inverse Head and Shoulders pattern unfolding, with a notable RSI divergence between the left shoulder and the head. That divergence often signals momentum shifting before price action catches up, and in this case, it’s a sign that buyers may be stepping in just as the pattern is maturing.
💎The neckline is the key level here. If the price breaks through that neckline with conviction, it will confirm the pattern and open the door to a high-confidence breakout scenario. But until that happens, patience is essential. Confirmation is everything in this type of setup.
💎To the downside, major support sits around $2.660. This will act as the final line in the sand for the bullish scenario. If price holds above this level, the bullish structure remains valid. A breakdown below it, however, would invalidate the setup and likely lead to further downside pressure.
💎The first obstacle is around $4.800, just below the psychological round number, which is also the projected level of the HNS pattern. This level may provide temporary rejection or hesitation. The bigger take-profit zone is around $6.500, which marks a significant resistance zone and aligns perfectly with the 0.618 Fibonacci retracement from the Nov–Dec 2025 downswing. That confluence adds even more weight.
💎The market is setting the stage, but the trade isn't ready yet. What matters now is not being early but being right. Let the pattern complete, let the market confirm, and then strike with confidence.
That is why we are playing it safe right now. If you want to be consistently profitable, you need to be extremely patient and always wait only for the best, highest probability trading opportunities like Paradisers do.
MyCryptoParadise
iFeel the success🌴

XAUUSD (Gold) 1H – Buy the Dip from Strong Demand ZoneGold is currently pulling back into a key demand/support zone, which previously acted as a strong base for bullish continuation. This area is marked as a high-probability buy zone, where smart money showed interest earlier.
Price reaction from this zone suggests buyers are still active. As long as the support holds, we can expect a bullish reversal and continuation toward higher highs.
🔹 Trade Idea:
Buy Zone: Marked demand area (best place for buy)
Target: Previous highs / upside continuation
Invalidation: Clear break and close below the demand zone
⚠️ Always wait for confirmation and follow proper risk management.

Bitcoin H4 | Bullish ContinuationThe price is falling to our buy entry level at 94,586.97, which is a pullback support that aligns with the 38.2% Fibonacci retracement.
Our stop loss is set at 91,471.34, which is a pullback support that aligns with the 78.6% Fibonacci retracement.
Our take profit is set at 100,327.98, which is a pullback resistance that iss lightly above the 100% Fibonacci projection.
High Risk Investment Warning
Stratos Markets Limited (
