TradeCityPro | Bitcoin Daily Analysis #200👋 Welcome to the 200th Daily Bitcoin Analysis!
To celebrate this milestone, today’s analysis will be different, our main focus will be on the XAUBTC chart, but first, let’s analyze gold and Bitcoin separately before combining the two.
✅ Gold
📅 Monthly Timeframe
Gold is in a completely bullish trend on the monthly chart and, in its latest candle, has set a new all-time high (ATH) at $4,380.
💥 The momentum of this wave, which started from $1,980, is extremely strong — not only has the RSI entered the Overbought zone, but it has also broken through the Overextended level at 85.55 and now stands at 92.
💫 The last time gold’s RSI was in this range was in 1973, about 50 years ago, making this the strongest momentum in half a century.
🔍 Considering that gold has risen more than 100% without any major correction and has reached the 1.5 Fibonacci level, the probability of a correction is very high.
✨ If the price continues to rise sharply in the next few candles, the trend will become unsustainable, since there has been no major profit-taking — a warning sign for the continuation of the rally.
📊 In case of a correction, the main Fibonacci support levels are $3,500 and $3,000, which are potential targets if the retracement begins.
👀 If this happens, two possible scenarios emerge:
🏦 Increased gold supply, which is unlikely due to its scarcity.
Profit-taking by institutional “whales” (such as government treasuries), which is a much more probable reason for a correction.
💵 Bitcoin
📅 Weekly Timeframe
Bitcoin is in a bullish trend on the weekly timeframe, having completed seven upward waves, with the last peak recorded at $124,000.
✨ This top was a fake breakout, followed by a correction candle, and the price is now moving toward the $100,000 region.
🔽 A strong triple-top bearish divergence is visible on the RSI, with confirmation coming if 44.53 is broken.
📉 If confirmed, Bitcoin could enter a long-term corrective phase, with possible downside targets near $70,000.
🧩 However, the trend is still bullish as long as no lower high and lower low form below $100,000.
💡 This means Bitcoin could potentially make one more upward leg, forming a rare nine-wave pattern — uncommon, but possible.
⭐ Given that gold is likely entering a correction phase, the profits taken by gold whales could flow into crypto, potentially fueling Bitcoin’s next upward wave.
👑 Bitcoin Dominance (BTC.D)
📅 Weekly Timeframe
Bitcoin dominance has been in an uptrend, reaching 65.84%, but weakness in the trend and rejection from that level triggered a deep correction.
💫 After breaking 60.64, it fell to 57%, where it has since bounced.
📉 If dominance forms a lower high below 60.64 (or even below 65.84) and then breaks 57%, that would confirm a downtrend.
✔️ In that case, the dominance targets are 55.26, 51.06, and potentially 47.76.
🚀 This scenario suggests that if money flows from gold into Bitcoin, it may later flow into altcoins as dominance declines — setting the stage for a possible altcoin season.
🔑 XAUBTC Chart
🧮 This chart represents gold’s strength relative to Bitcoin.
As seen, its overall structure in recent years has been bearish, reflecting stronger investment interest in Bitcoin compared to gold.
📊 The trend remained bearish until early 2025, showing no weakness — until recently.
🔺 After finding support near 0.027, the trend has shown clear signs of weakening, and price action now hints at potential bullish reversal signals.
☘️ The price has already formed a higher low, and if it consolidates above 0.03922 next week, we’ll have the first confirmation of a trend reversal.
📈 The main bullish confirmation would come after breaking 0.04543.
⚡️ However, one possible scenario is that gold enters a correction phase while Bitcoin completes its final bullish wave.
✅ Since this chart faces two strong resistance zones, rejection from 0.03922 or 0.04543 could send it back toward 0.027, implying a gold correction and a final bullish leg for Bitcoin.
💥 Considering Bitcoin dominance may also drop, it’s likely that capital will first move from gold into Bitcoin, and then, as dominance falls, into altcoins — potentially triggering the long-awaited altcoin season where altcoins experience explosive rallies.
⚖️ This is just one possible market scenario; other outcomes are possible.
Remember: Always conduct your own research before making any investment decisions.
Cryptomarket

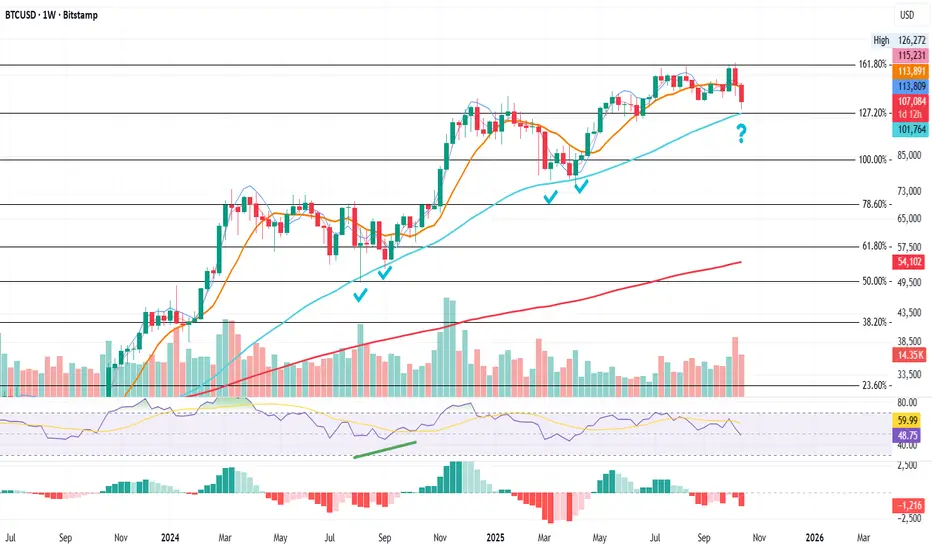
BTC Weekly Series – Tracking the Price, Week by Week
BTC Weekly – The Line That Defines the Cycle
On this chart, one line has quietly supported Bitcoin since the March 2024 ATH: the blue cayenne line, the 50-week moving average.
It held the dip after the January 2025 ATH, and now we’re about to find out if it can do it again after the September 2025 ATH.
Each time price needed that support, it tested the 50-week MA twice before reversing higher.
There’s also a recurring pattern with Fibonacci levels:
* After the March 2024 ATH, price lost the 61.8 Fib, touched the 50-week MA, and bounced.
* After the January 2025 ATH, price lost the 100 Fib, touched the 50-week MA, and bounced.
This time, things are different.
The 50-week MA now aligns exactly with the 127.2 Fib, meaning there’s no safety net below.
If this level fails, there’s nothing technical left beneath it that has caught price since March 2024.
That could make any future leg higher more difficult to form.
From here, the focus should be on weekly closes.
They will tell us whether this structure still holds or if we’re about to enter a deeper correction phase.
I’ll continue updating this view at the end of each week or on Mondays, to keep track of how this key level evolves, both for myself and for anyone following the cycle closely.
Always take profits and manage risk.
Interaction is welcome.
ETH Long into Q4📈 Ethereum / USD (1W) – Macro Outlook
Ethereum is consolidating after a strong rally, currently finding support near the 0.382–0.618 Fibonacci retracement zone — a historically key area for continuation setups.
If this structure holds, ETH could be gearing up for its next macro leg, with potential upside targets aligning around:
⚪ Very Likely: ~$6,400
🔵 Likely: ~$7,800
Key Support Levels to watch:
$3,850 → short-term support
$3,220 → major retracement support
As long as ETH maintains higher lows above the 0.618 region, the macro bullish structure remains intact — indicating that Ethereum may just be cooling off before its next impulse.
🚀 Macro trend still favors continuation, but short-term volatility remains high.
#Ethereum #ETH #Crypto #TechnicalAnalysis #ETHUSD #Altcoins #CryptoTrading

ETHBTC Rally into Q4📊 Ethereum vs Bitcoin (ETH/BTC) – Weekly Chart Update
ETH/BTC has officially broken out of its long-term downtrend (yellow trendline) that’s been in play since 2022. After the breakout, price is now retesting the previous resistance area — a classic move before potential continuation.
🔹 Key Levels to Watch:
Resistance Zone: 0.059–0.063 BTC (Fibonacci 1.272–1.414 extension zone, highlighted in yellow)
Major Target: 0.067 BTC (Fib 1.618)
Support: 0.033–0.035 BTC
Long-term support: 0.024 BTC
A successful hold above the breakout zone could confirm a trend reversal in favor of Ethereum dominance. A rejection, however, might lead to another leg down before accumulation.
🚀 Will ETH finally regain strength vs BTC, or is this just a relief rally?
#ETHBTC #Ethereum #Bitcoin #CryptoTrading #TechnicalAnalysis #AltcoinSeason #CryptoChart

Bitcoin Market Analysis – October 18, 2025👀 Current Outlook:
Price has found support around the 104,000 zone, and there’s a good chance we might start building a consolidation zone here.
📈 If that consolidation forms, a breakout above 107,000 could trigger a long position and signal renewed bullish momentum.
📉 On the flip side, if 104,000 breaks again, we may see a deeper drop, which could weaken the overall bullish structure and make it harder for the market to reach new all-time highs in the near future.
⚡️ In case of a sharp reversal and a V-pattern formation, it’s better to shift to a bullish bias and follow the momentum.
🕒 On the 15-minute timeframe, if we’re trading within the range, a break below 106,000 could provide a short setup.
---
💡 Conclusion:
Stay patient and wait for clear confirmations before entering any trades. Let the market show its direction — then follow the trend with discipline
For informational purposes only – not financial advice. © DIBAPRISM
Larry D.Kohn

MUBARAK/ USDT attempting Breakout_Need confirmation for rallyMUBARAK is currently breaking out from its trendline resistance with strong potential. A successful breakout and hold above this level could trigger a short-term bullish move.
Always wait for confirmation before entering and manage risk wisely.

TradeCityPro | AVAX: Downtrend Persists Near Key Support👋 Welcome to TradeCity Pro!
In this analysis, I want to review the AVAX coin. One of the older crypto projects active in RWA, it has a market cap of $8.48 billion, ranking 18th on CoinMarketCap.
⏳ 1-Hour Timeframe
On the 1-hour chart, we see a downtrend in this coin, which has continued after last week’s decline.
✨ After the 23.06 level was faked, bearish momentum entered the market, and a new downwave began. After breaking the 20.68 support, the price dropped to 19.10 and is now in a correction and pullback phase.
📊 Volume has significantly decreased during this correction, indicating the strength of the downtrend. Although today is Saturday and the overall market volume is low, if the price moves back toward 19.10 with increasing volume, we can confirm the volume for the bearish trend.
💥 The RSI oscillator is correcting alongside the price and, after exiting Oversold, is currently around 50.
⭐ If the 50 level breaks, it signals that bearish momentum in the market has decreased, and AVAX could enter a range-bound or corrective structure.
✔️ On the other hand, if selling volume returns and RSI moves toward 30, breaking this level would bring bearish momentum back into the market. In this case, breaking the 19.10 trigger allows us to open a short position.
🔍 For now, there are better coins for long positions that have recovered more. On AVAX, as long as it stays below 20.68, long positions don’t make much sense.
📝 Final Thoughts
Stay calm, trade wisely, and let's capture the market's best opportunities!
This analysis reflects our opinions and is not financial advice.
Share your thoughts in the comments, and don’t forget to share this analysis with your friends! ❤️

Winter is coming part 2This is a follow up idea to my last post just to make things more interesting.

Buy Bitcoin 106500Bullish, tp 130k.
Bitcoin is testing a key resistance near 108,000. A breakout above this level could trigger a strong bullish continuation. Watching for a clean close above resistance to confirm the move toward higher targets.
Good luck!

Winter is coming!Hey Guys,
As you know Bitcoin can't pump forever and will eventually take a break for a while and it seems to me that every 4 years starting from October 3 months candle it does exactly the same thing.
Now keep in mind that this drop might happen between now and December so expect price volatility soon.
I have another prediction for altcoins drop which I will try to post as soon as possible but in the mean time we must be prepared for this scenario!
And I would appreciate your thoughts about my idea so please feel free to write a comment and let me know what you guys think.

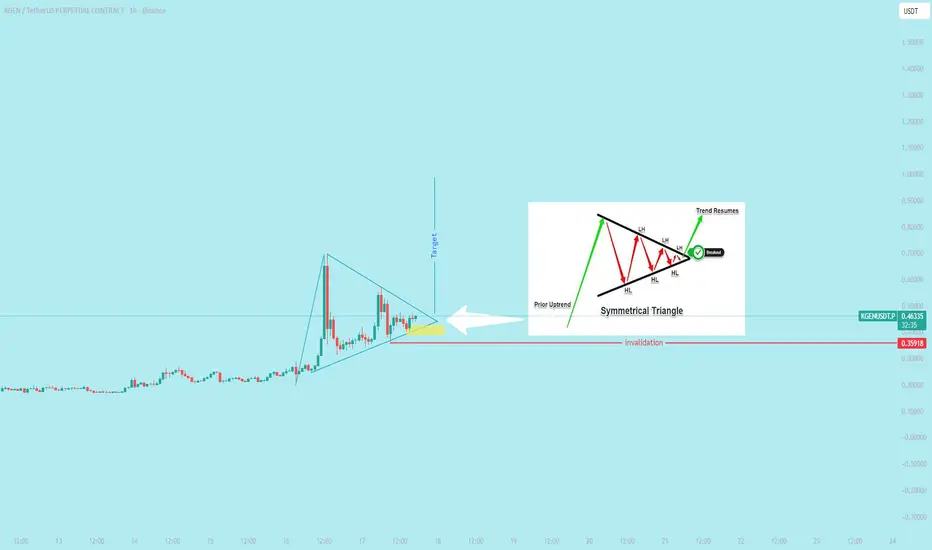
$KGEN Performing a symmetrical triangleA bullish symmetrical triangle is a continuation pattern that signals a potential resumption of an uptrend. The pattern forms during a period of market indecision, where the price consolidates between a descending upper trendline and an ascending lower trendline. A confirmed breakout above the upper trendline suggests that buyers have regained control and the upward momentum is likely to continue.
$BTC - The Correction Structure...! 10/17/2025
Bitcoin ( CRYPTOCAP:BTC ) is likely to extend its decline to complete the wave Y (Red) structure, targeting one of the wave Z (Blue) levels at $102,300 or the extended $93,700.
The decline reached $103,516 today! Is this it! if we considered slight truncation here and there at the endpoints of the structure segments then it's possible to satisfy Z=W probability (in Blue) but that remains to be verified at lower time frames.
Overall, wave Y is most likely the last segment of major correction pattern (Red WXY) and represents an ascending corrective setup characterized by its complex structure (Blue WXYXZ) and directional shifts, which set the stage for significant distribution and a major selling zone near the peak.
The worst-case scenario occurs if the wave Y structure range (in Blue) matches the size of wave W (in Red), pegged at $93,700.
Traders should monitor these levels closely for potential reversal signals and prepare for increased volatility as the pattern unfolds.
Happy Trading! 😎

TradeCityPro | Bitcoin Daily Analysis #199👋 Welcome to TradeCity Pro!
Let's move on to the Bitcoin analysis—finally, the support zone that Bitcoin had has been broken. Let’s review what has happened in the market.
⏳ 1-Hour Timeframe
Yesterday, Bitcoin was in a consolidation range between 110,420 and 111,714.
✔️ Bearish signals, such as Dow Theory structure and high volume on bearish candles, were visible on the chart. Eventually, this led to a break of the consolidation from the bottom, and the support zone was lost.
🔍 After breaking this area, the price retraced and, with a consolidation below 107,790, confirmed the breakdown.
⭐ Currently, the price is at 104,483 and has reacted to it. The RSI oscillator has also reacted to its support area at 22.19 and has been holding near this support for several candles.
📉 If the price continues to drop, this 104,483 level serves as a suitable trigger for the next entry point. Breaking this level could push the price toward the next support zones.
🔔 However, if the price moves upward and fully fakes this drop, a consolidation above 111,714 would confirm a bullish reversal for Bitcoin, allowing us to open long positions with much higher momentum.
💡 I personally opened a short position at the break of 110,420 and am not taking profit yet because it’s a good entry point. In the future, if the market drops, it will provide strong support for subsequent positions.
💥 If the market moves upward and this short gets stopped, strong bullish momentum will enter, making the long positions we open in the next leg very attractive.
❌ Disclaimer ❌
Trading futures is highly risky and dangerous. If you're not an expert, these triggers may not be suitable for you. You should first learn risk and capital management. You can also use the educational content from this channel.
Finally, these triggers reflect my personal opinions on price action, and the market may move completely against this analysis. So, do your own research before opening any position.

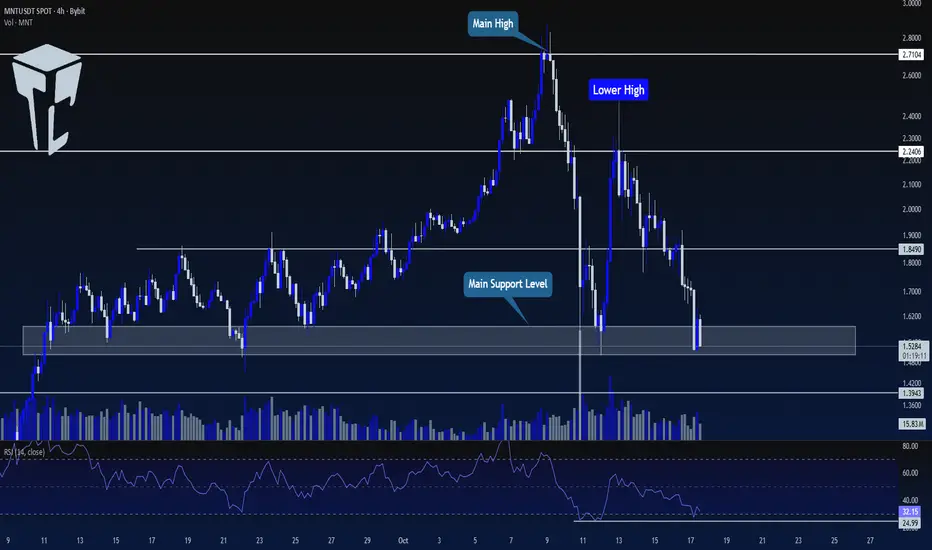
TradeCityPro | MNT: Key Support Holds for Now👋 Welcome to TradeCity Pro!
In this analysis, I want to review the MNT coin for you. One of the most well-known Ethereum Layer 2 projects, with a market cap of $5.03 billion, ranked 26th on CoinMarketCap.
⏳ 4-Hour Timeframe
On the 4-hour chart, after an upward trend, this coin reached 2.7104 and has now entered a corrective and bearish phase.
✨ There is a very important support zone around 1.5. The price has reacted to it once, formed a lower high, and is now back on support.
💥 The RSI oscillator is near the Oversell area. Breaking 24.99 will push the RSI into Oversell.
✔️ For short positions, we can enter on a break of this range. However, since the higher timeframe trend is bullish, we should also consider confirmation from volume, RSI, and Bitcoin.
🔍 For long positions, we need to wait until the market structure creates a proper trigger for a long. Currently, the main confirmation for bullishness is a break of 2.2406.
📝 Final Thoughts
Stay calm, trade wisely, and let's capture the market's best opportunities!
This analysis reflects our opinions and is not financial advice.
Share your thoughts in the comments, and don’t forget to share this analysis with your friends! ❤️
Ethereum Key Buy Zones 💠 Ethereum (ETH/USD) – Key Buy Zones Ahead
ETH is showing a major rejection from the same price zone that has only been tested twice in history — near the $4,000–$4,100 resistance area (highlighted in circles). Both previous visits led to sharp corrections, making this a historically strong resistance zone.
⸻
🔹 Current View
• ETH rejected the $4,000–$4,100 zone — same level as the 2021 top.
• Price is now trading around $3,770, below the 50 & 100 SMAs, signaling short-term weakness.
• The RSI is trending down from mid-levels, suggesting more room for a correction before a potential bounce.
⸻
🔹 Buy Targets
• First Buy Target: $2,590
• Second Buy Target: $2,160
• Third Buy Target: $1,715
These levels line up with strong historical support zones and key moving averages, ideal areas to start accumulating if ETH continues to pull back.
⸻
🔹 Outlook
The long-term structure for Ethereum remains bullish, but a deeper correction could provide much better risk-reward entries for the next cycle.
My plan: accumulate gradually at the marked levels, focusing on patience and strong technical confirmation.
⸻
🧠 “Smart investors don’t chase green candles — they buy when fear returns.”
📜 Disclaimer : This is general information only and not financial advice. Always do your own research before investing.

BTCUSD; Heikin Ashi Trade IdeaLast time we had big divergence on MACD and weekly TF, we had big correction...

BNB: The Party's Over. Here's the Short Setup.Yo.
Quick-fire analysis on BNB/USDT, looking across the M15 to H4 timeframes. The market gave us a technical bounce, a relief rally for the amateurs. Don't be fooled. The party is over, and the bears are now in control.
The Setup
Let's recap the recent chaos. After last Friday's mass liquidation event, BNB staged an absurd rally, tapping a new ATH around 1375 within three days. Hope you survived the volatility. That move, however, was pure euphoria, completely detached from the broader market reality.
While BNB was flying, BTC showed extreme weakness, failing to reclaim any meaningful levels. This divergence was a massive red flag. It was inevitable that BNB's gravity-defying move would correct, and correct hard.
My setup is classic, no-nonsense technical analysis: multi-timeframe Fibonacci levels, a hard focus on volume profile, and a tactical eye on order flow. The blue Fib levels are drawn on the H4 chart (macro trend), and the red Fibs are for the M15 chart (micro trend since the Friday low).
What's Happening Now
The chart is screaming "SELL" at a major point of technical confluence. For anyone who can read price action, this is crystal clear.
After a first test yesterday, the critical 0.618 Fibonacci support on the H4 timeframe was decisively broken today, October 17th. This wasn't just any Fib level; it was perfectly aligned with the Point of Control (POC) from the entire last uptrend—the area with the highest traded volume. Losing this level means the bulls have lost their single most important line of defense. The structure is broken.
The Levels That Matter
We've already hit our first target at 1022, which corresponds perfectly to the 1.272 Fibonacci extension from the H4 structure. The playbook from here is simple. We are now watching for a pullback to reload short positions.
- Short Entry Zone: I'm watching for a weak pullback into the 1093 zone. This area represents the '1' point of the H4 Fib retracement and is the ideal spot to the bag. Any bounce to this level that shows signs of exhaustion is a gift.
- Invalidation (Stop Loss): The line in the sand is a clean break and hold above 1125. A move above this level would negate the current bearish market structure and signal that the downtrend is compromised.
- Targets: I’m reaching two price
- The 1.414 Fibonacci extension, which brings us to the $988 area.
- A full leg down to the 1.272 extension on the M15 Fib, targeting the $865 region. This level also aligns with the previous major low, making it a powerful magnet for price.
I'm not betting on hope; I'm trading the evidence. The evidence shows the path of least resistance is down. Let's see how it plays out. As always, don't get rekt.

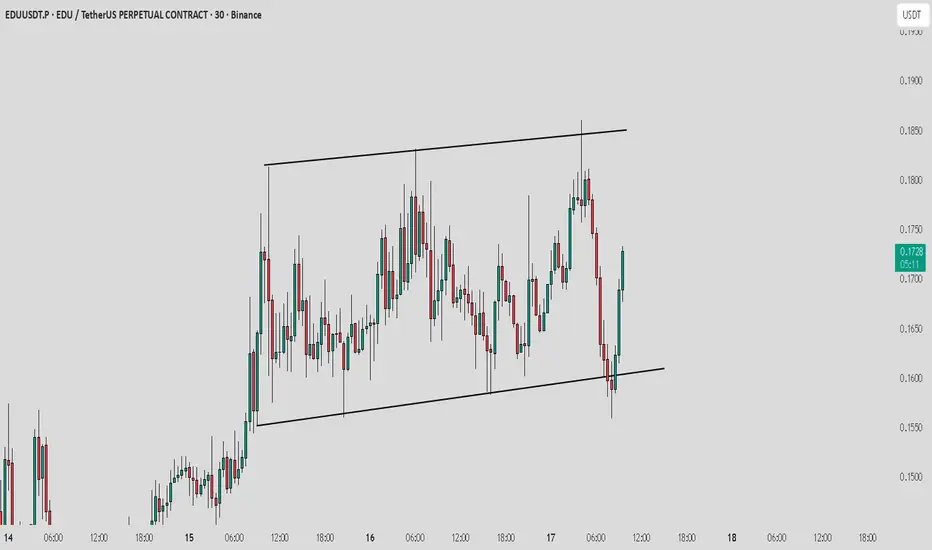
EDU /USDT consolidating in range_Watch for breakout or breakdownEDU is currently trading within a clear horizontal range. After rebounding strongly from the lower support zone, price is now moving upward toward the range resistance.
Bullish Scenario: If EDU breaks and holds above the upper boundary, it could trigger a breakout rally.
Bearish Scenario: A rejection from resistance may lead to another retest of the range support.
Always wait for confirmation before entering and manage risk wisely.
Bitcoin Short-Term Update – October 17, 2025-The short trigger from yesterday has been triggered, and the market is currently moving in favor of the bearish scenario.
At this stage, the downside momentum remains strong, making it reasonable to keep short positions open, provided you manage your risk carefully and adjust stops appropriately.
-However, it’s important to remain prepared for a potential V-shaped reversal.
If such a pattern forms, it would signal a sudden shift in momentum, and we would need to flip our bias toward long positions.
-This is particularly relevant because our long-term trend is still bullish, meaning any corrective move could be temporary.
While the short-term setup favors sellers for now, flexibility and vigilance are crucial, as the market could quickly reverse.
For informational purposes only – not financial advice. © DIBAPRISM
Larry D.Kohn

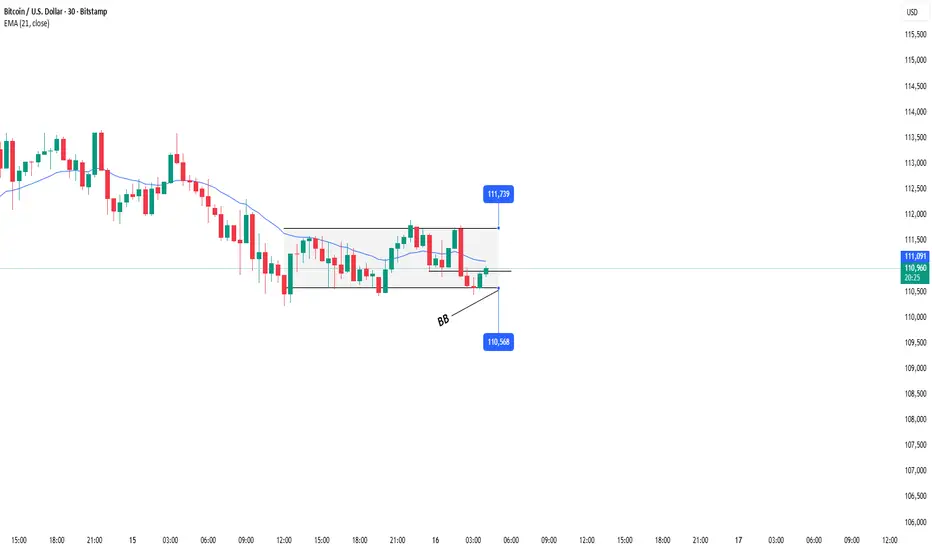
BTCUSD: Short opportunities on technical retrace BITSTAMP:BTCUSD Analysis – October 17, 2025
Yesterday’s short setup (BB) was triggered and hit target as planned.
The main trend remains bearish, confirming that sellers are still in control.
For today, the focus remains on looking for short opportunities following the current downtrend.
Expecting a technical pullback toward the 40%–60% retracement zone of the previous bearish leg.
As price approaches this area and retests the EMA, wait for a clear confirmation signal before entering.
If price fails to follow the setup, stay patient and wait for more confirmation to ensure a safe and disciplined trade.
Main Plan: Keep a bearish bias — look for shorts near the 40–60% retracement zone once confirmation appears.
Daniel Miller @ ZuperView

BTCUSD: Sideways in a block, looking for setup🧭 BITSTAMP:BTCUSD analysis – October 16, 2025
Currently, BITSTAMP:BTCUSD remains in a broader downtrend, so for today’s session, our main focus will be on looking for short (sell) opportunities, rather than counter-trend buys.
I’m using the 30-minute timeframe (M30) for today’s setup.
At the moment, BTC price action is quite complex — moving sideways within a block structure and has recently retested the resistance area around 110,904.
The plan for today is to wait for solid accumulation and a clear BreakBlock (BB) setup to confirm continuation to the downside.
Once a valid setup forms, we can look for short entries following the main trend, with strict risk management and flexible profit targets depending on market volatility.
Alternative Scenario:
If price breaks above the current range, we’ll stay patient and wait for clearer signals before entering any trades.
This approach helps us avoid FOMO and stay disciplined, ensuring all trades align with our predefined plan and market structure.
Daniel Miller @ ZuperView
Stop!Loss|Market View: BTCUSD🙌 Stop!Loss team welcomes you❗️
In this post, we're going to talk about the near-term outlook for the BTCUSD ☝️
Potential trade setup:
🔔Entry level: 107,294.21
💰TP: 99,296.41
⛔️SL: 113,888.88
"Market View" - a brief analysis of trading instruments, covering the most important aspects of the FOREX market.
👇 In the comments 👇 you can type the trading instrument you'd like to analyze, and we'll talk about it in our next posts.
💬 Description: Given the technical accumulation of the price near the lower border of the accumulation area 110,500 - 121,810, as well as a decline in open interest in the BTC futures market (medium- to long-term picture), a breakout of the lower border of the indicated accumulation area is expected. The key target is near 100,000, with a further decline to 90,000 expected.
Thanks for your support 🚀
Profits for all ✅
❗️ Updates on this idea can be found below 👇

Bearish momentum to extend?Bitcoin (BTC/USD) is rising towards the pivot and could reverse to the 1st support.
Pivot: 109,846.88
1st Support: 105,491.44
1st Resistance: 113,040.57
Disclaimer:
The above opinions given constitute general market commentary, and do not constitute the opinion or advice of IC Markets or any form of personal or investment advice.
Any opinions, news, research, analyses, prices, other information, or links to third-party sites contained on this website are provided on an "as-is" basis, are intended only to be informative, is not an advice nor a recommendation, nor research, or a record of our trading prices, or an offer of, or solicitation for a transaction in any financial instrument and thus should not be treated as such. The information provided does not involve any specific investment objectives, financial situation and needs of any specific person who may receive it. Please be aware, that past performance is not a reliable indicator of future performance and/or results. Past Performance or Forward-looking scenarios based upon the reasonable beliefs of the third-party provider are not a guarantee of future performance. Actual results may differ materially from those anticipated in forward-looking or past performance statements. IC Markets makes no representation or warranty and assumes no liability as to the accuracy or completeness of the information provided, nor any loss arising from any investment based on a recommendation, forecast or any information supplied by any third-party.
