100% Win Rate Trade For SHIB Coming Soon!I'm currently observing a potential trading setup in SHIB/USD that mirrors historical patterns we've analyzed. A review of six similar past movements provides us with a data-driven framework for what we might expect.
Historical Performance Snapshot:
• Back testing Win Rate: 100% (6 out of 6 historical setups resulted in upward moves)
• Average Gain: 66.50%
• Average Duration: 46 days
Key Statistical Insights:
• Duration Consistency: The duration of these movements has been moderately consistent, with a standard deviation of just 9.5 days. This suggests a typical timeframe of 36-56 days for a move to play out.
• Gain Variability: It is crucial to note that the gains have been highly variable, with a standard deviation of 30.82%. Past movements have ranged from a 42% gain to as high as 125%.
Back testing Results: It's worth noting that our back testing of this setup shows a 100% win rate across all six historical instances. Every time this pattern has appeared, it has resulted in an upward move. However, while the direction has been consistent, the magnitude of gains has varied significantly.
Interpretation: While the timing of these upward trends has been relatively predictable, the magnitude of the final gain is not. This means that while a move could last approximately a month and a half, the profit potential has a wide range of outcomes.
My Approach: Given the high variability in gains, I'll be watching this setup with a focus on risk management. Setting flexible profit targets and a clear invalidation level is key. This is not financial advice, but an observation based on statistical analysis. Please conduct your own research and manage your risk accordingly.
I will update once the buy signal is in and then once the closing signal appears.
Unfortunately I can not use the other RSI I normally use as its been updated and I am not allowed to upload it due to Trading View rules. The Stochastic RSI is the closest thing I could find to it for now or that allows me to give a visual representation of the trade.
Have a blessed week ahead!
COINBASE:SHIBUSD BINANCE:SHIBUSDT
Cryptomarket

EtHUSD M30 | Bullish Bounce Off Key SupportETH/USD has bounced off the buy entry, which is a pullback support that aligns with the 50% Fibonacci retracement and could potentially rise from this level to the upside.
Buy entry is at 787.96, which is a pullback support that aligns with the 50% Fibonacci retracement
Stop loss is at 3,679.04, which is a swing low support.
Take profit is at 3,4.94, which his an overlap resistance that is slightly above the 40% Fibonacci retracement.
Stratos Markets Limited (tradu.com ):
CFDs are complex instruments and come with a high risk of losing money rapidly due to leverage. 68% of retail investor accounts lose money when trading CFDs with this provider. You should consider whether you understand how CFDs work and whether you can afford to take the high risk of losing your money.
Stratos Europe Ltd (tradu.com ):
CFDs are complex instruments and come with a high risk of losing money rapidly due to leverage. 70% of retail investor accounts lose money when trading CFDs with this provider. You should consider whether you understand how CFDs work and whether you can afford to take the high risk of losing your money.

BTCUSD H1 | Bearish Reversal at Pullback ResistanceBTC/USD is rising towards the sell entry, which is a pullback resistance that lines up with the 50% Fibonacci retracement and could reverse from this level to the downside.
Sell entry is at 111,22.96, which is a pullback resistance that lines up with the 50% Fibonacci retracement
Stop loss is at 113,549.46, whic is a pullback resistance that is slightly below the 78.6% Fibonacci retracement.
Take profit is at 106,29.13, which is a multi swing low support.
Stratos Markets Limited (tradu.com ):
CFDs are complex instruments and come with a high risk of losing money rapidly due to leverage. 68% of retail investor accounts lose money when trading CFDs with this provider. You should consider whether you understand how CFDs work and whether you can afford to take the high risk of losing your money.
Stratos Europe Ltd (tradu.com ):
CFDs are complex instruments and come with a high risk of losing money rapidly due to leverage. 70% of retail investor accounts lose money when trading CFDs with this provider. You should consider whether you understand how CFDs work and whether you can afford to take the high risk of losing your money.

BNBUSD H4 | Price Drop-Off Signals Bearish ContinuationBNB?USD is rising towards the sell entry, which is an overlap resistance that lines up with the 38.2% Fibonacci retracement and could drop from this level to the downside.
Sell entry is at 1,089.90, whic is an overlap resistance that lines up with the 38.2% Fibonacci retracement.
Stop loss is at 1,136.97, whic is a pullback resistance that is slightly above the 61.8% Fibonacci retracement.
Take profit is at 1,021.35, whic is an overlap support.
Stratos Markets Limited (tradu.com ):
CFDs are complex instruments and come with a high risk of losing money rapidly due to leverage. 68% of retail investor accounts lose money when trading CFDs with this provider. You should consider whether you understand how CFDs work and whether you can afford to take the high risk of losing your money.
Stratos Europe Ltd (tradu.com ):
CFDs are complex instruments and come with a high risk of losing money rapidly due to leverage. 70% of retail investor accounts lose money when trading CFDs with this provider. You should consider whether you understand how CFDs work and whether you can afford to take the high risk of losing your money.

BCHUSD H | Bearish Reversal DevelopingBCH/USD has rejected off the sell entry, which is a pullback resistance that is slightly below the 78.6% Fibonacci retracement and could drop from this level to the take profit.
Sell entry is at 566.81, which is a pullback resistance that is slightly below the 78.6% Fibonacci retracement.
Stop loss is at 611.6, which is a pullback resistance.
Take profit is at 507.42, which is a pullback support that aligns with the 61.8% Fibonacci retracement.
Stratos Markets Limited (tradu.com ):
CFDs are complex instruments and come with a high risk of losing money rapidly due to leverage. 68% of retail investor accounts lose money when trading CFDs with this provider. You should consider whether you understand how CFDs work and whether you can afford to take the high risk of losing your money.
Stratos Europe Ltd (tradu.com ):
CFDs are complex instruments and come with a high risk of losing money rapidly due to leverage. 70% of retail investor accounts lose money when trading CFDs with this provider. You should consider whether you understand how CFDs work and whether you can afford to take the high risk of losing your money.

Bullish bounce off?The Bitcoin (BTC/USD) has bounced off the pivot, which is a multi-swing low support, and could rise to the 1st resistance.
Pivot: 197,582.22
1st Support: 191,969.5
1st Resistance: 17,384.29
Disclaimer:
The above opinions given constitute general market commentary, and do not constitute the opinion or advice of IC Markets or any form of personal or investment advice.
Any opinions, news, research, analyses, prices, other information, or links to third-party sites contained on this website are provided on an "as-is" basis, are intended only to be informative, is not an advice nor a recommendation, nor research, or a record of our trading prices, or an offer of, or solicitation for a transaction in any financial instrument and thus should not be treated as such. The information provided does not involve any specific investment objectives, financial situation and needs of any specific person who may receive it. Please be aware, that past performance is not a reliable indicator of future performance and/or results. Past Performance or Forward-looking scenarios based upon the reasonable beliefs of the third-party provider are not a guarantee of future performance. Actual results may differ materially from those anticipated in forward-looking or past performance statements. IC Markets makes no representation or warranty and assumes no liability as to the accuracy or completeness of the information provided, nor any loss arising from any investment based on a recommendation, forecast or any information supplied by any third-party.

ETH Weakening Near Support, Big Move Loading?CRYPTOCAP:ETH is currently trading near a key support zone, which has held strong multiple times in the past. The price has been consolidating between this support and the mid S/R zone, showing that both bulls and bears are battling for control.
If ETH manages to break and sustain above the mid S/R zone, we could see a potential upside continuation toward higher levels. However, if the price fails to hold this key support and closes below it, a deeper correction toward the lower support zone could be on the table.
For now, ETH looks weaker day by day, so it’s important to keep a close eye on how the price reacts around this zone, a decisive move could set the tone for the next big trend.
DYOR, NFA

TradeCityPro | Bitcoin Daily Analysis #208👋 Welcome to TradeCity Pro!
Let's take a look at Bitcoin's analysis — the market is still ranging.
⏱ 1-Hour Timeframe
In the 1-hour timeframe, Bitcoin is still below the 111365 level. Today, it moved close to this level once, but it is currently still trading below it.
⛏ Good buying volume has entered the market, while the volume of red candles has been decreasing. In case 111365 is broken, we can open a long position.
🧮 If the price gets rejected from this level, the first short trigger we have is 108844. The next support levels are 107486 and 106319.
📊 Overall, I still believe that as long as the price is between 106319 and 115808, the market movements are temporary and not very exciting. As long as the price stays in this zone, I will open short-term positions and take profit quickly.
❌ Disclaimer ❌
Trading futures is highly risky and dangerous. If you're not an expert, these triggers may not be suitable for you. You should first learn risk and capital management. You can also use the educational content from this channel.
Finally, these triggers reflect my personal opinions on price action, and the market may move completely against this analysis. So, do your own research before opening any position.

USDT.D – 4H Technical OutlookUSDT.D – 4H Technical Outlook (Nov 2, 2025)
📊 Market Structure:
USDT Dominance remains in a medium-term bearish structure, forming a clear Lower High (LH) around the 5.20–5.25% premium zone.
Recently, the market printed a bullish CHoCH after bouncing from the 4.75% swing low, but price is now facing strong resistance near 5.00–5.05%, aligned with the 89 EMA and a prior liquidity zone.
Overall, the structure remains bearish-biased, with the current move likely a corrective retracement within the broader downtrend.
📈 Key Levels:
Resistance Zone (Premium / Supply Zone): 5.20 – 5.25%
Current Reaction Zone: 5.00 – 5.05%
Support Zone (Discount / Demand Zone): 4.75 – 4.80%
⚙️ EMA Confluence:
The 89 EMA (blue) sits just above current price, acting as dynamic resistance.
The 200 EMA (yellow) lies below, around 4.75%, serving as major support.
➡️ Both EMAs confirm that the dominant trend remains bearish, with price currently in a technical pullback phase.
📉 Momentum (Stochastic RSI):
The Stochastic RSI is slightly turning upward from the mid-zone (40–60%), signaling weak bullish correction momentum.
No overbought signals yet, suggesting that price may still test 5.05% before resuming the downside move.
🎯 Trading Scenarios:
Scenario 1 – Sell (Trend Continuation)
Entry: 5.00 – 5.05% (EMA89 retest / resistance zone)
Stop Loss: 5.10%
Take Profit: 4.85% → 4.75%
Confluence: EMA rejection + bearish structure + weakening momentum
Scenario 2 – Buy (Reversal Confirmation Only)
Entry: 5.10 – 5.15% (after clear breakout & retest)
Stop Loss: 5.00%
Take Profit: 5.20 – 5.25%
Confluence: Break of structure + EMA breakout + strong bullish confirmation
💡 Summary Insight:
USDT Dominance is currently in a corrective phase within a broader downtrend.
A rejection from 5.05% could lead to continuation toward 4.85–4.75%, which would support a bullish move in BTC and altcoins.
Only a confirmed 4H candle close above 5.10% would shift short-term momentum to bullish and add downside pressure to crypto prices.

BTC/USDT – 4H Technical OutlookBTC/USDT – 4H Technical Outlook
📊 Market Structure:
Bitcoin recently experienced a bearish shift in structure (CHoCH + BOS to the downside) after being rejected from the premium zone around 115,000.
After forming a strong swing low near 108,000, the market rebounded and printed a higher low, suggesting short-term bullish correction within an overall bearish context.
Currently, price is testing the EMA confluence zone near 111,000, which is acting as short-term resistance.
📈 Key Levels:
Resistance Zone (Equilibrium / Supply Zone): 113,500 – 115,000
Current Reaction Zone: 110,500 – 111,500
Support Zone: 108,000 – 109,000
⚙️ EMA Confluence:
The 89 EMA (blue) and 200 EMA (yellow) are both positioned above current price, confirming a bearish market structure.
Price is now testing the 89 EMA from below — a typical retracement area before continuation down.
📉 Momentum (Stochastic RSI):
The Stochastic RSI has turned down sharply from the overbought zone, indicating decreasing bullish momentum and possible continuation of the downtrend.
🎯 Trading Scenarios:
Scenario 1 – Sell (Trend Continuation)
Entry: 110,800 – 111,500 (retest of EMA zone)
Stop Loss: 113,000
Take Profit: 108,000 → 107,000
Confluence: EMA rejection + bearish structure + RSI reversal from overbought
Scenario 2 – Buy (Reversal Confirmation Only)
Entry: 113,500 – 114,000 (after clear breakout & retest)
Stop Loss: 112,500
Take Profit: 115,000 → 116,000
Confluence: Break above 89/200 EMA + BOS confirmation
💡 Summary Insight:
BTC/USDT remains bearish-biased below 111,500–113,500.
Expect a possible retest of EMA resistance before continuation toward 108,000.
Only a strong 4H candle close above 113,500 would shift momentum to bullish.

ZKUSDT - Don't waste this opportunity!Did you know that ZK dropped more than 98.5% from its peak in December 2024 until October 10, 2025?
If you can’t imagine what that means, let me explain:
Coins that experience such a massive drop usually get delisted and die off—they rarely recover.
But ZK surged over 1,300% from its October 10 bottom in less than 23 days and is now about to break a major resistance at the 0.618 Fibonacci level.
And I want to point out something:
ZEC and ZK sound similar, and even their letters resemble each other—definitely a hint at the market makers’ codes.
Best Regards:
Ceciliones🎯


SOLANA HIGH PROBABILITY SETUPS SOON!!!🚨 SOL HIGH PROBABILITY SELL/BUY SETUP 🚨
* Here We Can See Clearly The Next Potential Moves For SOLUSD Coming Hours/Days.
* Keep Your Eyes Close On Your Trading Positions.
* Happy PIP Hunting Traders.
FXKILLA.

TradeCityPro | Bitcoin Daily Analysis #207👋 Welcome to TradeCity Pro!
After a short break, let's get back to the daily Bitcoin analysis. The market is still in a very large range box.
⏳ 1-Hour Timeframe
Currently, Bitcoin is recovering after the drop to the 106319 level and has moved up to 110803.
✅ Today is Saturday, and as you can see, the market volume has dropped significantly. It seems that the market may range until tomorrow afternoon and won't move much upwards, with the main movement starting next week.
⚡️ The triggers we have for opening positions right now are:
For long: 110803
For short: 108844 and 106319
💥 Overall, Bitcoin is in a very large range box between 106319 and 115808, and as long as the price stays between these two levels, I will open my positions with very low risk.
❌ Disclaimer ❌
Trading futures is highly risky and dangerous. If you're not an expert, these triggers may not be suitable for you. You should first learn risk and capital management. You can also use the educational content from this channel.
Finally, these triggers reflect my personal opinions on price action, and the market may move completely against this analysis. So, do your own research before opening any position.

ETHEREUM HIGH PROBABILITY SETUP SOON!!!🚨 ETHER HIGH PROBABILITY SELL/BUY SETUP 🚨
* Here We Can See Clearly The Next Potential Moves For ETHUSD Coming Hours/Days.
* Keep Your Eyes Close On Your Trading Positions.
* Happy PIP Hunting Traders.
FXKILLA.

BITCOIN HIGH PROBABILITY SETUP SOON!!!🚨 BTC HIGH PROBABILITY SELL/BUY SETUPS 🚨
* Here We Can See Clearly The Next Potential Moves For BTCUSD Coming Hours/Days.
* Keep Your Eyes Close On Your Trading Positions.
* Happy PIP Hunting Traders.
FXKILLA.

Bitcoin Monthly Candle colour Close since 2011- Looking GOODOCTOBER CLOSED RED
October closed RED for the 5th time in Bitcoin History.
On 3 occasions, it was in a BEAR market, Once was in a Bull Run, in 2012 and the one that just closed Red,
We have to wait and see how things unfold from here.
Is this the End of this Bull run ?
Many will say so and this could be supported by the information above. The Majority of RED Octobers are in Bear markets.
Lets look closer
The left Box shows the only similar monthly Candle sequence, similar to the one we currently have. If you look closely, it is also a very similar "Curve" shape. Descent to low, rise, flatten out.
The Candle Sequence to see is Red, Green. 2 Red. 4 Green, 1 red, 1 Green
That Sequence was followed by a RED Candle, which we have just also done.
The Thin down facing arrow in the left Box, points to the equvilant candle to the one we just had.
The difference being when this happened.it was in Different months. the left box starting in September 2022.
IT WAS THE END OF THE 2022 BEAR market.....
The first Red candle in the current sequence was in December 2024
Some say we have entered a mini Bear a few months ago.......with long term holders selling coins, as is generally accepted as end of cycle action.
But these Coins all got bought right back up....Demand still exists.
The Large Green candle after the Red, Green. 2 Red at the start, in the left box , was January 2023, when we began this current "Cycle". The Bull Run.
Could we be about to see a repeat of this ?
But firstly, If we continur to follow this, we can expect a RED NOVEMBER !
But December will be Green and January would be EPIC, similar to the January 2023 Candle.......MAYBE
But this is all Hyposthosis.
The FACTS are :-
Looking ahead-->
Previous NOVEMBER Candle Closes
9 Green to 5 Red - Nearly twice as many Green as Red.
Only One Green November was in a Bear, November 2014.
The Red November in 2011 was the bottom and was the start of Bitcoins 2 year push to ATH.
The Red one in November 2022 marked the Bottom of the Bear, though December was red but a small candle.
Nearly half of the Red Novembers called the Bottom of a Bear, a turning point in market behaviour.
Some charts point to a RED start to November and the Red close fpr October certainly does not point towards a continued Bullish Sentiment.
I do not often point to TA in these month charts But the MACD will be reaching Neutral on Weekly charts by nid / late December.
To me, this points towards the time when Bitcoin has the ideal moment to push to a real New ATH. This could therefore point towards a Red November and then a Green December.... which follows the Sequence mentioned above.
But this is Bitcoin, it is its own Boss.
We have to wait..time will tell but I reman VERY Bullish

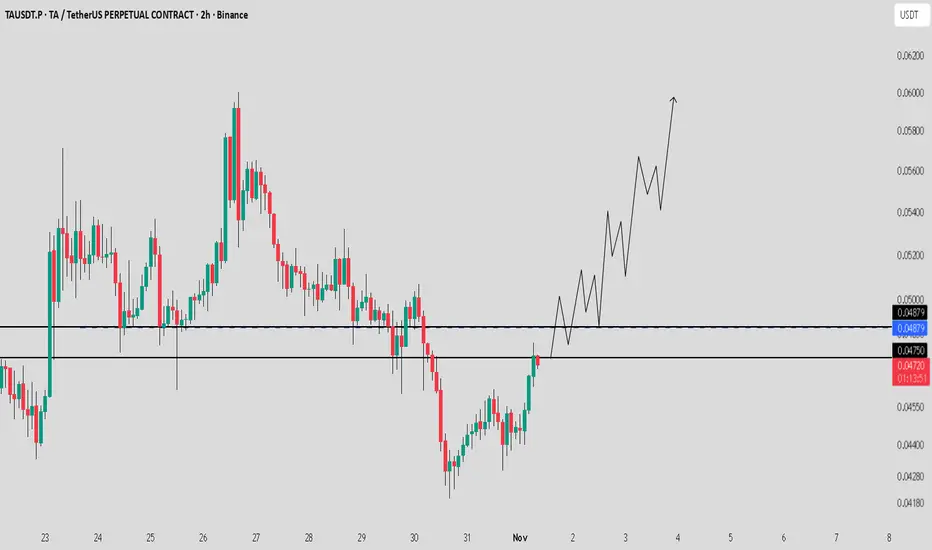
TA / USDT : Breakout setup loading / Target $0.55 - $0.60TA / USDT is showing strength and currently testing a key resistance zone.
If price breaks out with strong momentum, we may see a bullish move toward $0.55 – $0.60.
Manage risk wisely and always wait for clear breakout confirmation before entering.
$btc idea for weekend big range to play ! BTC has big range bounce off at 0.78 fib level
1- bullish : if we can take one level of higher low around 111.7K and change this structure there is change we move higher from here likely sunday pump
2-bearish: if we have slow price action over weekend with slow bleed get below 108.4K we might sweep low of range or touch 0.786 level once again
what you think happen first ?

TAO / USDT gaining momentum- Eyes on $700-$750 zoneTAO is looking strong and showing good momentum for a bullish rally towards the $700 – $750 range in the coming days.
Trend structure remains positive — watch for continuation signals and manage risk wisely.

Bitcoin - The manipulation!On the weekly Bitcoin chart, there’s a clear bearish rising wedge pattern, and right now it’s trading near the lower side of that wedge — getting ready for a downward weekly breakout.
But let me remind you of something important — this will likely be part of a psychological game played by market makers, so remember my words carefully:
- Bitcoin will break down from the wedge, giving a bearish signal, and many traders will enter short positions.
- It’ll even dip slightly below the 50 EMA, making everyone more confident in the bearish move.
- Then, it’ll reverse sharply upward, liquidating all the short positions.
Market makers always make you believe your plan is playing out perfectly — right before they turn against you and take your money.
So stay alert, place your buy orders slightly below the 50 EMA, and avoid using high leverage.
Best Regards:
Ceciliones🎯

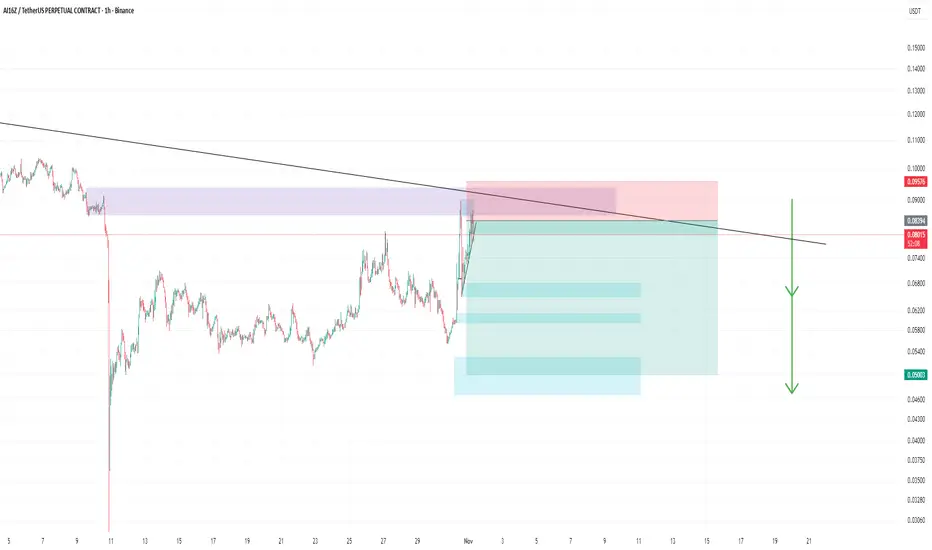
AI16Z shortHello everyone 😍
💁♂️This time we are back with a great position with a setup
I think the AI16Z cryptocurrency can fall to the lower areas
⚠️This is my opinion and please check yours before entering the trade
First target area $0.067
Second target area $0.0602
Last target area $0.052
⚠️The analysis may not reach the final target, so at each target, if you make a good profit and see signs of a trend change, you can exit the trade or manage your capital.
⚠️ None of the analysis is a recommendation to buy or sell, but simply my personal opinions on the charts. You can use the charts and choose any that interest you and take a position if you wish.
To support me, I would appreciate it if you boost the analysis and share it with your friends so that I can analyze it with more energy for you, my dears. Thank you all. 💖
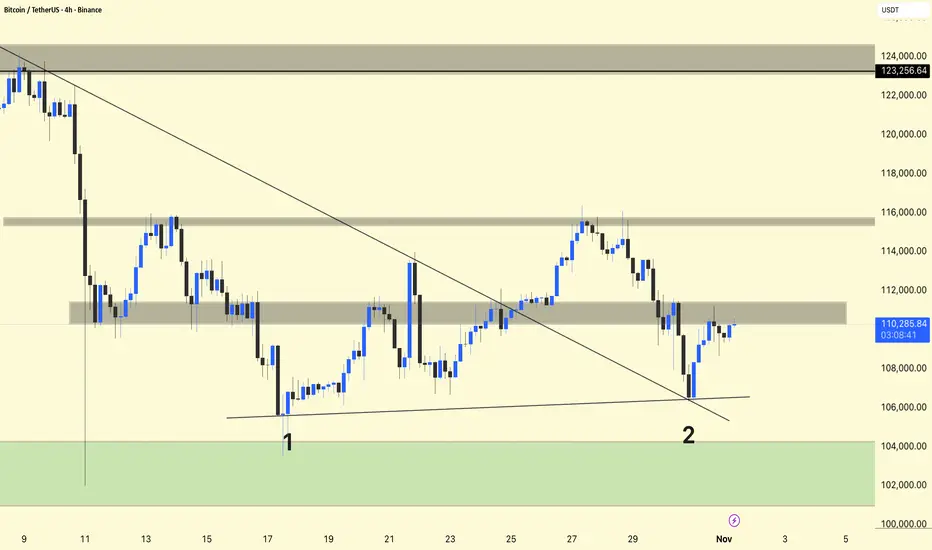
BTC/USDT 4HOUR CHART UPDATE !!BTCUSDT 4-Hour Chart Update and Analysis
Support: BTC has successfully formed two higher lows near $106,000-$107,000 (marked 1 and 2), indicating that the green area remains strong.
Resistance: The price is currently facing resistance near $111,500. This area served as previous support and could now limit short-term upside.
Trend: Price activity is showing stabilization after a pullback and is attempting to reclaim the breakdown level.
Outlook: Sustaining above the trendline and the $109,500-$110,000 range provides bullish support. If resistance is broken, a return to $113,000-$115,000 is targeted.
DYOR | NFA