BITCOIN !!!Hello friends
Given the good decline we had, a good opportunity was provided to buy at good prices with capital and risk management and in steps and move to the specified goals.
There was good liquidity at the bottom that was collected, now we can expect a good growth.
*Trade safely with us*
Cryptomarket

TradeCityPro | Bitcoin Daily Analysis #193👋 Welcome to TradeCity Pro!
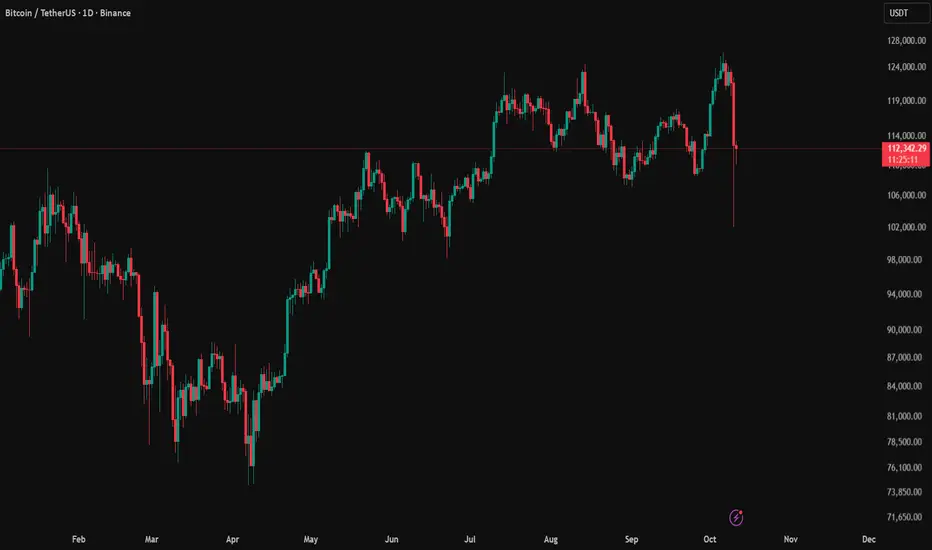
Let’s analyze Bitcoin, yesterday, a phenomenon called a Flash Crash occurred, and the market experienced a massive drop. Let’s review what happened and where the market stands now.
⏳ 4-Hour Timeframe
Before diving into the chart, let’s first understand what happened in the broader market.
🔍 Yesterday, the U.S. restricted the sale of certain computer chips to China,
and in response, China halted exports of five rare elements to the U.S.
📰 Then, the U.S. reimposed heavy tariffs on China, and China raised duties on American ships.
✨ These escalating tensions severely impacted global markets — and we witnessed the largest Flash Crash in Bitcoin’s history.
📉 A total of $19 billion worth of positions were liquidated, marking the highest figure ever recorded in crypto history.
To put that into perspective, during the COVID crash, only about $3 billion was liquidated — a massive difference.
🔔 Interestingly, Bitcoin dropped less compared to most altcoins and managed to recover partially.
However, altcoins like TON, AVAX, ARB, and SUI (each with their own networks) saw brutal crashes, many with wicks of 60–70% downward.
📊 Now, looking at the chart, yesterday, Bitcoin was ranging above the $120,835 zone.
🧮 Once the geopolitical tension began, the price started a strong downward move, breaking below its key support.
🔽 After two large red candles and a close below support, the third candle formed a 12% wick, dropping as low as $102,000.
✔️ Following that, the price quickly recovered and is now consolidating above the $109,000 support zone.
💡 At the moment, in such a highly volatile environment, finding valid triggers and opening new positions isn’t ideal.
🔑 The price action has been driven mostly by news and panic, so it’s best to wait until the market stabilizes and the effects of these developments fade away.
❌ Disclaimer ❌
Trading futures is highly risky and dangerous. If you're not an expert, these triggers may not be suitable for you. You should first learn risk and capital management. You can also use the educational content from this channel.
Finally, these triggers reflect my personal opinions on price action, and the market may move completely against this analysis. So, do your own research before opening any position.

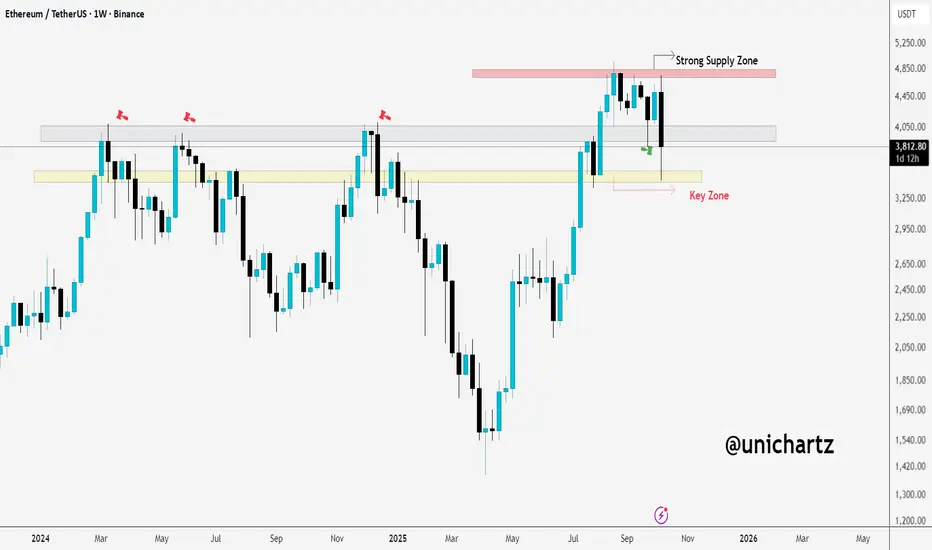
ETH in Danger: Breaking Below $3,200 Could Signal Bigger DropCRYPTOCAP:ETH is facing rejection from the strong supply zone around $4,800. The weekly candle failed to hold above that level and is now pulling back towards the key demand zone between $3,200–$3,300.
If the price fails to reclaim this support, we could see a more bearish scenario unfolding.
DYOR, NFA
Thanks for the reading
Descriptions about the market! Read the caption!Given Mr. Trump's remarks and the unprecedented crash in cryptocurrencies, I must say this individual significantly harms markets, especially investors. Imposing a 100% tariff on Chinese goods essentially means "we want no trade with you," which is fundamentally unfeasible. The United States and China will undoubtedly negotiate. However, our main focus here is the financial market collapse. This decline isn’t merely about falling prices—it goes beyond that. The core issue is the loss of market trust and credibility. Once confidence is broken, it is difficult to restore and may take a long time.
In any case, I felt it was my duty to bring this up and remind you to stay composed. Never forget to use stop-losses in your trades and practice proper capital management.
If needed, you can always message me on this platform for advice.
NOTE: This post is This post is educational.
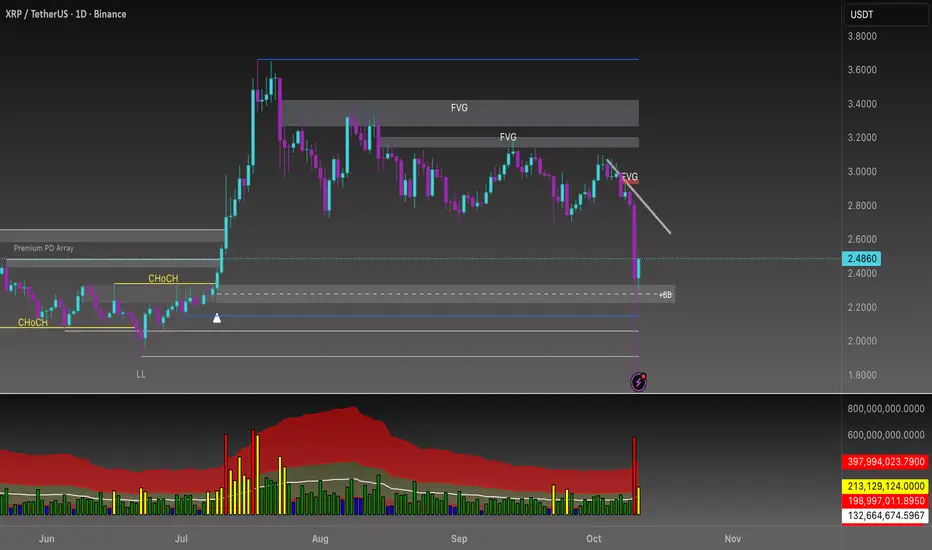
Beyond the Chart - XRP AltCoin Market AnalysisThe trendline I previously drew for BINANCE:XRPUSDT continues to hold strong. 💪
Price has formed a Breaker Block around 2.2900, and I expect a correction toward the trendline 🎯first targeting the 2.7294 area.
XRP’s reaction here will decide the next phase:
• 📈 If a bullish candle closes above the trendline, my next target will be the upper FVG zone.
• 📉 If a bearish candle closes below it, I’ll be watching the 2.3021 area as the next downside target.
TradeCityPro | ENA: Market Shake-Off and Support Rebuild Zone👋 Welcome to TradeCity Pro!
In this analysis, I’ll review ENA, one of the DeFi projects that currently holds a market cap of $3.02 billion, ranking 36th on CoinMarketCap.
📅 Daily Timeframe
First, let’s take a look at the market as a whole — yesterday, some extremely unusual events occurred, which I’ll explain in detail in Bitcoin’s analysis.
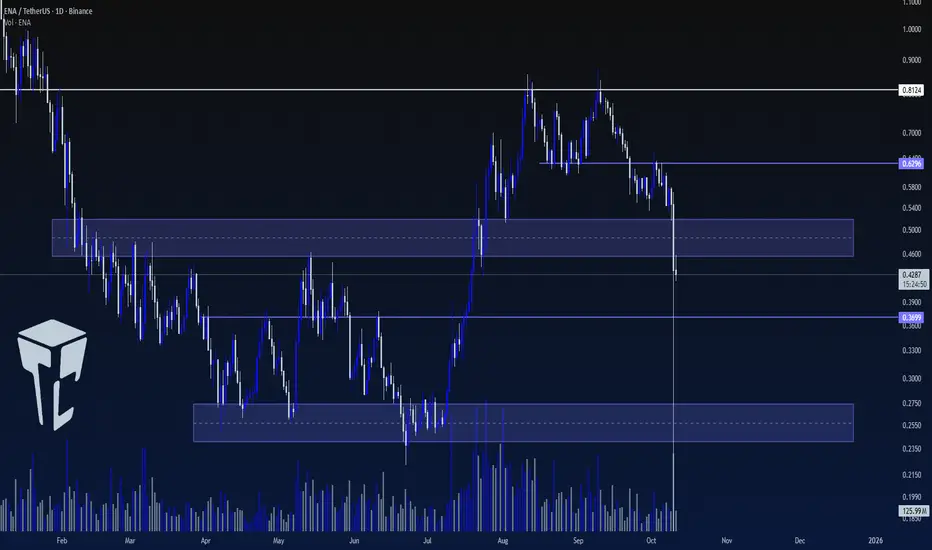
✨ For now, the result of these events has been a sharp market decline, which has also affected this coin. ENA has now stabilized below the $0.5 support zone and printed a very long shadow to much lower levels.
🔍 Currently, the price is far below its last major high at $0.8124 and has formed a lower high at $0.6296.
✔️ There was a support zone around $0.5, but since the price has closed below it, the next key support lies at $0.3699.
📊 The final strong support zone is around $0.25, which is considered ENA’s main support level.
💥 For now, it’s better to stay on the sidelines and wait for the market to build a new structure. The recent move was highly emotional and volatile, making it difficult to accurately interpret the market’s behavior at the moment.
📝 Final Thoughts
Stay calm, trade wisely, and let's capture the market's best opportunities!
This analysis reflects our opinions and is not financial advice.
Share your thoughts in the comments, and don’t forget to share this analysis with your friends! ❤️
DOGE Looks Bearish (1D)We tried to show the waves from a larger perspective so you can have a better understanding of the path.
It seems that wave "B" of the higher-degree correction has been completed (wave B was a bullish phase), and now we are entering wave "C", which is bearish at a higher degree.
With the price pulling back toward the red zone, we can look for sell/short positions.
On the chart, there is a liquidity pool marked with "$$$", and the first target of this bearish move is to sweep that liquidity pool.
A daily candle closing above the invalidation level will invalidate this analysis.
For risk management, please don't forget stop loss and capital management
When we reach the first target, save some profit and then change the stop to entry
Comment if you have any questions
Thank You

Q-USDT SHORT FULL TARGET BOOOOOOM Hello friends 😍😍
💁♂️ Another great analysis
Let's see together a great update of the Q-USDT cryptocurrency that touched all the targets
🔥🔥🔥It fell from a little above the blue area that I specified and then touched all three targets with a 73.5% drop. What's better than this? 🔥🔥🔥
Has anyone used this analysis?
⚠️ None of the analysis is a recommendation to buy or sell, but simply my personal opinions on the charts. You can use the charts and choose any that interest you and take a position if you wish.
To support me, I would appreciate it if you boost the analysis and share it with your friends so that I can analyze it with more energy for you, my dears. Thank you all. 💖

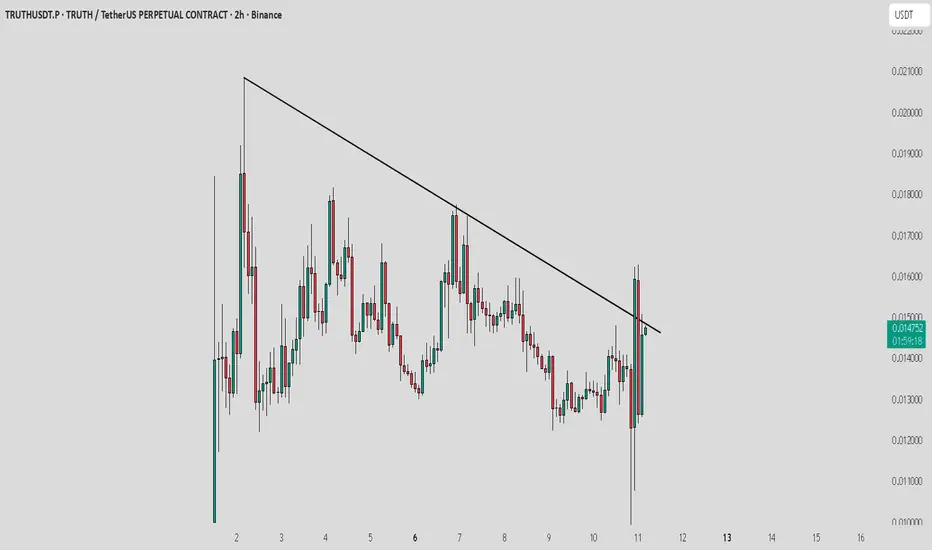
TRUTH / USDT : Showing strength after huge market dumpTRUTH / USDT is showing strength after yesterday’s pullback. If the next candle takes support from the trend line resistance, it could confirm continuation and offer a good profit opportunity.
Keep a close watch and trade with proper risk management.
BTC BREAKING NEWS OR BREAKING CHARTS?📰 BREAKING NEWS OR BREAKING CHARTS?
TRUMP IMPOSES TARIFFS, CAUSING A BITCOIN BLOODBATH — $20,000 DRAWDOWN IN 2 HOURS!
Bitcoin was sitting comfortably at $121,000, before a sudden macro shock — triggered by newly imposed U.S. tariffs — sent prices spiraling down to $100,000 in a matter of hours.
Bulls were liquidated. Bears rejoiced.
Now, the market stands at a crossroads: will this become a major dump continuation, or the foundation for a secret pump?
Chart Overview & Structure
On the high timeframe, BTC continues to trade within a rising wedge formation, with price now showing a significant wick rejection from the upper boundary. This move suggests a potential shift in market structure — a moment that’s likely to shake inexperienced traders. The chart reveals a clear supply and demand structure:
Supply Zone: $123,452 – $130,000
D emand Zone: $98,826 – $101,400
These zones define the battlefield between bulls and bears. In addition, eight psychological levels dominate the chart — $100K, $105K, $110K, $115K, $120K, $125K, and $130K — each representing potential liquidity clusters and reaction points.
Adding to the complexity, we can see a golden pocket (0.618–0.65 retracement) forming around $106,000, perfectly aligning with prior swing lows and the midpoint of a large Fair Value Gap (FVG) overhead. This zone could serve as a reversal or continuation point depending on whether price can reclaim and hold above the major support trendline.
Technical Insights
The market has now tapped the rising wedge resistance three times, with the last tap forming a wick above $125K, triggering liquidity before the sharp collapse. This aligns with the classical exhaustion behavior of wedges. Moreover, a potential Head and Shoulders structure is beginning to emerge, with the right shoulder aligning near $115K — a confluence area that may attract strong bearish attention.
For now, price is testing the lower support trendline — a crucial pivot area for determining whether BTC continues to break down toward demand or consolidates for recovery. This structure creates a make-or-break zone that will define the next macro leg.
Bullish Scenario
Despite the panic, this could be a classic liquidity flush — a “flush candle” event designed to wipe out leveraged long positions before a larger move upward. If BTC can maintain structure above the major support line and close above $106K–$110K, it opens the door for a relief rally.
A reclaim of $115K would confirm buyer strength.
Sustained momentum could push BTC back into the $120K–$125K range to retest the broken supply zone.
Breaking through $125K would invalidate the bearish wedge, potentially igniting a run toward $130K+ and even new highs in “Pump-tober.”
In this scenario, the deep liquidation event becomes fuel for a massive short squeeze, driving momentum and reigniting bullish sentiment across crypto markets.
Bearish Scenario
On the flip side, if BTC fails to hold above $106K or decisively breaks below the demand zone at $98K, it would confirm a rising wedge breakdown.
Below $100K, momentum could accelerate toward $95K–$92K — the next liquidity pools and volume gaps.
The Head and Shoulders completion would confirm the bearish reversal structure, further strengthening the downside case.
Macro sentiment, fueled by geopolitical and policy fears, could add weight to the bearish outlook.
A rejection from $115K without sustained reclaim would also reinforce the bearish continuation pattern, with every psychological level above turning into resistance.
Summary
Bitcoin is at an inflection point — the $100K–$115K range will define the next macro move.
The recent wick and structure breakdown hint at weakness, but the flush candle and liquidity sweep also suggest that a bullish rebound could be on the horizon.
In short:
Above $115K → Bullish continuation possible.
Below $100K → Bearish expansion likely.
With volatility at its peak, traders should expect massive liquidity hunts, fakeouts, and emotional traps on both sides.
Whether this becomes the start of a macro correction or a secret accumulation phase before a major pump — the next few daily closes will tell the story.

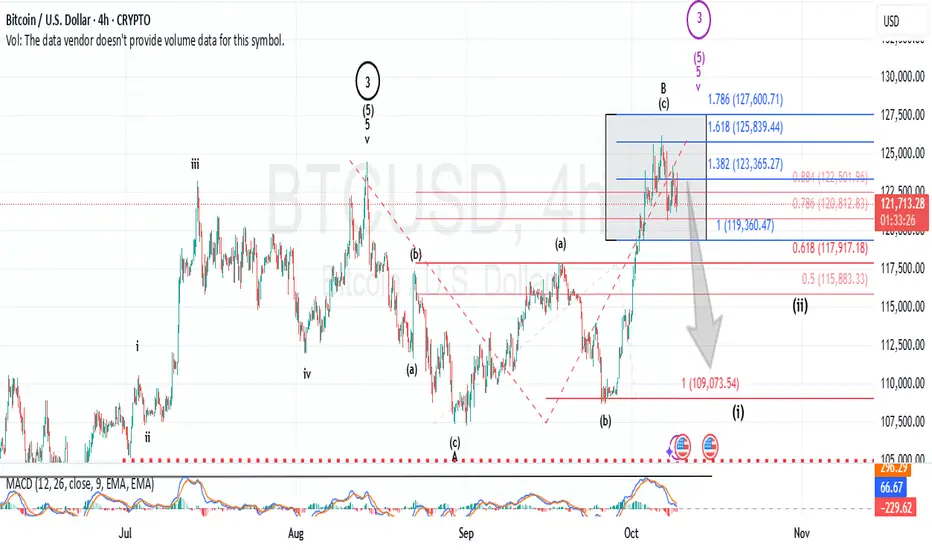
Simple, But NuancedIn my September 20th update titled “Bitcoin Has Appeared to Have Struck a Meaningful Top,” I noted that a top in the premier cryptocurrency was expected and likely imminent. Since that post, however, Bitcoin has reached a new all-time high, moving contrary to that prior expectation.
My interpretation of this updated price action is simple, but nuanced.
Simple in the sense that, since the September 20th update, price has only advanced in three waves, a hallmark of corrective, not impulsive , movement. Nuanced in the sense that, at times, corrective patterns can extend beyond prior highs and still maintain their corrective nature, as long as the internal structure remains a three-wave pattern.
Some may point out that the prevailing trend has appeared bullish since the June 25th low at $98,242. Yet, in my view, the August 13th high at $124,501.31 completed all the necessary wave components for a terminal structure. While it’s rare, retracements can exceed prior highs and still be valid as part of a corrective sequence, structure is what determines that validity, not price level alone.
That said, if Bitcoin does continue higher and makes an incremental new high, I will adopt my alternative count, which assumes the August 13th top was off by one degree and that the final fifth wave is only now completing.
While these distinctions may seem technical, they are crucial. If the recent rally represents an irregular B-wave correction, it leaves the door open for a C-wave decline potentially forming a flat structure or a retracement that falls short of the initial A-wave low. Conversely, should another marginal high occur first, it would still likely mark a major peak, only delaying the onset of the broader corrective phase.
In summary, absent a new incremental high, my expectation is for a C-wave decline targeting the low $109,000 region minimum , as the next major phase of Bitcoin’s correction.
TradeCityPro | NEARUSDT Ready for a Spot Buy!👋 Welcome to TradeCityPro Channel!
Let’s take a look at NEAR, which is currently moving nicely within a strong daily box, and it seems like a breakout could happen any moment!
🌐 Overview of Bitcoin
Before we begin, let me remind you that we’ve moved the Bitcoin analysis section to a separate daily report at your request, so we can go into more detail about Bitcoin’s condition, price action, and dominance:
📆 Daily Time Frame
Keep in mind that weekly and daily boxes in crypto charts are very important, because the breakout from these zones usually defines the start of a major trend.
Typically, the target range after a breakout is about the same size as the box itself for example, if the box is 10%, we might expect a similar 10% move after the breakout.
Currently, in the daily time frame, NEAR is moving inside a large box between $1.891 and $3.172, while forming higher lows, which is a bullish sign.
Recently, it also found support at the box midline, which is another strong signal of buyer activity, and the price is following a parabolic curve pattern, showing building momentum.
🚀 Spot & Long Position Setup
If NEAR breaks above $3.172, that’s our main trigger to enter a spot buy and even open a long futures position this breakout could mark the start of a strong bullish leg.
🔻 Short Position Setup
However, if the parabolic curve breaks and the price forms a lower high, then a break below $2.616 in lower time frames could trigger a short position opportunity, signaling a potential pullback phase.
📝 Final Thoughts
Stay calm, trade wisely, and let's capture the market's best opportunities!
This analysis reflects our opinions and is not financial advice.
Share your thoughts in the comments, and don’t forget to share this analysis with your friends! ❤️

BTC → Correction phase before bullish expansionBTC/USD Report-Based Analysis
Bitcoin is currently in a corrective phase following a structured upward delivery. After showing strength early in the cycle, the market transitioned into a redistribution and consolidation zone, allowing liquidity to rebalance across both sides. This shift suggests that price is undergoing a short-term reaccumulation before the next impulsive move. The recent break of structure (BOS) indicates a temporary bearish delivery, designed to sweep liquidity below prior demand zones. Smart money appears to be collecting positions in discounted price areas, absorbing sell-side liquidity as volatility expands. The clean liquidity pockets under 116,000–114,000 levels highlight potential mitigation zones where larger participants may seek re-entry. The overall structure remains bullish on the higher timeframe. Once the current correction finalizes and liquidity is efficiently collected, BTC may resume its upward expansion, targeting premium zones near 125,000 and above. Momentum confirmation from volume and market flow will be essential for validating this transition back into a bullish delivery phase. In short, BTC is in a controlled correction, aiming to refine liquidity before reinitiating its bullish macro delivery cycle.

ETH at Critical Support: Can $3,850 Hold?CRYPTOCAP:ETH has faced a sharp rejection from the supply zone around $4,800 and is currently trading near $4,100. There's another strong support zone around $3,850.
I'm personally expecting a sharp rebound from this level. However, if the price fails to hold, we could see a further decline towards $3,600.
DYOR, NFA

AR (Arweave) - Major Support Zone In PlayAR has seen a sharp pullback over the last few weeks and is now testing a key support level. This zone has previously acted as a strong base, making it a potential area for bullish reversal or bounce.
💡 Trade Idea:
🔹 Entry Zone: $5.20 – $5.40
🔹 Targets (TP):
• First target: $6.10 – $6.60
• Second target: $7.80 – $8.75
🔹 Stop Loss: Just below $5.00
🔍 Watch for bullish confirmation (volume spike, candle reversal) at support before entering. Manage your risk and scale out at key resistance levels.

TAO Surging Towards $415WRITE ANALYSIS
ChatGPT said:
TAO is approaching a critical resistance level near $415 after breaking above the descending trendline. This could lead to a test of the key zone, which has been a significant resistance in the past.
A successful break above this level might fuel further upside potential, while rejection could push the price back toward the support zone around $350–$375.
Keep an eye on price action around the key levels for potential breakout or pullback.
DYOR, NFA

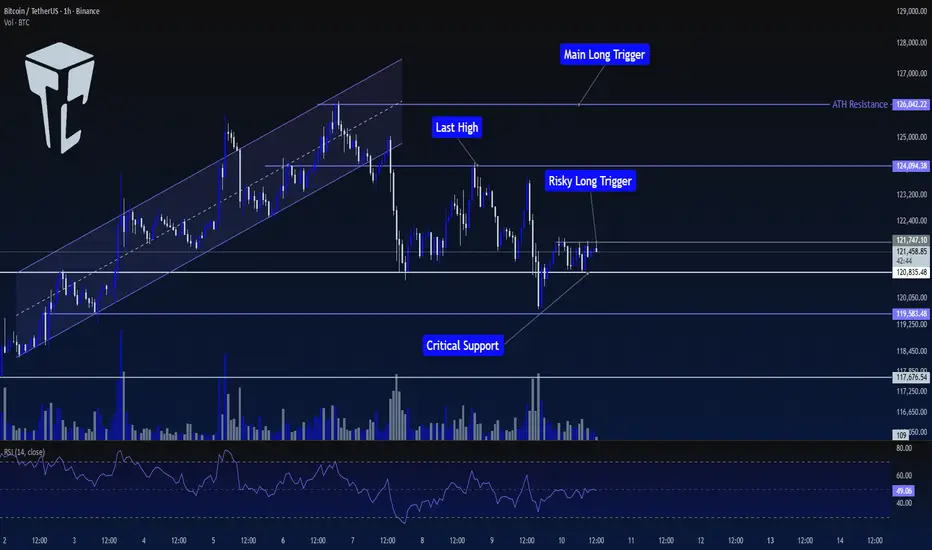
TradeCityPro | Bitcoin Daily Analysis #192👋 Welcome to TradeCity Pro!
Let's dive into Bitcoin analysis. Today, Bitcoin is still in a consolidation and range-bound phase. Let’s take a look at the current market conditions.
⏳ 1-Hour Timeframe
In yesterday’s analysis, Bitcoin was in the process of breaking the $120,835 level. I mentioned that I wasn't opening any short positions yet, but a rejection of this downward movement could be a good sign for a potential upward move.
⭐ This scenario played out, and the price has now moved back above $120,835, which gives us an opportunity to look for long triggers.
✔️ One trigger that has formed is $121,747, which can be used as a risky trigger for a long position.
📊 Market volume has decreased slightly, so it’s better to wait for an increase in volume when this level is broken, as that would raise the likelihood of an upward move.
📈 The next reliable long triggers we have are $124,094 and $126,042. These triggers are more reliable for a position, but they are currently farther from the price, so the chance of them activating today is lower.
💥 For short positions, I'm still not focusing on them and prefer to focus on long positions. Therefore, I currently don’t have any short triggers to provide.
❌ Disclaimer ❌
Trading futures is highly risky and dangerous. If you're not an expert, these triggers may not be suitable for you. You should first learn risk and capital management. You can also use the educational content from this channel.
Finally, these triggers reflect my personal opinions on price action, and the market may move completely against this analysis. So, do your own research before opening any position.
TradeCityPro | NEAR: Breakout Opportunity and Potential Uptrend👋 Welcome to TradeCity Pro!
In this analysis, I’ll review NEAR, one of the Layer 1 and AI crypto projects, with a market cap of $3.9 billion, currently ranked 35th on CoinMarketCap.
⏳ 4-Hour Timeframe
This coin is showing an upward trend against Bitcoin and is currently in a very important resistance zone.
✨ Since being supported at the $2.589 level, the price has reacted multiple times to this zone, and it has formed a higher low at $2.832.
📊 At present, the price is engaged with a supply zone, which it has encountered several times, and is now reaching it again with increased buying volume.
🎲 Breaking this resistance zone will initiate a new upward move for this coin. The main trigger for confirming this move is a break at $3.211.
✔️ We can use the $3.211 break as a trigger for a long position on this coin. Additionally, if the RSI enters Overbuy, the upward movement could become much sharper and more volatile.
📝 Final Thoughts
Stay calm, trade wisely, and let's capture the market's best opportunities!
This analysis reflects our opinions and is not financial advice.
Share your thoughts in the comments, and don’t forget to share this analysis with your friends! ❤️

Bitcoin Testing Critical Zone🔥 Bitcoin Testing Critical Zone 🔥
BTC is currently moving inside the “mid-range” between major support and resistance levels. The current price at $121,570 hasn’t broken above or below yet. This shows the market is waiting for its next move. 👀
📊 Key Levels:
Resistance: $123,934 ➝ if it breaks, a push toward $125–126K is very likely.
Support: $120,133 ➝ if it breaks down, next strong support is around $117K. If that fails too, price may drop to $108K.
EMA200 is still acting as the lower shield. As long as price stays above it, the bigger trend remains healthy.
📉 Stochastic RSI is pointing downward, meaning short-term momentum is weakening a bit. But thick volume between $117K–$120K shows many buyers waiting below.
⚔️ In short:
Break above ➝ fast rally potential.
Break below ➝ sharp drop toward lower support.
The market is quiet before the storm. Whoever reads the move early gets the edge. 😎
#Bitcoin #BTC #Crypto #Trading #MCCChart #mccapaitu

$ETH Performing Ascending Channel
An ascending channel, or rising channel, is a chart pattern used in technical analysis to identify a security's ongoing uptrend. It is characterized by the price fluctuating between two parallel, upward-sloping trendlines.
Key components
Higher highs and higher lows:
The price consistently makes higher swing highs and higher swing lows over a period of time, indicating steady bullish momentum.
Parallel trendlines:
Two parallel lines are drawn to frame the price action.
Upper line (resistance):
Connects the higher swing highs. It represents the point where selling pressure is strong enough to temporarily stop the price from rising.
Lower line (support):
Connects the higher swing lows. This line indicates where buying pressure is strong enough to prevent the price from falling further.

BTCUSDTHello Traders! 👋
What are your thoughts on BITCOIN?
Bitcoin reached a new all-time high earlier this week but failed to hold above it, leading to a rejection and a short-term corrective phase.
The price is now undergoing a healthy pullback, and we expect the correction to continue until the previous breakout zone is retested.
Once this pullback completes, Bitcoin may resume its upward momentum and attempt to form a new higher high.
The broader trend remains bullish, and this correction is viewed as a buying opportunity within the ongoing uptrend.
Don’t forget to like and share your thoughts in the comments! ❤️

Bearish drop off?Ethereum (ETH/USD) is rising towards the pivot, which is a pullback resistance and could reverse to the 61.8% Fibonacci retracement.
Pivot: 4,422.34
1st Support: 4,129.91
1st Resistance: 4,566.08
Disclaimer:
The above opinions given constitute general market commentary, and do not constitute the opinion or advice of IC Markets or any form of personal or investment advice.
Any opinions, news, research, analyses, prices, other information, or links to third-party sites contained on this website are provided on an "as-is" basis, are intended only to be informative, is not an advice nor a recommendation, nor research, or a record of our trading prices, or an offer of, or solicitation for a transaction in any financial instrument and thus should not be treated as such. The information provided does not involve any specific investment objectives, financial situation and needs of any specific person who may receive it. Please be aware, that past performance is not a reliable indicator of future performance and/or results. Past Performance or Forward-looking scenarios based upon the reasonable beliefs of the third-party provider are not a guarantee of future performance. Actual results may differ materially from those anticipated in forward-looking or past performance statements. IC Markets makes no representation or warranty and assumes no liability as to the accuracy or completeness of the information provided, nor any loss arising from any investment based on a recommendation, forecast or any information supplied by any third-party.

XRP Daily – Can the 0.236 Fib Hold Again?XRP Daily – Testing Support at the 0.236 Fib Level
XRP is once again trading in the green support area that has held since the beginning of August.
This zone aligns with the 0.236 Fibonacci level and forms the base of a descending triangle, with the series of lower highs creating its upper boundary.
Price has also lost the 50MA, and from a system perspective, the structure confirms a short-term downtrend, with Price < MLR < SMA < BBcenter.
If this triangle breaks to the downside, the next significant support sits at the 200MA at $2.60.
Momentum indicators remain weak:
RSI is below its moving average and trending downward, while MACD has already turned red, showing fading strength.
With the broader market showing signs of consolidation after BTC ATH,
XRP reaction here could reveal how altcoins handle pressure at key supports.
For now, this support zone remains key; losing it would confirm a bearish breakout from the triangle pattern.
Bias: Short-term bearish, watching the 0.236 Fib and 200MA as critical levels for reaction.
Always take profits and manage risk.
Interaction is welcome.
