BCHUSD H4 | Bearish Reversal in PlayBCH/USD has rejected off the sell level, which is an overhead resistance could drop this level to the downside.
Sel entry is at 534.31
Stop loss is at 567.75, which is a pullback resistance that aligns with the 61.8% Fibonacci retracement.
Take profit is at 490.25, which is a pullback support that aligns with the 61.8% Fibonacci projection.
High Risk Investment Warning
Trading Forex/CFDs on margin carries a high level of risk and may not be suitable for all investors. Leverage can work against you.
Stratos Markets Limited (tradu.com ):
CFDs are complex instruments and come with a high risk of losing money rapidly due to leverage. 65% of retail investor accounts lose money when trading CFDs with this provider. You should consider whether you understand how CFDs work and whether you can afford to take the high risk of losing your money.
Stratos Europe Ltd (tradu.com ):
CFDs are complex instruments and come with a high risk of losing money rapidly due to leverage. 66% of retail investor accounts lose money when trading CFDs with this provider. You should consider whether you understand how CFDs work and whether you can afford to take the high risk of losing your money.
Stratos Global LLC (tradu.com ):
Losses can exceed deposits.
Please be advised that the information presented on TradingView is provided to Tradu (‘Company’, ‘we’) by a third-party provider (‘TFA Global Pte Ltd’). Please be reminded that you are solely responsible for the trading decisions on your account. There is a very high degree of risk involved in trading. Any information and/or content is intended entirely for research, educational and informational purposes only and does not constitute investment or consultation advice or investment strategy. The information is not tailored to the investment needs of any specific person and therefore does not involve a consideration of any of the investment objectives, financial situation or needs of any viewer that may receive it. Kindly also note that past performance is not a reliable indicator of future results. Actual results may differ materially from those anticipated in forward-looking or past performance statements. We assume no liability as to the accuracy or completeness of any of the information and/or content provided herein and the Company cannot be held responsible for any omission, mistake nor for any loss or damage including without limitation to any loss of profit which may arise from reliance on any information supplied by TFA Global Pte Ltd.
The speaker(s) is neither an employee, agent nor representative of Tradu and is therefore acting independently. The opinions given are their own, constitute general market commentary, and do not constitute the opinion or advice of Tradu or any form of personal or investment advice. Tradu neither endorses nor guarantees offerings of third-party speakers, nor is Tradu responsible for the content, veracity or opinions of third-party speakers, presenters or participants.
Cryptomarket

Next Projection On BTCUSDWe have analyzed Bitcoin market from various timeframes and we currently anticipating further bearish continuation formation to the downside, Price is ranging on the 4 hours timeframe that could lead price further to the downside.

TradeCityPro | Bitcoin Daily Analysis #197👋 Welcome to TradeCity Pro!
Let’s go over the Bitcoin analysis; today Bitcoin is still in a downtrend, so let’s review the market together.
⏳ 1-Hour Timeframe
After the double top that was activated yesterday near the 0.5 Fibonacci level, Bitcoin entered a corrective phase after reaching the double top target.
✨ The double top peaks formed around 115,698, but after completing the downward move and starting the correction, the price created lower highs around 113,218, and now with the break of 111,975, a new high-volume downward move has started.
📊 The price is moving back toward the supply zone it had, and reaching this area is not a good sign for the upward trend we see on higher timeframes.
🔽 The more the price approaches this zone and reacts to it, the weaker the zone becomes, and the probability of it breaking increases in subsequent attempts.
✔️ Currently, this is the third time the price is approaching this zone, and each time it comes with higher volume and a stronger bearish structure; if this pattern repeats several times, the zone could break.
🔍 Whether the price breaks or finds support at this zone can determine the market’s direction for the upcoming period.
⚡️ If the zone breaks, Bitcoin could enter a corrective and range-bound phase for weeks or even months, and we wouldn’t be able to open positions effectively in that environment.
📈 If the zone holds as support, with a break above 115,698, we would get confirmation of Bitcoin’s bullish trend and could expect the next upward move to begin.
❌ Disclaimer ❌
Trading futures is highly risky and dangerous. If you're not an expert, these triggers may not be suitable for you. You should first learn risk and capital management. You can also use the educational content from this channel.
Finally, these triggers reflect my personal opinions on price action, and the market may move completely against this analysis. So, do your own research before opening any position.

TradeCityPro | Ethereum: Break Key Levels for Bullish Momentum👋 Welcome to TradeCity Pro!
In this analysis, I want to examine Ethereum for you. The queen of the crypto market, with a $497 billion market cap, is ranked 2nd on CoinMarketCap.
⏳ 4-Hour Timeframe
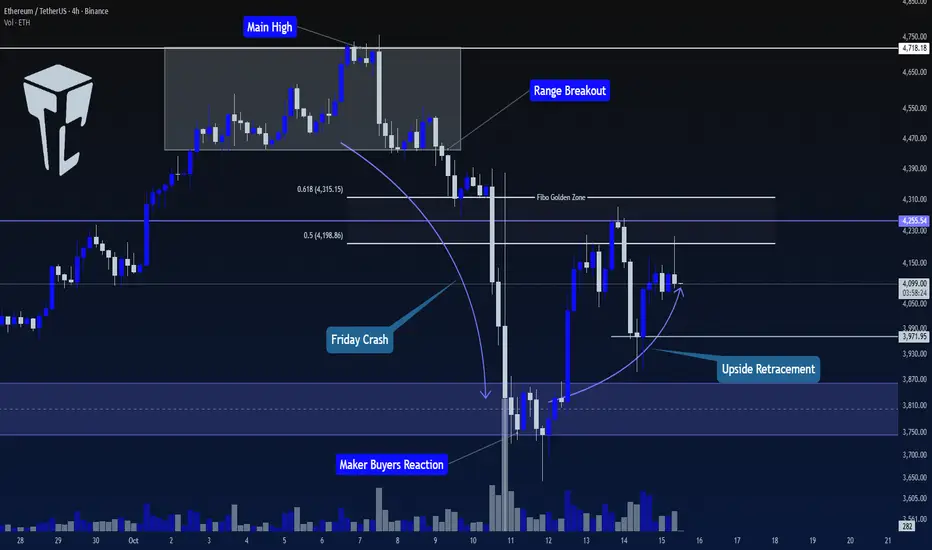
This coin, in the 4-hour timeframe, after breaking the range box at the ceiling and moving towards the $3800 level, is now in a corrective phase and has made an upward movement.
⭐ The $3800 range is a very important level for Ethereum, and this zone was not broken even during the Flash Crash that occurred on Friday, and it managed to hold the price.
🚀 Now, the price has moved towards the range between 0.5 and 0.618 Fibonacci, and has been rejected once from this zone.
📊 The volume has not increased significantly during this move and has mostly been range-bound, but since the price has created a higher low at the $3971 level, if the buying volume increases, we can get a bullish confirmation with a break of the $4255 level.
💥 Since this coin is bullish on higher timeframes and is currently undergoing a correction on lower timeframes, if the price gives us a small bullish confirmation, we can take advantage of it and open a long position.
💡 The main resistance for Ethereum is the $4718 level. Breaking this level will initiate the next wave for Ethereum on higher timeframes, such as weekly charts. Therefore, I will try to open a long position on Ethereum before this level is broken.
📈 The suitable trigger right now seems to be a break of $4255. With this break, the price can move towards $4718, and if this level is broken, we will have a very good and attractive entry point for a long position on Ethereum.
📝 Final Thoughts
Stay calm, trade wisely, and let's capture the market's best opportunities!
This analysis reflects our opinions and is not financial advice.
Share your thoughts in the comments, and don’t forget to share this analysis with your friends! ❤️
$ZEREBRO Performing a bullish pennant A bullish pennant is a chart pattern in technical analysis that signals a continuation of an uptrend. It is formed when a sharp, strong upward price movement (the "flagpole") is followed by a short period of consolidation, creating a small symmetrical triangle (the "pennant"). A breakout above the pennant's upper trendline indicates that the uptrend will likely continue.

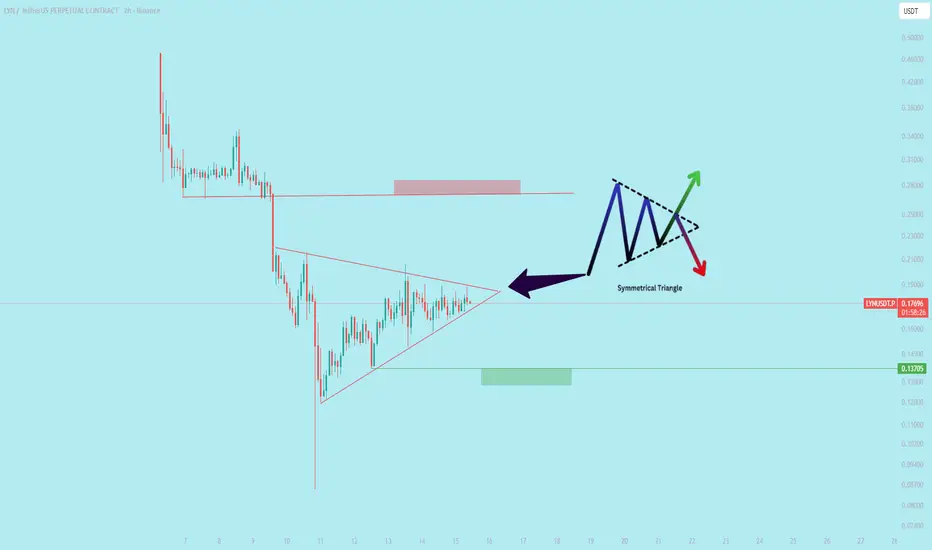
$LYN Performing a symmetrical triangle**$LYN** **Performing a symmetrical triangle** `symmetrical triangle is a chart pattern formed by two converging trendlines that connect a series of lower highs and higher lows. It represents a period of market consolidation and indecision, with neither buyers nor sellers having a clear advantage. The price range narrows as it moves toward the triangle's apex, or point of convergence.`
Bitcoin Market Analysis – October 15, 2025🔸 Open interest is currently low, which means traders aren’t showing much interest in taking new positions for now.
🔻 Yesterday’s daily candle closed weak, failing to provide any solid confirmation for bullish continuation.
▫️At the moment, we’re starting to see early signs of a potential bearish scenario — technically speaking. However, from a fundamental perspective, there’s still a chance the market could shift back to a risk-on sentiment.
🔶 Bitcoin is now sitting on a very important support zone.
Right now, I’m waiting for a new structure to form before confirming any direction — whether it’s a deeper correction or a recovery move.
🔹 Summary:
As long as open interest stays low and no strong structure forms, the market remains in a waiting phase. The current support area will determine Bitcoin’s next major move.

BTCUSD: Waiting for a range breakBITSTAMP:BTCUSD is currently trading within a tight accumulation range between 112,004 and 113,524.
Today’s plan:
Wait for price to consolidate near the upper boundary of the range while the EMA compresses close to price action. Once a clear range break (RB) to the upside occurs, enter a market buy.
If the price breaks early without enough consolidation, wait for a pullback to retest the breakout level and look for a buy setup after the range break (ARB).
Profit targets and stop loss levels should be chosen according to individual risk management preferences.
Daniel Miller @ ZuperView

TOTAL Crypto land holding support since May.Many saying markets have been hammered.
TOTAL Cryptoland still holding support line since end of July.
Outober coming late this time?
Next pump we above the 21 day aline and resistance from end of August

ETH Consolidates Below Yesterday Cloee ETH 30M – Waiting for Long Confirmation
After a sharp pullback, Ethereum is now consolidating right below key dynamic levels, the perfect zone where patience pays more than prediction.
🧭 System Overview:
I track 3 confirmation signals:
1️⃣ MLR10 crossing above SMA3.
2️⃣ MLR10 crossing above BB center
3️⃣ PSAR flipping below price.
⚙️ Current Time Frame (30m):
PSAR (gray) still above price → bearish bias not yet invalidated.
MLR10 (blue) is between SMA3 (magenta) and BB center (orange) → neutral zone.
RSI at 49.7 → momentum flat.
MACD turning red → fading strength.
200MA (red) near 4000 → key structural support.
💡 Interpretation:
ETH is preparing, not breaking.
There’s potential energy building, but entry discipline is crucial.
Until PSAR flips below and MLR reclaims both SMA and BB center, we stay flat.
📊 Market context:
Open Interest ↓ 1.8% → leverage cooling off.
Funding neutral → no retail squeeze in play.
Liquidations balanced → no directional aggression.
➡️ Conclusion:
No confirmed long yet, but structure shows early recovery potential.
A valid System Long will trigger once all 3 signals align.
Key levels:
Resistance: Yesterday close , dotted line
Support: MA50
Next long trigger → when PSAR flips & MLR > SMA3 > BB center
Always take profits and manage risk.
Interaction is welcome.

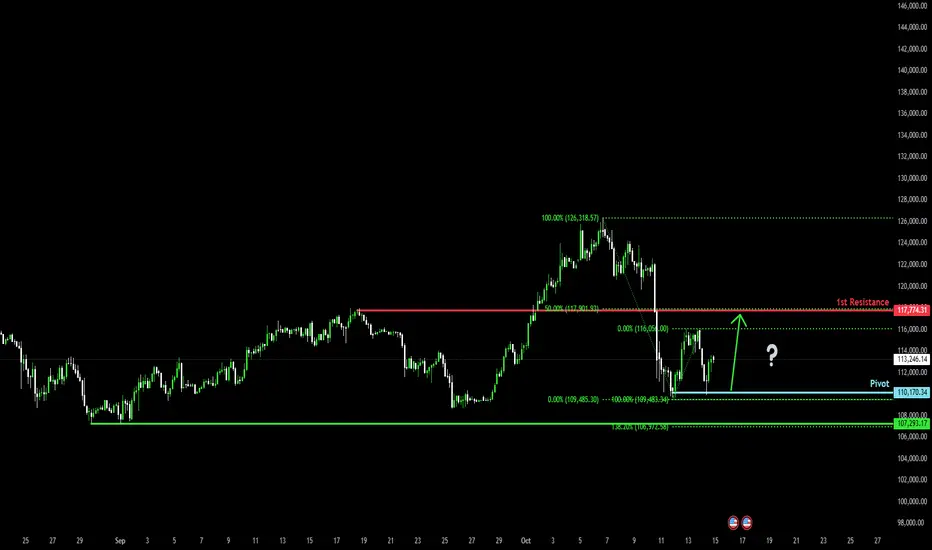
Bullish reversal for Bitcoin?The price has bounced off the pivot, which is a pullback support, and could rise to the 50% Fibonacci resistance.
Pivot: 110,170.34
1st Support: 107,293.17
1st Resistance: 117,774.31
Disclaimer:
The above opinions given constitute general market commentary, and do not constitute the opinion or advice of IC Markets or any form of personal or investment advice.
Any opinions, news, research, analyses, prices, other information, or links to third-party sites contained on this website are provided on an "as-is" basis, are intended only to be informative, is not an advice nor a recommendation, nor research, or a record of our trading prices, or an offer of, or solicitation for a transaction in any financial instrument and thus should not be treated as such. The information provided does not involve any specific investment objectives, financial situation and needs of any specific person who may receive it. Please be aware, that past performance is not a reliable indicator of future performance and/or results. Past Performance or Forward-looking scenarios based upon the reasonable beliefs of the third-party provider are not a guarantee of future performance. Actual results may differ materially from those anticipated in forward-looking or past performance statements. IC Markets makes no representation or warranty and assumes no liability as to the accuracy or completeness of the information provided, nor any loss arising from any investment based on a recommendation, forecast or any information supplied by any third-party.
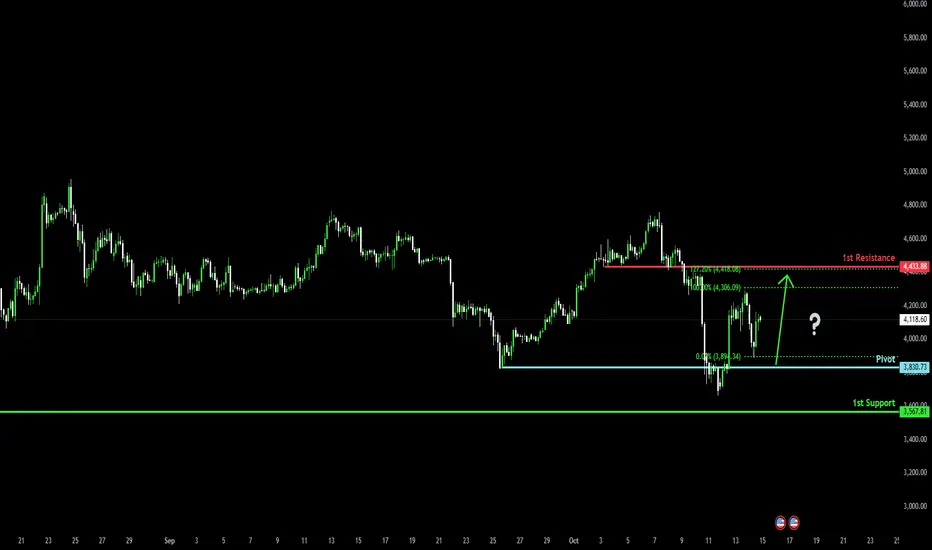
Bullish reversal setup?The Ethereum (ETH/USD) is falling towards the pivot and could bounce to the 1st resistance that aligns with hte 127.2% Fibonacci extension.
Pivot: 3,830.73
1st Support: 3,567.83
1st Resistance: 4,433.88
Disclaimer:
The above opinions given constitute general market commentary, and do not constitute the opinion or advice of IC Markets or any form of personal or investment advice.
Any opinions, news, research, analyses, prices, other information, or links to third-party sites contained on this website are provided on an "as-is" basis, are intended only to be informative, is not an advice nor a recommendation, nor research, or a record of our trading prices, or an offer of, or solicitation for a transaction in any financial instrument and thus should not be treated as such. The information provided does not involve any specific investment objectives, financial situation and needs of any specific person who may receive it. Please be aware, that past performance is not a reliable indicator of future performance and/or results. Past Performance or Forward-looking scenarios based upon the reasonable beliefs of the third-party provider are not a guarantee of future performance. Actual results may differ materially from those anticipated in forward-looking or past performance statements. IC Markets makes no representation or warranty and assumes no liability as to the accuracy or completeness of the information provided, nor any loss arising from any investment based on a recommendation, forecast or any information supplied by any third-party.
BTC/USDT — Volume Confirmation Points Toward UptrendBitcoin has reclaimed strength within the low time frame zone, while also showing rising volume activity — a key technical signal that supports the early stage of a potential uptrend continuation.
BTC volume has been increasing since the last 7H step by step.
Currently, BTC is stabilizing between $111K and $113.6K, forming a supportive base within this range. The volume range just above acts as a confirmation layer — once price holds above this level with consistent demand, the uptrend momentum could accelerate.
📊 Technical Highlights:
Low Time Frame Support: $111K–$113.6K
Volume Zone: $116.6K area and important confirmation zone.
Main Resistance / Target: $118-120K
A sustained move above the volume zone ($116K) would be the main confirmation that BTC’s next leg toward $126K is underway.
📈 Bias: Bullish continuation forming
🎯 Key levels: $113.6K → $116K → up 118K

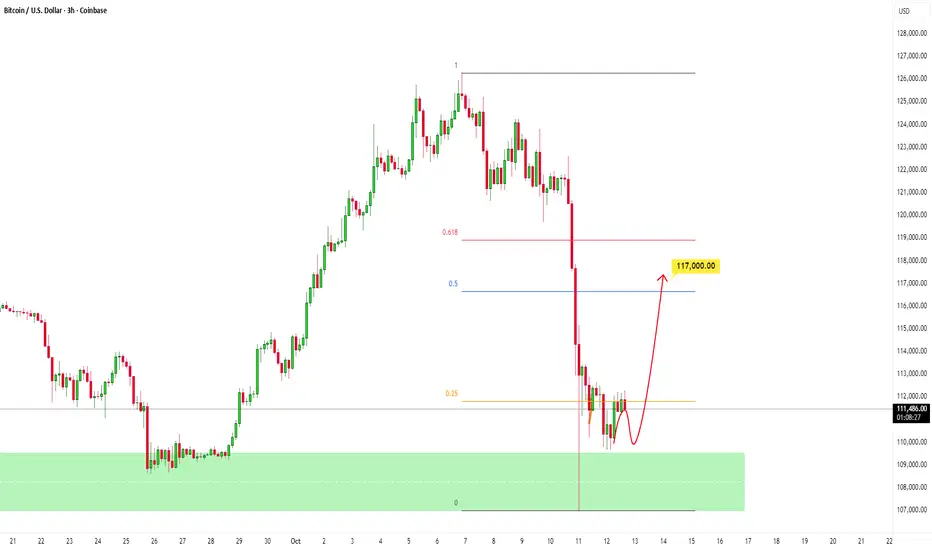
BTC to Retrace to Key Fibonacci level after Heavy SelloffPrice experienced a sharp and aggressive selloff and now, after a strong rejection from key level, the market is consolidating, showing early signs of stabilization as sellers begin to lose momentum.
If buyers can defend this area and push price higher, the next logical target lies around the Fibonacci 0.5–0.618 retracement zone, aligning with the 117,000 - 119,000 level, a key area where sellers may step back in.
TAO Eyes Next Leg Toward $700!BINANCE:TAOUSDT is breaking through a key resistance zone, signaling a strong shift in momentum.
This breakout not only confirms buyer strength but also opens the door for a potential move toward the $700 region, where the next major resistance lies.
As long as TAO holds above this breakout zone, the structure remains bullish and continuation toward higher levels looks likely.
DYOR, NFA
THANKS FOR THE READ

ETH : BUY OR SELL ?Hello friends
Given the good decline we had, there was a good opportunity to buy at good prices with capital and risk management and in steps and move towards the specified goals.
*Trade safely with us*

SOL ; BUY OR SELL ?Hello friends
Given the decline we had, we can see it as an opportunity to buy at lower prices with risk and capital management.
Now we have obtained support levels for you and we have an important resistance that the price must break strongly to make the climb valid for us.
The goals are also clear.
*Trade safely with us*

TradeCityPro | Bitcoin Daily Analysis #196👋 Welcome to TradeCity Pro!
Let’s go over Bitcoin's analysis. The price is moving down again, so let’s review Bitcoin's movement together.
⏳ 1-Hour Timeframe
Yesterday, we had a trigger at the $115,698 zone, but the price couldn't sustain above this level, and Bitcoin's downward movement has started again.
✔️ A double top pattern has formed in this timeframe, and the trigger for this pattern activation was $113,991, which has now been activated. With the large volume, the price has managed to stabilize even below the $111,278 zone.
💥 The RSI oscillator has once again entered Oversell, and the price has reached near our support zone.
⚡️ If this support zone is broken, we can open a short position. Otherwise, I won’t be opening any short positions with other triggers.
📈 For a long position, we need a very strong reaction and significant bullish momentum at the support zone. In this case, the main trigger for a long would be $115,698, but we can also use earlier triggers if they form.
📊 For now, I will wait to see how the price reacts to the zone and then look for the trigger. The only trigger I have at the moment is $115,698.
❌ Disclaimer ❌
Trading futures is highly risky and dangerous. If you're not an expert, these triggers may not be suitable for you. You should first learn risk and capital management. You can also use the educational content from this channel.
Finally, these triggers reflect my personal opinions on price action, and the market may move completely against this analysis. So, do your own research before opening any position.

TradeCityPro | LINK: Eyeing $18 for Potential Drop👋 Welcome to TradeCity Pro!
In this analysis, I’m going to review the LINK coin — one of the RWA projects, currently ranked 12th on CoinMarketCap with a market capitalization of $12.57 billion.
⏳ 1-Hour Timeframe
In the 1-hour timeframe, after Friday’s drop, the price fell to $16.78.
💫 Following this decline, the price made an upward correction up to the 0.618 Fibonacci level. After one reaction to this zone, bearish momentum returned to the market, and volume has been increasing.
✅ Currently, the price is moving toward the $18.31 level. Breaking this zone could trigger the start of the next downward leg.
⭐ The main support level remains at $16.78, and as long as the price stays above this zone, I won’t be opening any short positions.
📊 For long positions, the current trigger is $20.02.For earlier triggers, we need to wait for the market to form more structure and generate new entry signals.
📝 Final Thoughts
Stay calm, trade wisely, and let's capture the market's best opportunities!
This analysis reflects our opinions and is not financial advice.
Share your thoughts in the comments, and don’t forget to share this analysis with your friends! ❤️

ETHUSDTHello Traders! 👋
What are your thoughts on Ethereum?
Ethereum is currently trading between two major zones of support and resistance.
In this range, we expect a short-term correction toward the ascending trendline, followed by some consolidation before a potential breakout above the resistance zone.
If the support holds, followed by a positive reaction from the trendline and a breakout above the resistance level, Ethereum is expected to begin a new bullish wave and move higher toward the identified target levels.
If a daily candle closes below $3,500, this bullish scenario will be invalidated and a deeper correction could follow.
Don’t forget to like and share your thoughts in the comments! ❤️

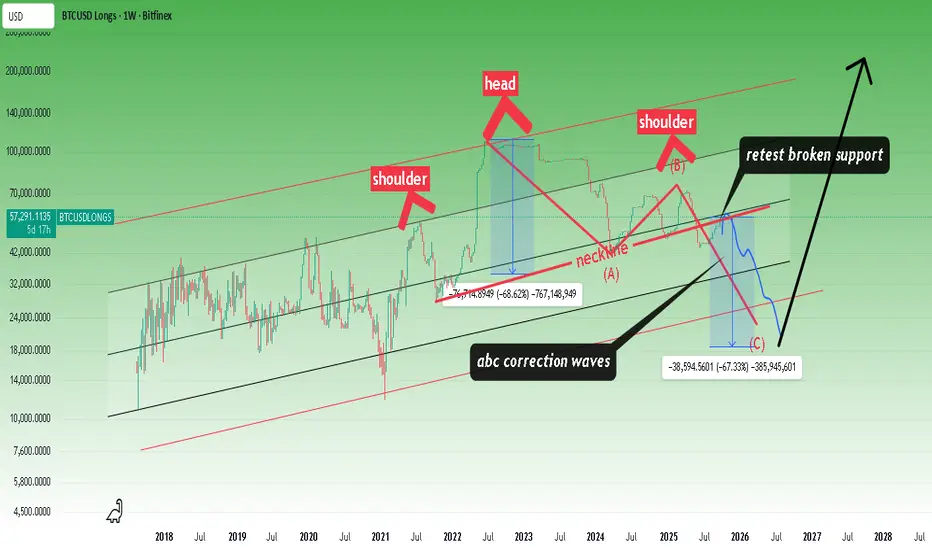
Corrective waves continue.Bitcoin's bullish sentiment still far outweighs its bearish sentiment. In my opinion, this is a balancing act. I think the market will stabilize in the coming months.
* The purpose of my graphic drawings is purely educational.
* What i write here is not an investment advice. Please do your own research before investing in any asset.
* Never take my personal opinions as investment advice, you may lose your money.
BTC/USD: Danger Zone Ahead—Here’s What I’m Watching Take a close look at what’s happening now. BTC/USD is on the edge at 111,060, and if that breaks, the next major levels are 106,470, 103,200, then possibly even 100,000. Markets can shift fast; are you prepared with clear levels and a plan, or will you get caught reacting?
If you’ve ever felt unsure about how to spot big moves before they happen, or wondered how some traders seem to always stay one step ahead, you’re not alone. What’s the one thing you wish someone had told you when the market started moving fast? What’s your biggest struggle when the price gets volatile?
Drop your thoughts or questions in the comments
Or if you want to dig deeper, my inbox is always open for a real conversation. Sometimes the right question is all it takes to unlock a breakthrough. What do you want to see covered next?

BTCUSD H4 | Bearish Momentum To ExtendBitcoin (BTC/USD) is rising towards the sell entry at 117,225.08, which is a pullback resistance that is slightly above the 23.6% Fibonacci retracement.
Stop loss is at 121,603.58, which is a pullback resistance that lines up with the 61.8% Fibonacci retracement.
Take profit is at 109,369.55, which is a multi swing low support.
High Risk Investment Warning
Trading Forex/CFDs on margin carries a high level of risk and may not be suitable for all investors. Leverage can work against you.
Stratos Markets Limited (tradu.com ):
CFDs are complex instruments and come with a high risk of losing money rapidly due to leverage. 65% of retail investor accounts lose money when trading CFDs with this provider. You should consider whether you understand how CFDs work and whether you can afford to take the high risk of losing your money.
Stratos Europe Ltd (tradu.com ):
CFDs are complex instruments and come with a high risk of losing money rapidly due to leverage. 66% of retail investor accounts lose money when trading CFDs with this provider. You should consider whether you understand how CFDs work and whether you can afford to take the high risk of losing your money.
Stratos Global LLC (tradu.com ):
Losses can exceed deposits.
Please be advised that the information presented on TradingView is provided to Tradu (‘Company’, ‘we’) by a third-party provider (‘TFA Global Pte Ltd’). Please be reminded that you are solely responsible for the trading decisions on your account. There is a very high degree of risk involved in trading. Any information and/or content is intended entirely for research, educational and informational purposes only and does not constitute investment or consultation advice or investment strategy. The information is not tailored to the investment needs of any specific person and therefore does not involve a consideration of any of the investment objectives, financial situation or needs of any viewer that may receive it. Kindly also note that past performance is not a reliable indicator of future results. Actual results may differ materially from those anticipated in forward-looking or past performance statements. We assume no liability as to the accuracy or completeness of any of the information and/or content provided herein and the Company cannot be held responsible for any omission, mistake nor for any loss or damage including without limitation to any loss of profit which may arise from reliance on any information supplied by TFA Global Pte Ltd.
The speaker(s) is neither an employee, agent nor representative of Tradu and is therefore acting independently. The opinions given are their own, constitute general market commentary, and do not constitute the opinion or advice of Tradu or any form of personal or investment advice. Tradu neither endorses nor guarantees offerings of third-party speakers, nor is Tradu responsible for the content, veracity or opinions of third-party speakers, presenters or participants.
