ETH 1D AnalysisCRYPTOCAP:ETH is at crucial zone. Still supporting long term daily trend line.
Rejection from here can lead to the levels down as shown on the chart.
Stay Cautious.
Cryptomarket

BTC 1D AnalysisBitcoin is still at the support of Up trendline on daily timeframe. Hopes are still alive.
Also we can say it is on the support zone. If you wish to take trade on any side please confirm it on 4H once.

TradeCityPro | Bitcoin Daily Analysis #194👋 Welcome to TradeCity Pro!
Let’s analyze Bitcoin today, the market has calmed down a bit, and we can perform some analysis.
⏳ 1-Hour Timeframe
In the 1-hour timeframe, Bitcoin has reached a support level around $109,000 and has shown a reaction to this level.
⭐ After the heavy drop that occurred two days ago, the open interest and market volume have decreased significantly, which clearly indicates that market participants are currently indecisive.
✨ Yesterday, the price reacted to the support zone on Bitcoin, and a significant resistance was created around $112,420, which it has now reached again.
💥 The RSI oscillator has finally moved out of the Oversell zone, and it’s currently below the 50 level.
🧮 Although there’s still fear and a bearish momentum in the market, breaking the $112,420 resistance could be a very risky long trigger.
✔️ Personally, I’m waiting and observing. However, for those who like to open positions every day, breaking this resistance is the only long trigger I can provide.
💡 For a short position, we could enter after the price breaks below the level. I’m passing on this position for now and will wait for a confirmation to search for a short trigger after the price stabilizes below this zone.
❌ Disclaimer ❌
Trading futures is highly risky and dangerous. If you're not an expert, these triggers may not be suitable for you. You should first learn risk and capital management. You can also use the educational content from this channel.
Finally, these triggers reflect my personal opinions on price action, and the market may move completely against this analysis. So, do your own research before opening any position.

Bitcoin Bullish Confirmation Above $119500 | Watch November MoveBitcoin is currently trading below a key resistance level of **$114,500**, and a **strong Monday closing on 13 October above this level** is crucial for confirming a short-term bullish recovery.
If BTC successfully closes above **$114,500**, the next important resistance will be around **$119,500**.
A **Monday closing on 20 October above $119,500** would confirm a temporary bullish structure, giving Bitcoin the strength to test higher levels toward the **$127,600 liquidity zone** in November.
Currently, major liquidity is sitting near **$124,600 and $127,600**, which might attract price movement before any major reversal begins.
The market has already taken liquidity around **$101,000**, trapping retail sellers — and now, it may move up to grab the **short-side liquidity** before the next larger downtrend begins.
⚠️ **Be patient and stay disciplined. Avoid long positions for now.**
Focus on the market’s move toward the top, and prepare for **short positions near the highs** to capture the **2026 bear market** — which is expected to last from **September to November 2026**.
📊 The market often manipulates both sides before showing the real direction. Watch levels carefully and trade with confirmation.
💬 **Follow me on TradingView** for more Bitcoin and Ethereum updates — and comment below which coin you’d like me to analyze next!

XRPUSD: From Panic to Opportunity - The Drop I'm Waiting ForGood morning everyone and Happy Sunday once again. Last Friday was a mess for a lot of us who hold long positions. But sometimes these sudden big drops creates opportunities for those who are patiently waiting.
I only have two cryptos that I kept buying every time it tested the 200MA. These are BITSTAMP:BTCUSD and BITSTAMP:ETHUSD and I considered it as my long term investments.
BITSTAMP:XRPUSD was supposed to be my 3rd one but because of the legal history happened between Ripple and US S.E.C. I stayed away.
These dispute was settled and won by Ripple last 2023, and honestly I missed the train when XRP breakouts after the US election last year.
For those who wants to understand BITSTAMP:XRPUSD , here's some quick points:
XRP is a cryptocurrency created by Ripple Labs. Its main goal isn’t to replace traditional money — it’s to make global money transfers faster and cheaper, especially between banks and financial institutions.
Here’s the core idea:
When you send money internationally through traditional systems (like SWIFT), it’s slow, expensive, and goes through several intermediaries.
Ripple built the XRP Ledger (XRPL) — a blockchain that can settle cross-border payments in seconds, at a fraction of a penny per transaction.
XRP acts as a bridge currency — meaning it can be used to instantly convert one fiat currency to another (say USD → EUR or PHP → CAD) without holding both in reserve.
XRP usage is a big game changer and I think bank institutions could or might adapt the system - who knows.
Last Friday, I bought my first XRP when I saw the big drop, I was really waiting for that sub $2.00 level but the price action was so fast and I ended up filled at $2.41-$2.45.
I think this will test back again from that Friday's low (Oct.10) which was at around $1.78- $1.80s and if that happens, I will add from that again. I know we shouldn't be averaging down but like I said from the beginning that I want this to hold long (like the same strategy I'm using for BTC and ETH).
As of this writing, XRP is trading at around $2.40s but I don't care. My exposure here is not that much plus I am really planning to add more at $1.80's, if for some reason it comes back there.
Just remember that to always manage your risk ok, watch your position size and most of all God Bless You all...

Crypto Total Market Cap (TOTAL) — Macro Analysis🌐 Crypto Total Market Cap (TOTAL) — Macro Analysis
“The Last Great Wave: Supercycle 5 Unleashed”
Elliott Wave Theory | Fibonacci Confluence | Price Action | Fundamentals | Smart Money
We are in the final act of crypto’s Supercycle. Macro Wave 3 of Supercycle Wave 5 is unfolding — historically the most powerful and explosive phase. With Smart Money, regulatory tailwinds, RWA tokenization, and macro cracks forming, the global market is revaluing digital assets on a generational scale.
🌀 Corrected Elliott Wave Count (Supercycle Focus)
✅ Supercycle Wave 1 (2009–2013)
The beginning of a new monetary class.
Bitcoin's rise from $0 to ~$1,200
First global recognition of digital scarcity
Infrastructure non-existent, adoption grassroots
This was the “discovery” phase
🔻 Supercycle Wave 2 (2013–2014)
Classic corrective ABC wave
Bubble burst post-Mt. Gox
85%+ crash
Smart Money accumulated quietly in despair
🚀 Supercycle Wave 3 (2014–2018)
Explosion of the asset class
Ethereum launch (2015), ICO mania (2017)
Market cap surged from ~$6B to ~$800B
Ended at 3.618 Fibonacci extension — textbook Wave 3 expansion
Capped by global fear, regulatory clampdowns (SEC, China bans)
🔻 Supercycle Wave 4 (2018–2020)
Mild correction at 0.236 retracement
No deep flush = extremely bullish long-term
Market digested growth as institutions built infrastructure:
Coinbase IPO prep
Grayscale accumulation
Institutional custody models emerged
🔥 Supercycle Wave 5 (2020–~2030+) — Currently in Progress
The most explosive, longest, and emotionally driven wave.
Historically associated with euphoria, institutional alignment , and eventual blow-off tops.
This wave is subdividing into five Macro Waves:
🟢 Macro Wave 1 (2020–2021):
From ~$180B to ~$3T
Fueled by:
📈 Inflation hedge narratives
🏛️ Institutional participation
🖼️ NFTs, DeFi, Ethereum scalability
🌍 Global lockdowns, liquidity stimulus
Ended in November 2021 with euphoric sentiment
🔻 Macro Wave 2 (2021–2022):
From ~$3T to ~$780B
Bear market: -70% drawdown
FTX collapse, Terra-Luna crash, Celsius, BlockFi
Retail was obliterated
Smart Money accumulated deeply discounted projects
Structural bottom confirmed by price action and on-chain data
🚀 Macro Wave 3 (2023–Now):
We are in Micro Wave 3 of this Macro Wave 3 — the strongest part of the cycle.
📍 Current targets:
Wave (3) extension → $10T–$30T
Wave (5) extension → $80T–$120T
Supported by:
🧠 On-chain growth (real users, L2 activity, RWAs)
🏦 Institutional alignment (BlackRock, JPM, Visa)
🔗 Tokenization of RWAs (Real estate, bonds, carbon credits)
🌍 De-dollarization via BRICS + commodity-backed stablecoins
📉 Central bank credibility collapse (debt > GDP globally)
📐 Fibonacci Confluence Zones
Macro Wave 1 → 3T top
Macro Wave 2 → 0.382 retracement to ~$780B
Macro Wave 3
2.618 Fib = ~$29.95T ✅
3.618 Fib = ~$123.89T 🌌
These levels line up with:
Global monetary regime transition
S-curve mass adoption
Tokenized global GDP narrative
📦 Smart Money Concept (SMC) Perspective
📉 2022–2023 range = Accumulation Zone
🔁 BoS (Break of Structure) confirmed in 2023 above $2T
🧲 Liquidity traps above 2021 highs = fuel for Macro 3
🧠 Institutions and sovereign entities are already in position
Price is respecting:
Demand zones
Bullish BOS
Market structure shifts
Fibonacci channel projections
😮💨 Market Cycle Psychology
🧊 Disbelief (2019–2020): “It’s dead.”
📈 Hope (2020–2021): “This time it’s real.”
💥 Euphoria (Late 2021): “It’s going to $100K next week.”
😱 Fear/Panic (2022): “Crypto is a scam.”
🧠 Smart Accumulation (2023): Institutions enter quietly.
🔥 Reawakening (2024–2025): We’re here.
🤯 Parabola & Mania (2026+): Yet to come — peak Wave 3 & 5
💔 Despair (Post-2030): Final Supercycle correction
🌐 Macro-Fundamental Drivers of Wave 5
🏦 Monetary System Decay
US debt over $35T+
Japan bond collapse, EU stagflation
Dollar losing trust
🌍 Global Transition
BRICS de-dollarization
Gold & crypto-backed settlement rails
Sanction-evading neutral assets gaining traction
📲 Technology Adoption
Ethereum scalability (Danksharding, L2s)
RWA on-chain (US bonds, private equity, commodities)
AI + Crypto convergence
Gaming, identity, and DePIN revolution
🔐 Regulation
MiCA in EU, Hong Kong openness, US crypto ETFs
Institutions now cleared for capital deployment
🎯 Long-Term Price Targets
🥇 Wave 3 of Macro: $10–30T
🥈 Macro Wave 5 of Supercycle: $60–120T
🧠 Generational top expected ~2030 (aligning with macro realignments)
🧠 Ride the structure. Don’t chase the mania! - FIBCOS
📘 Disclaimer: This is a structural, educational market outlook. Not financial advice. Please do your own due diligence and risk management.
#Crypto #TotalMarketCap #ElliottWave #Fibonacci #SmartMoneyConcepts #PriceAction #TechnicalAnalysis #MarketStructure #Commodities #InflationHedge #MacroEconomics #CentralBanks #BRICS #MonetaryReset

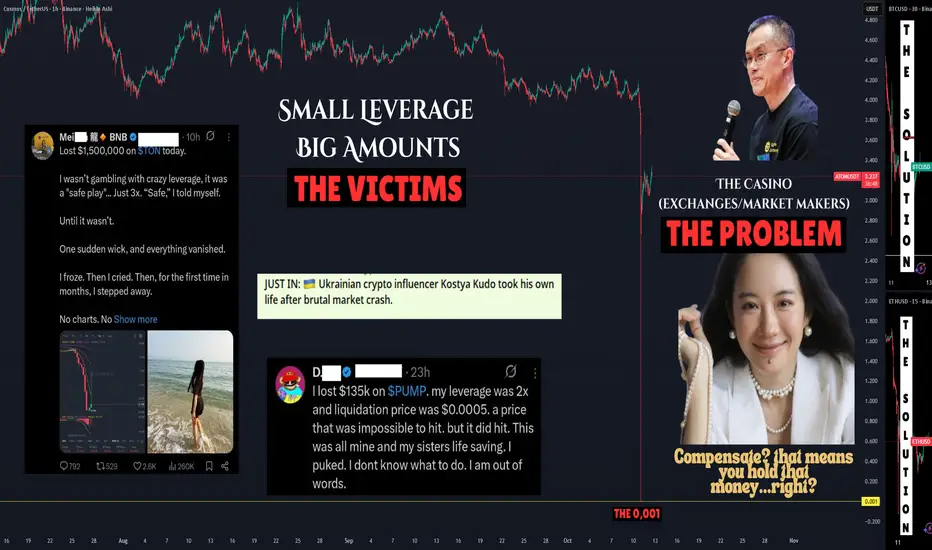
The Problem With Crypto – Part 1: Centralized 'Exchanges'🧠 The Problem With Crypto – Part 1: Centralized Exchanges
It actually took me a while to decide what title to give this post.
Because every single one of these would fit:
-The Exchange Illusion
-The Liquidation Machine
-The Centralized Harvest
-Inside the Casino
-How Exchanges Always Win
-Where Did Your Money Go? 💰
-They Say They’ll Compensate You… So Who’s Holding Your Cash?
-The Perfect Crime Nobody Talks About 🎭
-Your Loss = Their Profit
-The Casino Always Wins 🎰
And honestly… they’re all partially — or maybe wholly — true.
💥 About Friday’s Crash
Friday’s collapse wasn’t random.
It wasn’t “volatility.”
It was a harvest event — engineered by liquidation engines that feed the exchanges.
Coins didn’t drop 50–60 % because of news — they dropped because leverage met latency, and the house collected the pot.
👩🏫 A Question From My Student
One of my community members, Sarah, asked me:
“Professor, how did this even happen? How can small-leverage positions just disappear?”
So here’s the truth — no sugar-coating. ☕💀
🎭 The Illusion of Liquidity
When you see a coin drop 50–60 % in minutes, that’s not price discovery — it’s engineered implosion.
Exchanges create the illusion of deep liquidity, but when panic hits, that liquidity vanishes faster than your stop-loss button.
They brag about billions in open interest, but that’s just leveraged ghost money.
On a 100× market, $10 million in deposits looks like $1 billion of “open interest.”
A 1 % move = total collapse of the stack.
🧨 How the Domino Falls
1️⃣ Market dips 1–2 %.
Liquidation bots start killing over-levered longs.
2️⃣ Those positions don’t close quietly — the system market-sells them, pushing price lower and triggering the next wave.
3️⃣ Within seconds you have a cascade — a healthy market turns into a slaughterhouse.
That’s how you get –60 % in five minutes on a coin with no news, no hack, no reason.
🏦 The Exchanges’ Dirty Secret
They love these crashes.
Because every liquidation = trading fee + funding reset + spread capture.
They collect the liquidation fee (usually 0.5–1 %).
They resell your collateral into thin order books.
Their own market makers scoop up panic liquidity at discounts.
Then the price “recovers” 30–40 % like nothing happened.
It’s not volatility — it’s profit harvesting disguised as market action.
🧮 “But It’s the Trader’s Fault, Right?”
That’s the official line.
They’ll say, “You were liquidated because you took too much risk.”
But here’s what nobody explains:
Your liquidation price often triggers before your stop-loss — sometimes way before.
Let’s say you open a position with $100 using 50× leverage.
Your exposure is $5 000.
You’d expect to only lose that $100 if the market moves 2 %.
Instead, the exchange liquidates you when your position drops about 75 % of your margin,
so you’re wiped out on a 1.5–2 % move — while the chart barely twitches.
Now compound this:
If you scale or DCA into a trade, the liquidation engine recalculates your threshold even closer —
often within 10–15 % of normal price action.
Meaning your trade could still have equity left, but the exchange force-closes it,
sells it into the book, and keeps the rest.
And here’s the question no one dares to ask:
👉 If these exchanges have AI, algorithms, and “smart risk engines,”
why don’t they auto-close your position when you’re down 10–15 % and just take the loss?
Why do they wait until liquidation — when the trader loses 100 % and the exchange keeps the remainder?
Where does that extra money go?
It doesn’t vanish.
It’s absorbed by the exchange’s insurance and profit pools — the same ones that market makers draw from.
In other words, they could have saved you at minus 15 %,
but they chose to liquidate you at minus 100 % because it pays them better.
That’s not a trading platform.
That’s a profit engine disguised as protection.
(in Part 3 we will examine a lot more closely into this and other factors like how order books work and WHO sets them UP!!!!)
🩸 Small Leverage, Big Losses
People think “2× or 3× is safe.”
It wasn’t.
Friday proved that even low leverage isn’t safe when the exchange controls the price feed.
We saw NASDAQ:ATOM , NYSE:PUMP , and others hit zero ticks on Binance.
That’s not a market event — that’s a systemic failure or an engineered flush.
One trader lost $135 K at 2×.
Another lost $1.5 M at 3×.
These aren’t degens — they’re victims of a broken system.
💬 Community Voices Demanding Answers
Even the Turkish crypto community (and I'm 100% Greek by the way) publicly asked CZ:
“How can altcoins crash 90 % in seconds when no one sold?
How can prices nuke without real volume?
And why did tokens not listed on exchanges stay safe?”
These are valid questions.
And Binance, Bybit, MEXC and the rest — owe us PROPER answers.
🧾 The Yi He Statement
Yi He, co-founder and Chief Customer Service Officer of Binance — the public face of the company after CZ — finally spoke.
She said:
“We’ll address losses case-by-case.
We won’t compensate for price fluctuations or unrealized losses.”
Now, read that carefully.
Translation: We hold the money and decide who gets it back.
If Binance can “compensate,” that means the liquidated funds didn’t vanish — they were captured and are still inside the system.
And that raises the obvious question:
👉 Where does all that liquidation money actually go?
Yi He’s post feels like the moment when you lose at a casino, the dealer miscounts the chips, and management says, “Don’t worry, we’ll review your case individually.”
You know the money never left the casino.
So is it the same here?
Do the exchanges hold these funds?
How are they redistributed?
We need clear answers — from Yi He herself, from CZ, and from every exchange that claims to be transparent.
It’s time they step forward and explain how these liquidation systems truly work — because people lost life savings, and silence isn’t customer service.
⚙️ The Mechanics Behind the Scenes
1️⃣ When you’re liquidated, your collateral is sold instantly into the order book.
2️⃣ That money moves into the exchange’s insurance fund.
3️⃣ The insurance fund feeds market makers to “stabilize” prices.
4️⃣ The exchange earns fees on each loop.
It’s a closed system where every loss feeds their balance sheet.
🧯 The Verdict
-Friday’s crash wasn’t a bug.
-It was a business model.
-A perfect harvest executed in 24 hours.
While millions lost life savings, exchanges collected fees, spreads, and collateral — and then tweeted “systems functioned normally.”
Until there’s transparency on liquidation flows, public insurance fund audits, and a ban on exchange-owned market makers, this will happen again.
💙 Final Word
To every retail trader who lost money on Friday — you weren’t reckless.
You were caught in a system designed to protect itself first and you last.
This is only Part 1 of The Problem With Crypto.
There will be at least two more parts, because this story runs far deeper than one flash crash.
I originally planned to release this series at the end of October,
but what happened on Friday forced me to start early.
The truth couldn’t wait.
Part 2 will dive into the unregulated, decentralized perpetual DEXs —
names like Aster, Hyperliquid, and others — platforms offering anonymity to insider traders and quietly damaging the market from multiple angles.
Part 3 will expose the market-maker cartels and their connections to the exchanges,
showing how price control and “liquidity partnerships” have become the hidden layer of manipulation behind every listing.
But it won’t end in darkness.
Because every cycle — like in the ancient Greek tragedies — follows the same path:
Ύβρις → Άτη → Νέμεσις → Κάθαρσις
(Hubris → Delusion → Retribution → Catharsis)
We’re living through Νέμεσις now — the correction phase.
The arrogance, the greed, the manipulation — they’re being exposed.
And what comes next is Κάθαρσις — purification and renewal.
That’s where the good side of crypto will rise again:
cleaner, fairer, more transparent.
Crypto doesn’t need to burn — it just needs to evolve.
And it will.
👉There are some truths I can’t fully share here — TradingView has its limits
and I’ve been banned before for saying too much or crossing lines. (can't advertise and sharing links might appear like that, so i won't risk it, sorry!)
So I’ll explain everything I can’t post here in a separate, long-form video soon (I am allowed to post my links here so follow those).
Stay tuned — because this story is just another day of progress 👩🏫 :
For those who remember my post from November 2022 — “Just another delay: Bitcoin will prevail” —
I’ll say it again, two years later, with even more conviction:
It was never the end.
It was only Nemesis on the way to Catharsis.💙💙💙
Bitcoin — and the real spirit of crypto — will prevail. 💙💙
As for the exchanges: It's your time to get your Token2049 parties aside and start thinking and acting right, like there IS a tomorrow! Start with giving your side of the story, explanations.
One Love,
The FX PROFESSOR 💙
PS. This ATOM to 0.001 chart should first hunt you (👉 你 (nǐ)) — and then it should never happen again in crypto.
The tech is there to make crypto what it’s supposed to be — use it and stop abusing it.
Every problem has a solution. 🔧
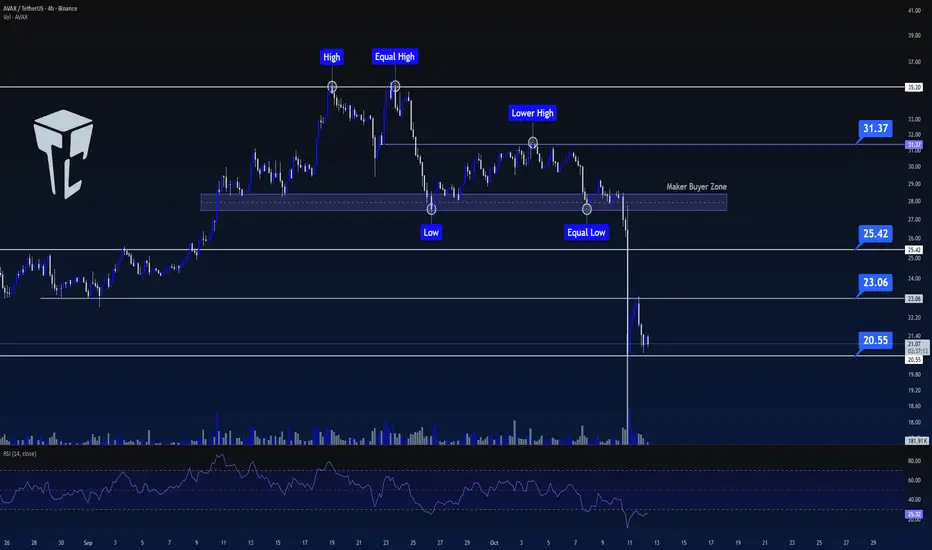
TradeCityPro | AVAXUSDT Further Decline or Time to Rise?👋 Welcome to TradeCityPro Channel!
✨ Let’s move on to Avalanche (AVAX) one of the older coins in the market, mostly active in the DeFi ecosystem with its own network and solid utility. It’s often considered a bull-run project due to its long-term relevance and use cases.
🌐 Overview of Bitcoin
Before we begin, let me remind you that we’ve moved the Bitcoin analysis section to a separate daily report at your request,
so we can go into more detail about Bitcoin’s condition, price action, and dominance:
🕧 In the 4-hour timeframe, after the recent market crash, AVAX is trying to build a new structure and stabilize its price action.
🟢 Long Setup:
It’s still too early to go long, but AVAX has shown a partial recovery compared to other coins, and its drop hasn’t been as deep.
For a long position, we should either range here for a while and enter after a confirmed breakout above 23.04,
Or wait for a higher high and higher low formation to confirm a bullish structure before entering.
🔴 Short Setup:
The short scenario is clear if 20.57 breaks with volume, it would signal bearish continuation, and opening a short position would be reasonable.
📝 Final Thoughts
Stay calm, trade wisely, and let's capture the market's best opportunities!
This analysis reflects our opinions and is not financial advice.
Share your thoughts in the comments, and don’t forget to share this analysis with your friends! ❤️
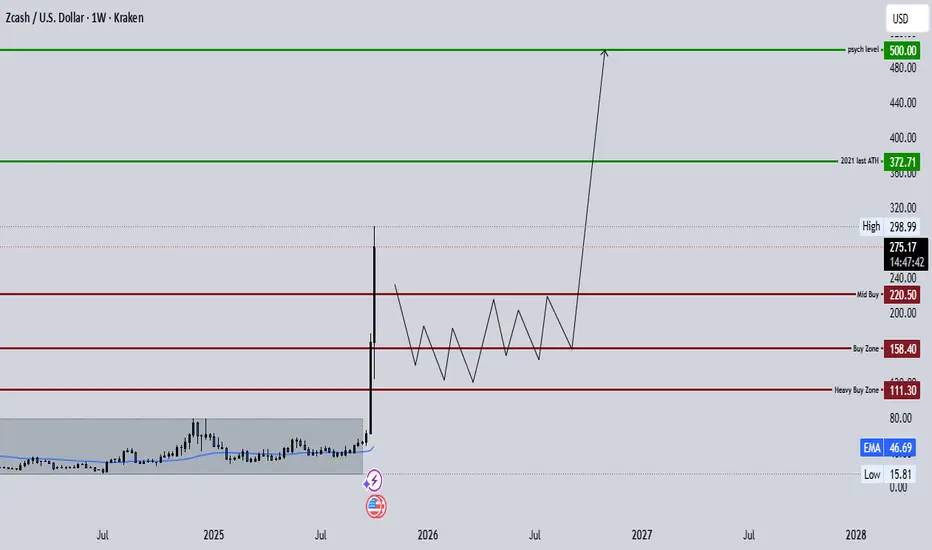
ZEC OutlookZEC is a high-volatility narrative play. Expect a sharp pullback and chop first, then either a long consolidation (accumulation) or a resumed momentum leg if institutional and on-chain flows keep coming.
If we dump then consolidate (most probable short-term)
What it looks like...
Fast selloff into one of these zones, followed by range trading for weeks→months with lower highs, lower volume until bids rebuild.
At $220:
Action: Add a starter tranche (20–30% of intended max ZEC position size).
Confirmation: Look for volume drying then a wick reversal or a range hold on 4H/1D.
Risk: place a tight stop for this tranche (e.g., 18–25% from entry) or trail if price recovers quickly.
At $158 (reload zone)
Action: Add larger tranche (30–40%). This is the main accumulation level if market structure shows support (higher timeframe support, or demand zone).
Confirmation: 4H/1D bullish divergence on RSI or clear balance zone forming.
Risk: stop wider (25–35%) but size up because reward:risk improves.
At $110 (deep value)
Action: Final core buy (30–40%) this is the “we’ll be happy owning heavy” price.
Behavior: treat this like a multi-year core hold level. DCA monthly on any lower ranges.
Risk: If it breaks $110 decisively on high volume, reassess thesis could be systemic liquidity event.
If we just take off from here (momentum continuation)
If momentum confirms, scale in small additions on pullbacks to 20–50 EMA on 4H as new entries.
Convert some planned DCA tranches into quick swing buys (smaller size) because risk of blow-off is real.
Be prepared to sell first resistance band ($372) into strength. momentum often fakes one break then sells the top.
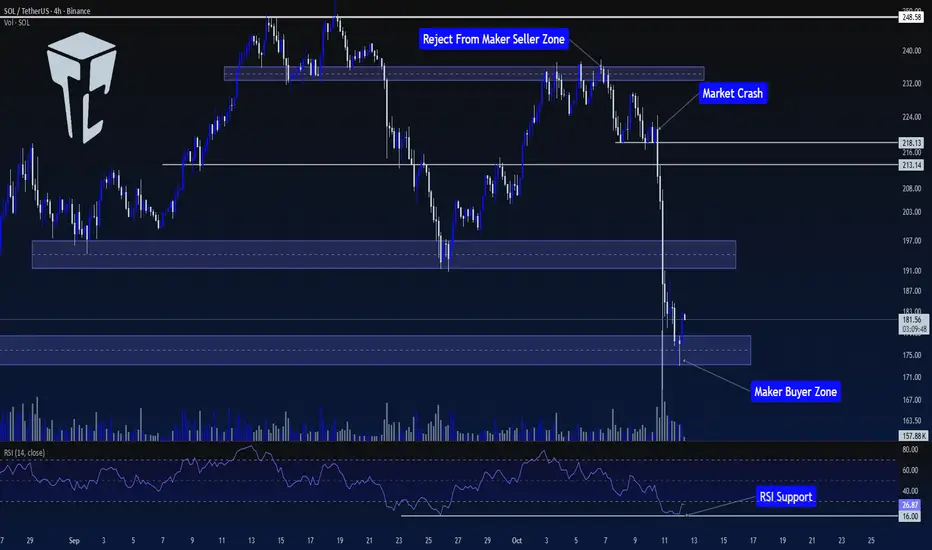
TradeCityPro | SOL: Market Calms After Sharp Move & RSI Support👋 Welcome to TradeCityPro!
Let’s analyze SOL, one of the most popular Ethereum killers with a market cap of $99.9 billion, currently ranking 6th on CoinMarketCap.
⏳ 4-Hour Timeframe
In the previous analysis, we had a Maker Buyer zone around $235. In that analysis, I mentioned that breaking this zone would be an early trigger for breaking $248.58.
🔍 However, the price never managed to sustain above this level, and after getting rejected from this zone, the price entered a corrective phase, forming a support at $218.13.
📊 After the price bounced from $218.13 for the first time, it failed to set a new high in line with previous highs and instead formed a lower high. The price returned to $218.13 again.
✔️ With the breakout of this level, coinciding with news between China and the U.S., the price started a sharp downward move, breaking through the $213.14 support.
✨ Over the course of 2-3 candles, SOL made a sharp move towards the first Maker Buyer zone, breaking it and reaching the second Maker Buyer zone.
💫 Naturally, there was a significant increase in selling volume during this move, and RSI dropped to 16, where it found support.
🧩 Currently, the market seems to have calmed down, with RSI still in the Oversell zone, but volatility has significantly decreased.
💡 Although the market has calmed, I believe the price needs to build a more structured setup before finding valid triggers, and the market conditions are not ideal for opening positions right now.
💥 So, for now, I won’t provide any triggers on this coin and will wait for more structure to form before making a better decision to open a position.
📝 Final Thoughts
Stay calm, trade wisely, and let's capture the market's best opportunities!
This analysis reflects our opinions and is not financial advice.
Share your thoughts in the comments, and don’t forget to share this analysis with your friends! ❤️
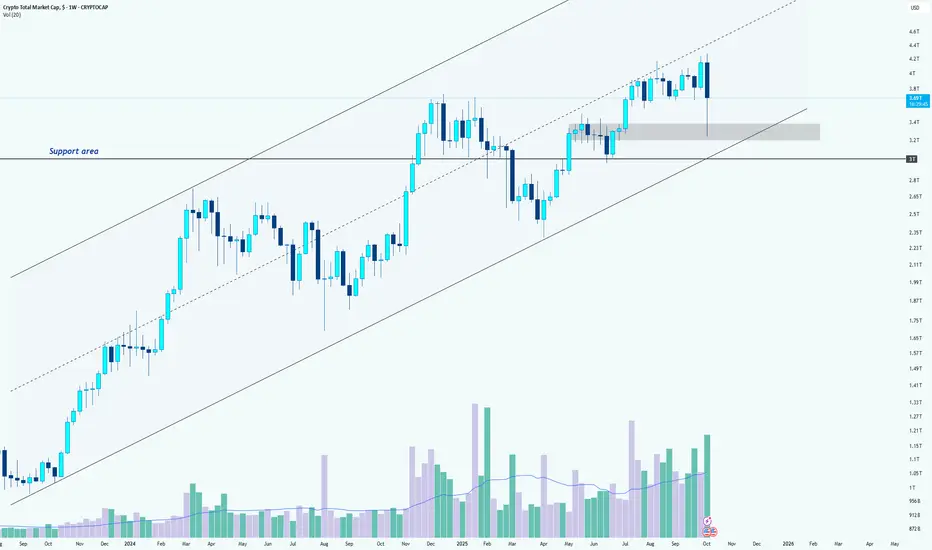
Crypto Total Market Cap AnalysisHi Team!
The crypto market continues to show impressive strength, maintaining its position inside the long-term ascending channel. Despite the recent correction, the overall structure remains bullish as long as the lower boundary of this channel holds.
After facing resistance near the upper line of the channel, the total market cap experienced a healthy pullback, which brought it close to the mid-zone of the structure. Buyers stepped in strongly from that area, suggesting that market participants still see dips as opportunities rather than warning signs.
The key support zone lies between 3.1T and 2.84T USD, a region that has acted as both a breakout base and a demand area in the past. As long as this zone remains intact, the broader bullish momentum is likely to continue, keeping the medium- to long-term outlook positive.
If price action stays within the rising channel and the 2.84T support area holds, the total crypto market cap could soon retest the upper trendline, potentially pushing toward new highs.
However, a confirmed breakdown below 2.84T would signal a shift in structure, opening the door to a deeper correction phase.
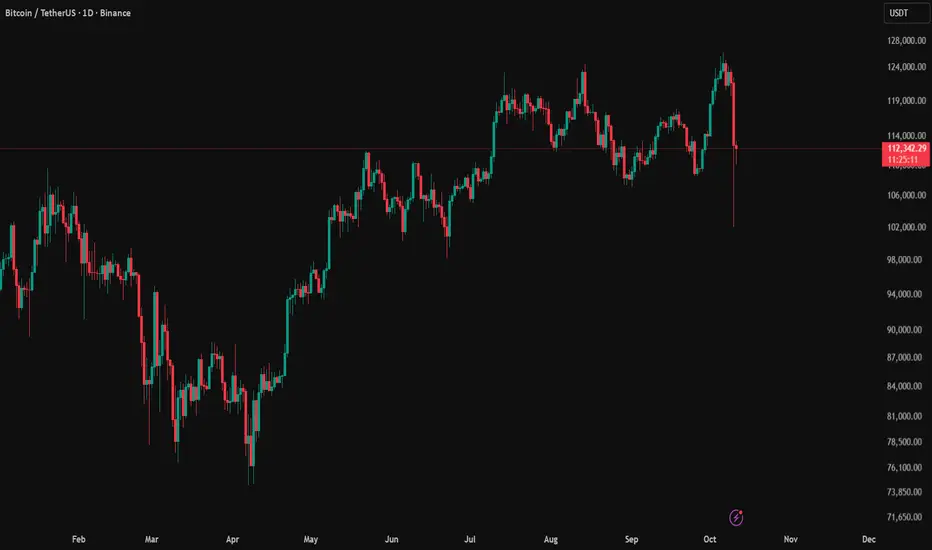
Continuously making HH HLBTC Analysis
CMP 112510.14 (12-10-2025 02:58AM PST)
Continuously making HH HL & is Still Bullish in the
longer run.
as shared on 02-06-2025, Cup & Handle Target hit
around 115000 - 120000 & then dropped.
3 Important Support levels are :
S1 around 108000 - 108450
S2 around 95000 - 95200
S3 around 86000 - 86500
S2 seems to be a Stronger Support as this range is
also around Channel Bottom.
Upside Targets seems to be around 132000 - 132300
initially.
BTC seem safe as long as it stays above 74000; if it
breaks this level, we may witness trend reversal.

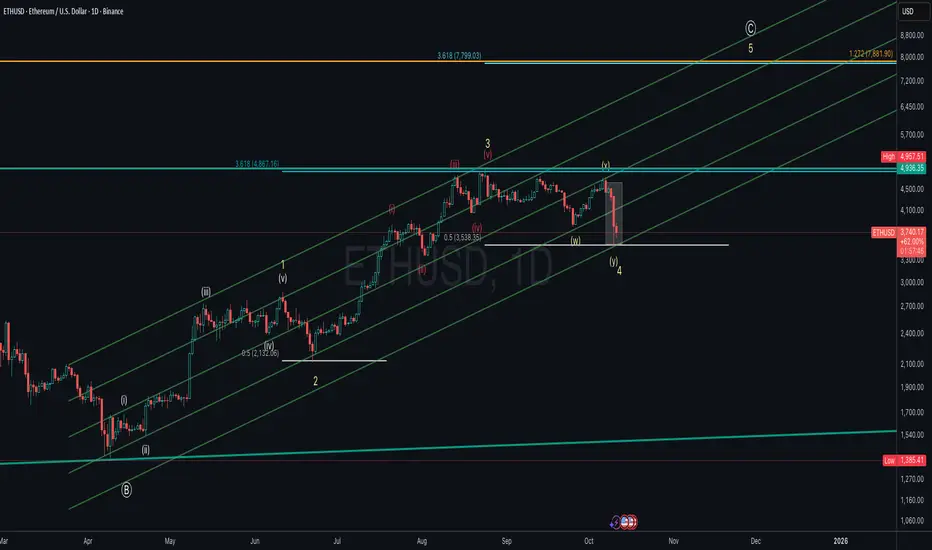
ETHUSD – Wave 4 Correction Near Completion? Preparing for the FiEthereum (ETHUSD, Log Mode) appears to be completing a Wave 4 corrective structure (W–X–Y) within the broader impulsive cycle from the March lows.
Wave 4 found strong support near the 0.5 retracement level around $3,500, aligning with the lower parallel channel of the wave 3 advance.
A potential Wave 5 rally could begin once confirmation of reversal is seen, with upside targets projected at:
$4,867 (3.618 extension of Wave 1)
$7,800–$7,900 (1.272 extension of the macro structure)
If ETH breaks below $3,500, it could invalidate this immediate bullish count and suggest a deeper correction.
Key Levels:
Support: $3,530 / $3,350
Resistance: $4,867 / $7,800
Invalidation: Below $3,500
Watching for signs of a Wave 4 bottom to confirm the start of Wave 5, potentially leading Ethereum into new all-time-high territory in the coming months.
Bitcoin 130,000 – Correction AheadBitcoin
Around the $130,000 level, there is a possibility of a deep correction toward the $74,000 zone.
Do not panic, and do not get carried away by emotions.
This is the market — it plays with your psychology.
The market is geometric. BYBIT:BTCUSDT

LINK FOR BUYHello friends
After a long time of suffering, Link finally made a move and collected good liquidity that can make it prone to good growth. And the safest way, as I always tell you, is to buy in stages and with respect to capital and risk management.
The goals are also clear
*Trade safely with us*

BITCOIN !!!Hello friends
Given the good decline we had, a good opportunity was provided to buy at good prices with capital and risk management and in steps and move to the specified goals.
There was good liquidity at the bottom that was collected, now we can expect a good growth.
*Trade safely with us*

TradeCityPro | Bitcoin Daily Analysis #193👋 Welcome to TradeCity Pro!
Let’s analyze Bitcoin, yesterday, a phenomenon called a Flash Crash occurred, and the market experienced a massive drop. Let’s review what happened and where the market stands now.
⏳ 4-Hour Timeframe
Before diving into the chart, let’s first understand what happened in the broader market.
🔍 Yesterday, the U.S. restricted the sale of certain computer chips to China,
and in response, China halted exports of five rare elements to the U.S.
📰 Then, the U.S. reimposed heavy tariffs on China, and China raised duties on American ships.
✨ These escalating tensions severely impacted global markets — and we witnessed the largest Flash Crash in Bitcoin’s history.
📉 A total of $19 billion worth of positions were liquidated, marking the highest figure ever recorded in crypto history.
To put that into perspective, during the COVID crash, only about $3 billion was liquidated — a massive difference.
🔔 Interestingly, Bitcoin dropped less compared to most altcoins and managed to recover partially.
However, altcoins like TON, AVAX, ARB, and SUI (each with their own networks) saw brutal crashes, many with wicks of 60–70% downward.
📊 Now, looking at the chart, yesterday, Bitcoin was ranging above the $120,835 zone.
🧮 Once the geopolitical tension began, the price started a strong downward move, breaking below its key support.
🔽 After two large red candles and a close below support, the third candle formed a 12% wick, dropping as low as $102,000.
✔️ Following that, the price quickly recovered and is now consolidating above the $109,000 support zone.
💡 At the moment, in such a highly volatile environment, finding valid triggers and opening new positions isn’t ideal.
🔑 The price action has been driven mostly by news and panic, so it’s best to wait until the market stabilizes and the effects of these developments fade away.
❌ Disclaimer ❌
Trading futures is highly risky and dangerous. If you're not an expert, these triggers may not be suitable for you. You should first learn risk and capital management. You can also use the educational content from this channel.
Finally, these triggers reflect my personal opinions on price action, and the market may move completely against this analysis. So, do your own research before opening any position.

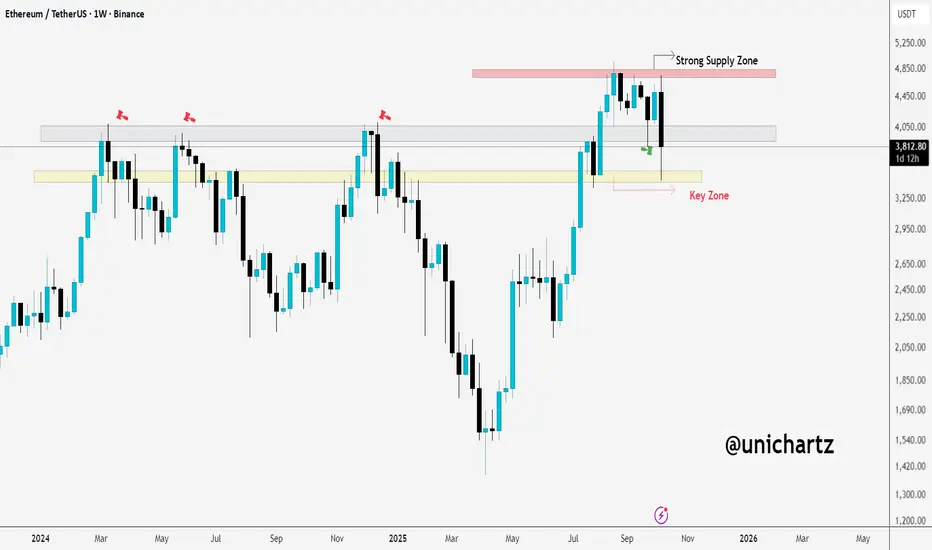
ETH in Danger: Breaking Below $3,200 Could Signal Bigger DropCRYPTOCAP:ETH is facing rejection from the strong supply zone around $4,800. The weekly candle failed to hold above that level and is now pulling back towards the key demand zone between $3,200–$3,300.
If the price fails to reclaim this support, we could see a more bearish scenario unfolding.
DYOR, NFA
Thanks for the reading
Descriptions about the market! Read the caption!Given Mr. Trump's remarks and the unprecedented crash in cryptocurrencies, I must say this individual significantly harms markets, especially investors. Imposing a 100% tariff on Chinese goods essentially means "we want no trade with you," which is fundamentally unfeasible. The United States and China will undoubtedly negotiate. However, our main focus here is the financial market collapse. This decline isn’t merely about falling prices—it goes beyond that. The core issue is the loss of market trust and credibility. Once confidence is broken, it is difficult to restore and may take a long time.
In any case, I felt it was my duty to bring this up and remind you to stay composed. Never forget to use stop-losses in your trades and practice proper capital management.
If needed, you can always message me on this platform for advice.
NOTE: This post is This post is educational.
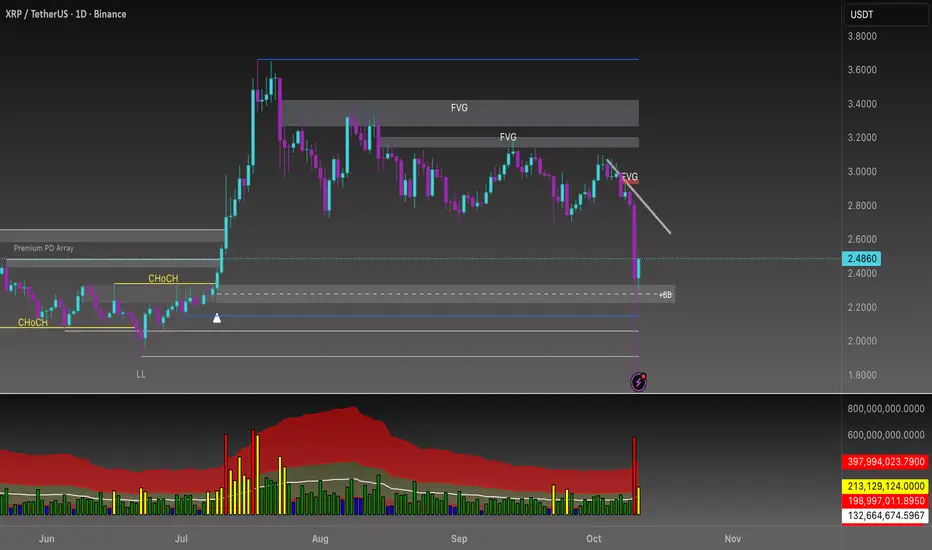
Beyond the Chart - XRP AltCoin Market AnalysisThe trendline I previously drew for BINANCE:XRPUSDT continues to hold strong. 💪
Price has formed a Breaker Block around 2.2900, and I expect a correction toward the trendline 🎯first targeting the 2.7294 area.
XRP’s reaction here will decide the next phase:
• 📈 If a bullish candle closes above the trendline, my next target will be the upper FVG zone.
• 📉 If a bearish candle closes below it, I’ll be watching the 2.3021 area as the next downside target.
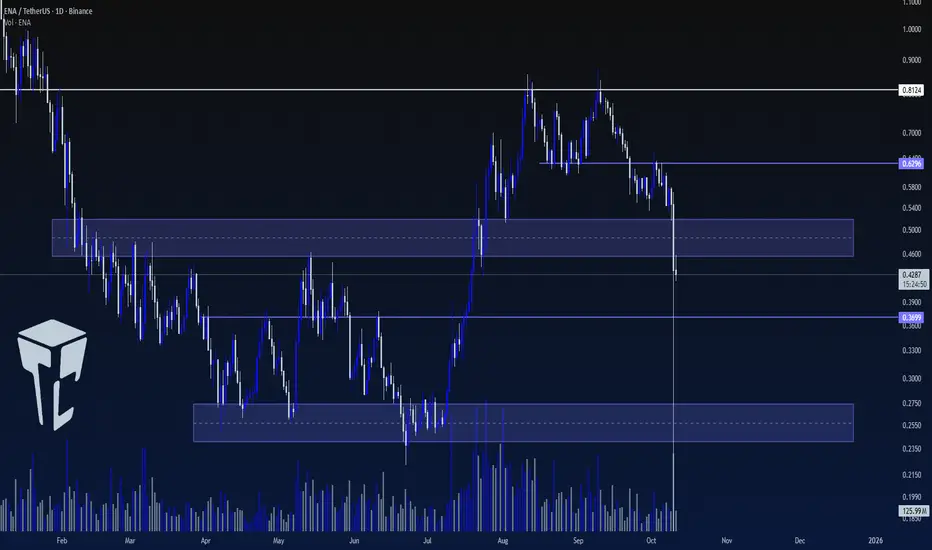
TradeCityPro | ENA: Market Shake-Off and Support Rebuild Zone👋 Welcome to TradeCity Pro!
In this analysis, I’ll review ENA, one of the DeFi projects that currently holds a market cap of $3.02 billion, ranking 36th on CoinMarketCap.
📅 Daily Timeframe
First, let’s take a look at the market as a whole — yesterday, some extremely unusual events occurred, which I’ll explain in detail in Bitcoin’s analysis.
✨ For now, the result of these events has been a sharp market decline, which has also affected this coin. ENA has now stabilized below the $0.5 support zone and printed a very long shadow to much lower levels.
🔍 Currently, the price is far below its last major high at $0.8124 and has formed a lower high at $0.6296.
✔️ There was a support zone around $0.5, but since the price has closed below it, the next key support lies at $0.3699.
📊 The final strong support zone is around $0.25, which is considered ENA’s main support level.
💥 For now, it’s better to stay on the sidelines and wait for the market to build a new structure. The recent move was highly emotional and volatile, making it difficult to accurately interpret the market’s behavior at the moment.
📝 Final Thoughts
Stay calm, trade wisely, and let's capture the market's best opportunities!
This analysis reflects our opinions and is not financial advice.
Share your thoughts in the comments, and don’t forget to share this analysis with your friends! ❤️
DOGE Looks Bearish (1D)We tried to show the waves from a larger perspective so you can have a better understanding of the path.
It seems that wave "B" of the higher-degree correction has been completed (wave B was a bullish phase), and now we are entering wave "C", which is bearish at a higher degree.
With the price pulling back toward the red zone, we can look for sell/short positions.
On the chart, there is a liquidity pool marked with "$$$", and the first target of this bearish move is to sweep that liquidity pool.
A daily candle closing above the invalidation level will invalidate this analysis.
For risk management, please don't forget stop loss and capital management
When we reach the first target, save some profit and then change the stop to entry
Comment if you have any questions
Thank You

Q-USDT SHORT FULL TARGET BOOOOOOM Hello friends 😍😍
💁♂️ Another great analysis
Let's see together a great update of the Q-USDT cryptocurrency that touched all the targets
🔥🔥🔥It fell from a little above the blue area that I specified and then touched all three targets with a 73.5% drop. What's better than this? 🔥🔥🔥
Has anyone used this analysis?
⚠️ None of the analysis is a recommendation to buy or sell, but simply my personal opinions on the charts. You can use the charts and choose any that interest you and take a position if you wish.
To support me, I would appreciate it if you boost the analysis and share it with your friends so that I can analyze it with more energy for you, my dears. Thank you all. 💖
