TradeCityPro | Bitcoin Daily Analysis #192👋 Welcome to TradeCity Pro!
Let's dive into Bitcoin analysis. Today, Bitcoin is still in a consolidation and range-bound phase. Let’s take a look at the current market conditions.
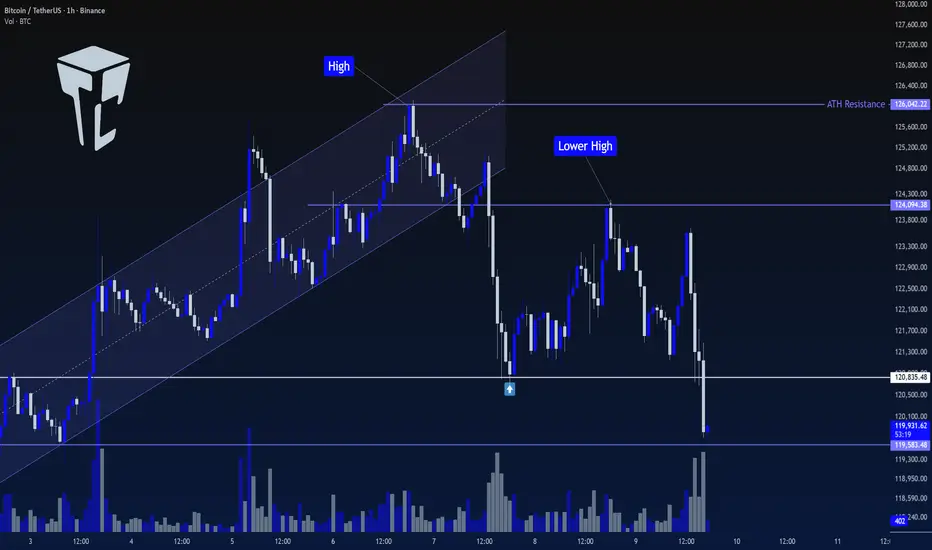
⏳ 1-Hour Timeframe
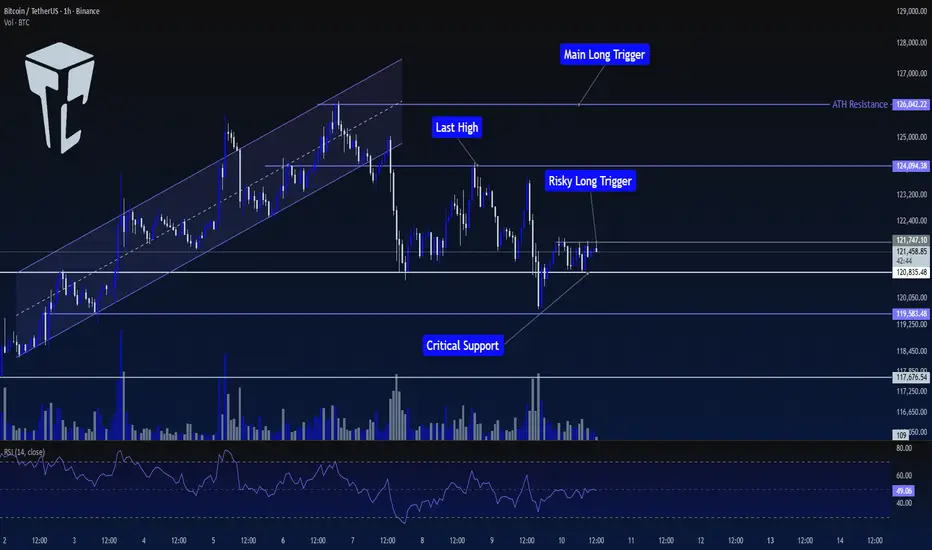
In yesterday’s analysis, Bitcoin was in the process of breaking the $120,835 level. I mentioned that I wasn't opening any short positions yet, but a rejection of this downward movement could be a good sign for a potential upward move.
⭐ This scenario played out, and the price has now moved back above $120,835, which gives us an opportunity to look for long triggers.
✔️ One trigger that has formed is $121,747, which can be used as a risky trigger for a long position.
📊 Market volume has decreased slightly, so it’s better to wait for an increase in volume when this level is broken, as that would raise the likelihood of an upward move.
📈 The next reliable long triggers we have are $124,094 and $126,042. These triggers are more reliable for a position, but they are currently farther from the price, so the chance of them activating today is lower.
💥 For short positions, I'm still not focusing on them and prefer to focus on long positions. Therefore, I currently don’t have any short triggers to provide.
❌ Disclaimer ❌
Trading futures is highly risky and dangerous. If you're not an expert, these triggers may not be suitable for you. You should first learn risk and capital management. You can also use the educational content from this channel.
Finally, these triggers reflect my personal opinions on price action, and the market may move completely against this analysis. So, do your own research before opening any position.
Cryptomarket
TradeCityPro | NEAR: Breakout Opportunity and Potential Uptrend👋 Welcome to TradeCity Pro!
In this analysis, I’ll review NEAR, one of the Layer 1 and AI crypto projects, with a market cap of $3.9 billion, currently ranked 35th on CoinMarketCap.
⏳ 4-Hour Timeframe
This coin is showing an upward trend against Bitcoin and is currently in a very important resistance zone.
✨ Since being supported at the $2.589 level, the price has reacted multiple times to this zone, and it has formed a higher low at $2.832.
📊 At present, the price is engaged with a supply zone, which it has encountered several times, and is now reaching it again with increased buying volume.
🎲 Breaking this resistance zone will initiate a new upward move for this coin. The main trigger for confirming this move is a break at $3.211.
✔️ We can use the $3.211 break as a trigger for a long position on this coin. Additionally, if the RSI enters Overbuy, the upward movement could become much sharper and more volatile.
📝 Final Thoughts
Stay calm, trade wisely, and let's capture the market's best opportunities!
This analysis reflects our opinions and is not financial advice.
Share your thoughts in the comments, and don’t forget to share this analysis with your friends! ❤️

Bitcoin Testing Critical Zone🔥 Bitcoin Testing Critical Zone 🔥
BTC is currently moving inside the “mid-range” between major support and resistance levels. The current price at $121,570 hasn’t broken above or below yet. This shows the market is waiting for its next move. 👀
📊 Key Levels:
Resistance: $123,934 ➝ if it breaks, a push toward $125–126K is very likely.
Support: $120,133 ➝ if it breaks down, next strong support is around $117K. If that fails too, price may drop to $108K.
EMA200 is still acting as the lower shield. As long as price stays above it, the bigger trend remains healthy.
📉 Stochastic RSI is pointing downward, meaning short-term momentum is weakening a bit. But thick volume between $117K–$120K shows many buyers waiting below.
⚔️ In short:
Break above ➝ fast rally potential.
Break below ➝ sharp drop toward lower support.
The market is quiet before the storm. Whoever reads the move early gets the edge. 😎
#Bitcoin #BTC #Crypto #Trading #MCCChart #mccapaitu

$ETH Performing Ascending Channel
An ascending channel, or rising channel, is a chart pattern used in technical analysis to identify a security's ongoing uptrend. It is characterized by the price fluctuating between two parallel, upward-sloping trendlines.
Key components
Higher highs and higher lows:
The price consistently makes higher swing highs and higher swing lows over a period of time, indicating steady bullish momentum.
Parallel trendlines:
Two parallel lines are drawn to frame the price action.
Upper line (resistance):
Connects the higher swing highs. It represents the point where selling pressure is strong enough to temporarily stop the price from rising.
Lower line (support):
Connects the higher swing lows. This line indicates where buying pressure is strong enough to prevent the price from falling further.

BTCUSDTHello Traders! 👋
What are your thoughts on BITCOIN?
Bitcoin reached a new all-time high earlier this week but failed to hold above it, leading to a rejection and a short-term corrective phase.
The price is now undergoing a healthy pullback, and we expect the correction to continue until the previous breakout zone is retested.
Once this pullback completes, Bitcoin may resume its upward momentum and attempt to form a new higher high.
The broader trend remains bullish, and this correction is viewed as a buying opportunity within the ongoing uptrend.
Don’t forget to like and share your thoughts in the comments! ❤️

Bearish drop off?Ethereum (ETH/USD) is rising towards the pivot, which is a pullback resistance and could reverse to the 61.8% Fibonacci retracement.
Pivot: 4,422.34
1st Support: 4,129.91
1st Resistance: 4,566.08
Disclaimer:
The above opinions given constitute general market commentary, and do not constitute the opinion or advice of IC Markets or any form of personal or investment advice.
Any opinions, news, research, analyses, prices, other information, or links to third-party sites contained on this website are provided on an "as-is" basis, are intended only to be informative, is not an advice nor a recommendation, nor research, or a record of our trading prices, or an offer of, or solicitation for a transaction in any financial instrument and thus should not be treated as such. The information provided does not involve any specific investment objectives, financial situation and needs of any specific person who may receive it. Please be aware, that past performance is not a reliable indicator of future performance and/or results. Past Performance or Forward-looking scenarios based upon the reasonable beliefs of the third-party provider are not a guarantee of future performance. Actual results may differ materially from those anticipated in forward-looking or past performance statements. IC Markets makes no representation or warranty and assumes no liability as to the accuracy or completeness of the information provided, nor any loss arising from any investment based on a recommendation, forecast or any information supplied by any third-party.

XRP Daily – Can the 0.236 Fib Hold Again?XRP Daily – Testing Support at the 0.236 Fib Level
XRP is once again trading in the green support area that has held since the beginning of August.
This zone aligns with the 0.236 Fibonacci level and forms the base of a descending triangle, with the series of lower highs creating its upper boundary.
Price has also lost the 50MA, and from a system perspective, the structure confirms a short-term downtrend, with Price < MLR < SMA < BBcenter.
If this triangle breaks to the downside, the next significant support sits at the 200MA at $2.60.
Momentum indicators remain weak:
RSI is below its moving average and trending downward, while MACD has already turned red, showing fading strength.
With the broader market showing signs of consolidation after BTC ATH,
XRP reaction here could reveal how altcoins handle pressure at key supports.
For now, this support zone remains key; losing it would confirm a bearish breakout from the triangle pattern.
Bias: Short-term bearish, watching the 0.236 Fib and 200MA as critical levels for reaction.
Always take profits and manage risk.
Interaction is welcome.

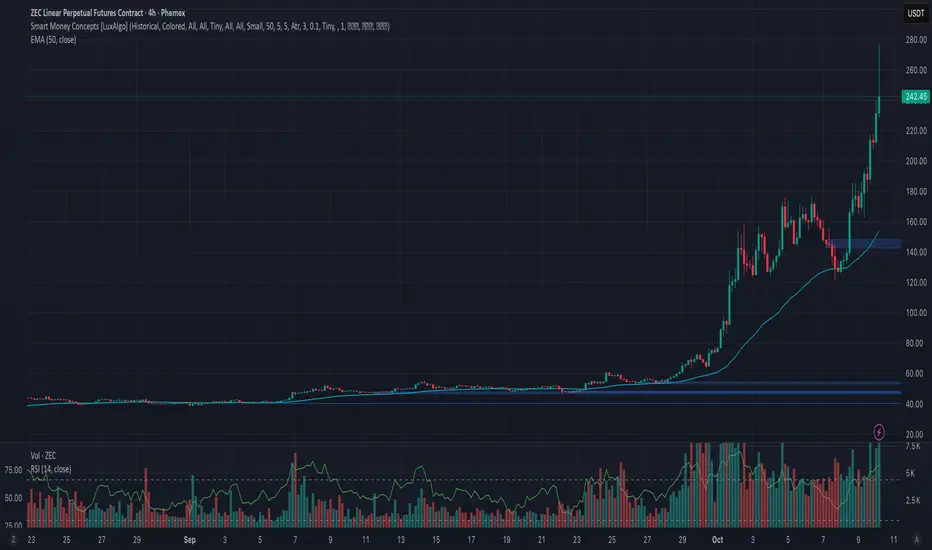
Phemex Analysis #108: ZCash (ZEC) Went Parabolic—Is $300 Next?In a matter of weeks, PHEMEX:ZECUSDT.P ripped from the double-digits into the mid-$200s, putting privacy coins squarely back in focus. As of now, ZEC hovers near $245–$260, with an intraday range that’s stretched as high as the upper-$270s—the kind of wide tape that rewards disciplined plans and punishes hesitation.
With momentum heated and volatility elevated, here’s a clear if/then map for the next leg.
Possible Scenarios
1) Bullish Continuation — squeeze through the high-$260s, eyes on $277 → $300
What to watch: A decisive push back through $260–$270 with rising volume. That reclaims the top of today’s range and puts the $277 spike back in play; above there, round-number gravity favors a $300 test.
Pro Tips:
Entry: Add on a strong 1H/4H close > $268–$270, or a break-and-retest that holds.
Risk: Initial stop just below the reclaimed zone (e.g., $255–$258).
Targets: $277 (recent peak), then stagger into $295–$305 if momentum persists.
2) Retest & Accumulation — cool off into $210–$230, rebuild for another run
What to watch: A controlled pullback (shrinking candles, softer volume) into $230 or as deep as $210–$215. This lets funding reset and late longs get flushed without breaking market structure.
Pro Tips:
Entry: Scale bids near $230 → $215 only if selling pressure is waning.
Risk: Place protective stops a tier below your lowest ladder (e.g., $204–$206).
Re-trigger: Re-add on a reclaim of $240–$245 with volume.
3) Bearish Reversal — lose $210 on heavy sell volume, open a slide to $185 → $168
What to watch: A daily close under $210 with expanding volume, turning today’s lower bound into resistance. That exposes $185 (prior congestion) and even the mid-$160s (today’s intraday low region) in a sharper unwind.
Pro Tips:
Defense first: Cut risk on a decisive break < $210.
Patience: Don’t knife-catch; look for capitulation (wide wick + volume spike) then base-building before re-entries.
Invalidation to flip long: Strong reclaim of $210–$215 after the flush, with momentum divergences.
Conclusion
ZEC’s tape is hot, the ranges are wide, and the levels are clean. Trade what the market gives you:
If the high-$260s break and hold → ride the $277 retest, then stalk $300.
If we cool into $230–$215 on light volume → consider accumulation for the next push.
If $210 snaps on heavy selling → stand aside and wait for $185 → $168 stabilization.
Stay nimble, size sanely, and let the levels—not the adrenaline—drive your decisions.
🔥 Tips:
Armed Your Trading Arsenal with advanced tools like multiple watchlists, basket orders, and real-time strategy adjustments at Phemex. Our USDT-based scaled orders give you precise control over your risk, while iceberg orders provide stealthy execution.
Disclaimer: This is NOT financial or investment advice. Please conduct your own research (DYOR). Phemex is not responsible, directly or indirectly, for any damage or loss incurred or claimed to be caused by or in association with the use of or reliance on any content, goods, or services mentioned in this article.
WLFI Daily – Key Support Broken After Multiple HoldsWLFI Daily – Losing Key Support at the 0.5 Level
WLFI has lost the 0.5 Fibonacci level at 0.1798, a support zone that held multiple times: first during the early September TGE dump, and again on October 7 and 8.
Yesterday, October 9, marked the first daily close below this level, and today price continues to trade under it.
Unless WLFI manages to reclaim 0.1798 by today’s close, the downtrend is likely to continue.
From a system perspective, momentum remains bearish:
Price < MLR < SMA < BB Center, confirming a short-term downtrend.
The next possible support lies around the dotted line, but a retest of the 0 Fib level at 0.1611 looks increasingly likely if weakness persists.
The broader market has shown early signs of cooling after BTC’s ATH, and WLFI’s price action is now reflecting that shift in sentiment.
At this stage, risk management is essential, catching a falling market without confirmation often leads to deeper drawdowns.
Bias:
Bearish, structure weakening further below 0.5 Fib; watching for reaction near dotted line.
Always take profits and manage risk.
Interaction is welcome.

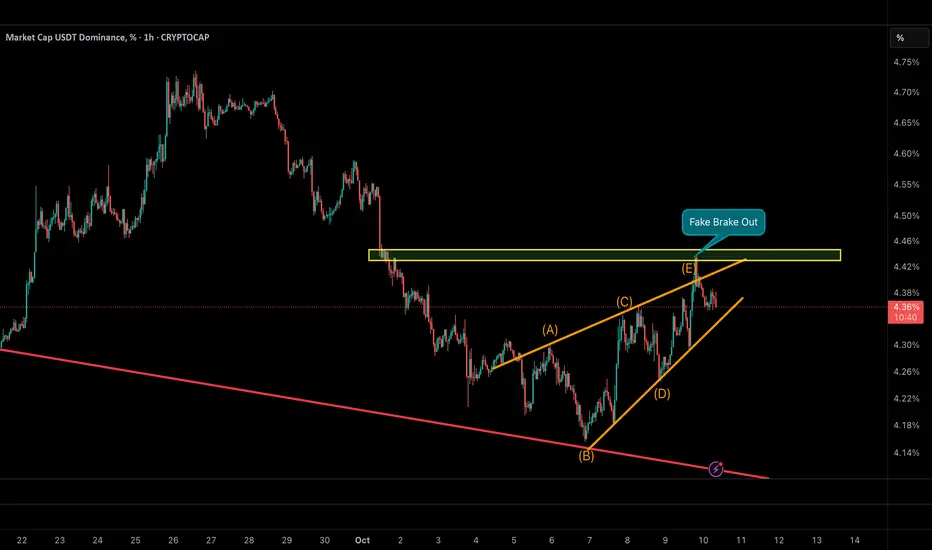
USDT Dominance – Fake Breakout Signals a Potential Altcoin ShiftUSDT Dominance has completed a contracting wedge pattern (A–B–C–D–E), followed by a fake breakout above the key resistance zone near 4.45%.
This move likely trapped late buyers of USDT at liquidity highs.
As long as dominance remains below 4.35%, the probability of a deeper decline toward 4.15–4.20% increases —
which could mark the beginning of capital rotation into altcoins.
In contrast, a confirmed breakout above 4.46% would invalidate this setup and suggest a new sideways phase.
📉 Base Scenario: Continuation of decline toward 4.15–4.20%
🚀 Implication: Growing probability of an upcoming Altseason
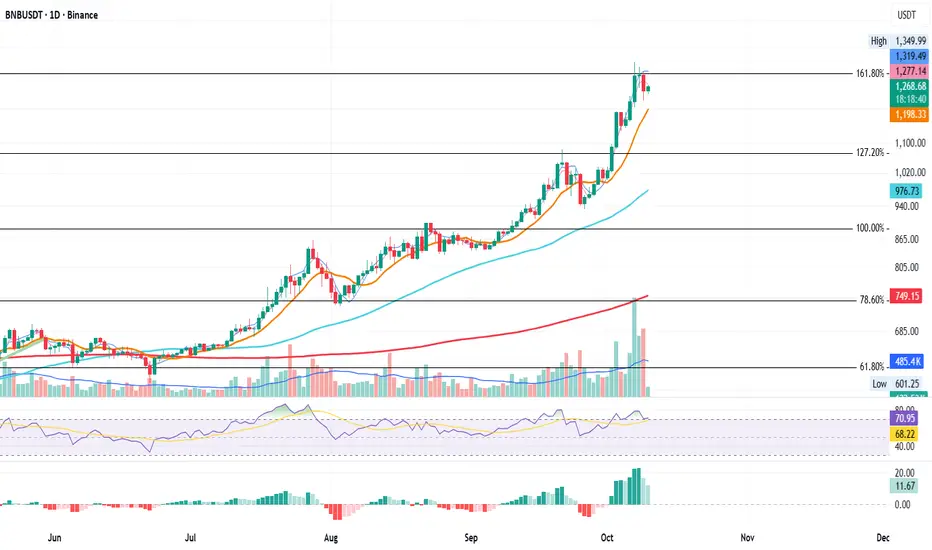
BNB Daily – Between Resistance and ContinuationBNB Daily – After the Run, Testing Its Range
Since July, BNB has delivered an impressive rally. Back then, price was sitting near the 61.8% Fibonacci level, and from there it climbed all the way to a new all-time high at the 161.8% Fib extension, which is now acting as resistance.
On October 7 and 8, intraday moves briefly pushed above this level, but both sessions failed to close above it, leading to a clear rejection on October 9, confirmed by a large downside volume bar.
From a system perspective, the structure remains in an uptrend, with MLR > SMA > Price > BBc
indicating that despite the pullback, the broader bullish structure is still valid.
Key levels to watch:
Resistance: 161.8% Fib at $1310
Support: BB Center (orange) at $1198
If BNB can hold above the BB Center, it keeps the upper hand and could attempt another move toward its ATH.
However, a daily close below the BB Center would shift the short-term momentum bearish, opening room for further downside.
Periods like this often decide whether a move becomes continuation or distribution: patience around key levels pays off.
Bias:
Neutral-bullish — uptrend intact, but watching the BB Center closely for confirmation.
Always take profits and manage risk.
Interaction is welcome.
ETH Daily – Pullback After Rejection, Eyes on 0.5 FibETH Daily – Rejected at the Highs, Searching for Support
ETH was once again rejected from the ATH zone on Monday, October 6, failing to establish a breakout above resistance.
After losing the 50MA, price is now approaching the 0.5 Fibonacci retracement level at $4321, which could serve as the next key support area.
From a system perspective, the structure reads:
Price < SMA < MLR < BB Center — confirming a short-term bearish trend.
Momentum indicators also point to weakness:
RSI has crossed below its moving average, and MACD is starting to turn red.
This pullback mirrors broader market consolidation after BTC’s ATH, showing that ETH remains sensitive to overall liquidity flows.
For now, the short-term bias remains bearish unless price manages to hold the 0.5 Fib support and stabilize around it.
A close above that level would be the first sign of potential recovery.
Always take profits and manage risk.
Interaction is welcome.

KASPA can go much HIGHERAccording to the All time high at $0.19 there is a trendline for 5th wave and that could top out about $0.44 for KASPA

ETH Game Plan – DLRMD ModelETH Game Plan – DLRMD Model
📊 Market Sentiment
The FED has resumed its rate-cutting cycle with a 0.25% cut in September and two more expected in the coming months. Institutional liquidity inflows are accelerating as the U.S. officially adopts crypto as part of its reserves. While inflation remains elevated, a weakening labor market is pushing the FED to ease, channeling more capital into risk-on assets such as crypto.
📈 Technical Analysis
ETH ran the weekly swing low and closed above, signaling a shift in structure. A strong daily structure break followed, forming a fresh daily demand zone. The first tap into this demand zone resulted in a solid rejection — confirming its validity.
Afterward, price briefly deviated above the lower time frame bearish trendline, then retraced back, showing potential accumulation before the next leg up.
📘 Model to be used – HTF Demand w/ Liquidity Run & Max Discount Zone (DLRMD Model)
1-Identify the HTF trend and take setups only in that direction.
2-Mark the active HTF demand zone.
3-Confirm liquidity sweep within that zone.
4-Use Fibonacci retracement to locate the 0.75 max discount area.
5-Wait for LTF confirmation before entering.
📌 Game Plan
I’ll be waiting for price to return and retest the daily demand zone, ideally running the 12H swing liquidity at $4,090 and tapping the 0.75 max discount zone around $4,050 before considering entry.
🎯 Setup Trigger
4H structure break confirmation after price taps the $4,050 level.
📋 Trade Management
Entry: $4,050 (expected zone)
Stoploss: Below the 4H swing low that breaks structure
Targets:
TP1: Bearish trendline retest (≈$4,445)
TP2: All-time high (≈$4,965)
Once TP1 is reached, I’ll move stoploss to breakeven and manage partials actively.
💬 Like, follow, and comment if this breakdown supports your trading! More setups and market insights coming soon — stay connected!
⚠️ Disclaimer: This content is for informational and educational purposes only and does not constitute financial, investment, or trading advice. Always DYOR before making any financial decisions.

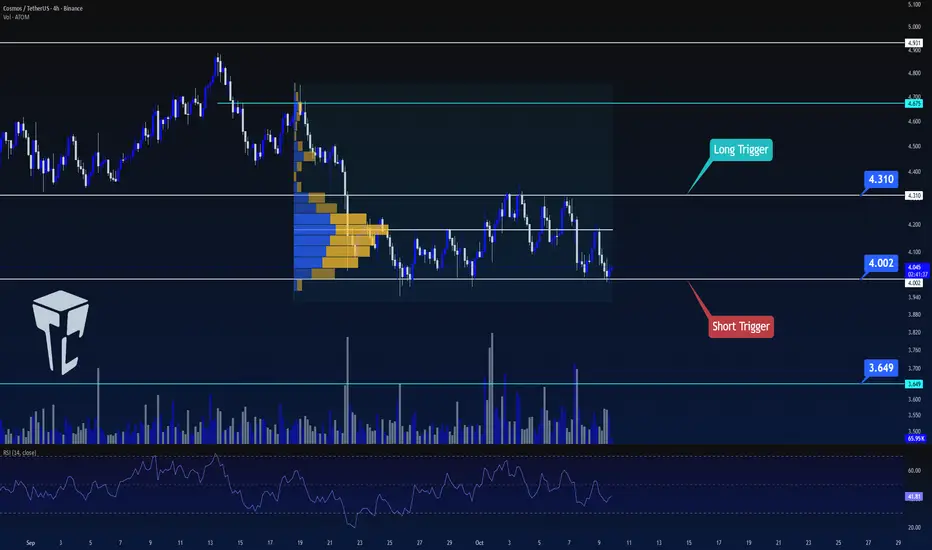
TradeCityPro | ATOMUSDT Ready for a Sharp Drop!👋 Welcome to TradeCityPro Channel!
Let’s analyze ATOM (Cosmos) — one of the older and more established coins in the market. Personally, I’ve been holding and staking this one for quite a while.
🌐 Overview of Bitcoin
Before we begin, let me remind you that we’ve moved the Bitcoin analysis section to a separate daily report at your request, so we can go into more detail about Bitcoin’s condition, price action, and dominance:
📊 Higher Time Frames
On the higher time frames, ATOM has been ranging for a long period of time and interestingly, it has even formed a smaller range inside its main range.
Currently, it’s oscillating near the bottom support of that larger range, showing weakness.
🕓 4H Time Frame
In the 4-hour chart, the price remains stuck inside a range between $4.002 and $4.310.
However, this time it has been rejected from the midline, which increases the likelihood of losing the lower support.
📉 Short Position Setup
If the price breaks below $4.002 with increasing volume and momentum, opening a short position would be completely logical and I’ll personally be taking that short setup as well.
📈 Long Position Setup
For a long position, patience is key.
Other coins like MNT, HYPE, and AVAX currently show stronger bullish potential, but if ATOM breaks above $4.310 and starts forming higher highs and higher lows, we can then begin to shift our bias to bullish.
📝 Final Thoughts
Stay calm, trade wisely, and let's capture the market's best opportunities!
This analysis reflects our opinions and is not financial advice.
Share your thoughts in the comments, and don’t forget to share this analysis with your friends! ❤️
$HYPER Near Demand Zone$HYPER is currently retesting its key support trendline after a steady uptrend.
If this zone holds, a rebound looks likely, but a breakdown could trigger deeper correction toward the S/R zone.
DYOR, NFA

Fartcoin Wyckoff ReaccumulationCRYPTO:FARTCOINUSD looks to be in Wyckoff reaccumulation. Honestly, there’s nothing more to say, the chart speaks for itself.
We’re currently sitting in the spring zone, waiting for a bounce, retest, and move up. In my opinion, that should unfold over the coming months.
The risk here is that the spring I’m seeing might not actually be the spring, in that case, price could go lower. Still, I doubt it breaks below the current low; if it does, I’d say the downside risk sits around $0.5.
The trend is slowly curling upward, and I’m looking at potential targets of:
- Bear case: $2
- Base case: $3
- Bull case: $4

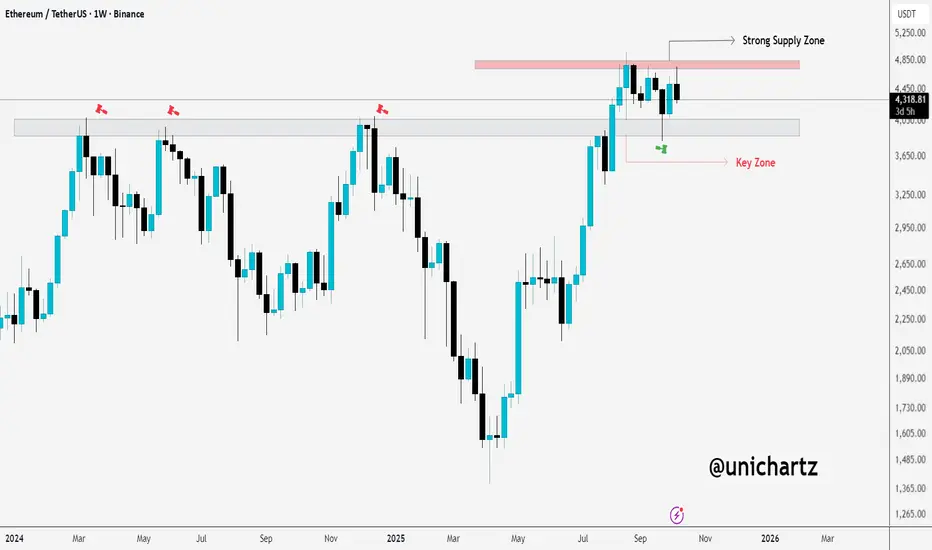
ETH: Critical Levels to Watch Now!The chart shows Ethereum ( CRYPTOCAP:ETH ) on the weekly timeframe, and we're currently at a crucial point. Ethereum is approaching a strong supply zone around $4,800, which has acted as a resistance level in the past. This suggests that the price could face selling pressure in this range. If Ethereum fails to break through this level, it might experience a pullback or sideways movement.
On the other hand, the key zone around $4,100 is providing current support. As long as this level holds, there is potential for Ethereum to attempt another move upwards toward the supply zone at $4,800. However, if the price breaks below this key support zone, we could see a deeper pullback, possibly targeting lower support levels.
#PEACE
Stay tuned for more update
TradeCityPro | Bitcoin Daily Analysis #191👋 Welcome to TradeCity Pro!
Let’s get into Bitcoin analysis. The market is still in a ranging phase, so let’s take a look at today’s triggers together.
⌛️ 1-Hour Timeframe
In this timeframe, Bitcoin is still consolidating and has formed a new range high around 124,094.
✔️ Right now, the price is near the bottom of the range box it has created and is on the verge of breaking below it.
✨ If the bottom of the box breaks, price could move toward lower levels.
📊 If selling volume continues to increase, the downward move could extend further, and Bitcoin may correct to even deeper zones.
🎲 However, if this move turns out to be a fake breakdown, and we see reversal structures such as a V-pattern, we could look for a long trigger.
🔑 I still don’t see Bitcoin as being in a downtrend. In my view, every correction the market makes is still healthy and supports the continuation of the broader bullish structure, helping maintain the strength of upcoming legs.
⭐ For now, since momentum has turned bearish on the lower cycles, I don’t have any new triggers to give based on my strategy. In this phase of the market, I prefer to wait until price builds more structure.
❌ Disclaimer ❌
Trading futures is highly risky and dangerous. If you're not an expert, these triggers may not be suitable for you. You should first learn risk and capital management. You can also use the educational content from this channel.
Finally, these triggers reflect my personal opinions on price action, and the market may move completely against this analysis. So, do your own research before opening any position.
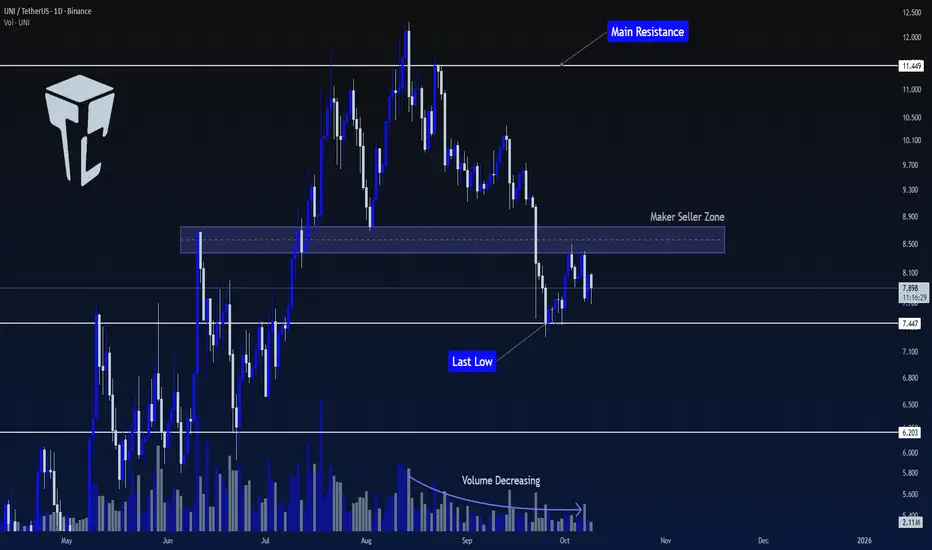
TradeCityPro | UNI: Key Levels and Bullish Continuation Setup👋 Welcome to TradeCity Pro!
In this analysis, I’m going to review UNI, one of the most popular DEX projects within the Ethereum ecosystem, with a market cap of $4.93 billion, ranking 28th on CoinMarketCap.
📅 Daily Timeframe
This coin has shown a strong upward move reaching 11.449 and then started a correction. After the failure at this level, a downward move began.
🧩 An important support zone around $8.5 has formed, which after breaking, is now acting as resistance.
✅ During this downward movement, the volume has been decreasing. Despite having two down legs so far, it can be said that the overall trend for this coin is still bullish.
📊 For a long position, the first trigger we have is the break of the Maker Seller level. Breaking this level will remove a lot of selling pressure, which could cause a sharp upward move in price.
🛒 The spot trigger for UNI is at 11.449. I recommend opening a long position after breaking the level, and using the profits from that position to buy this coin when the spot trigger is activated.
💥 For a short position, the trigger is 7.447. If the price ranges a bit longer in this area and then breaks the low, it would make a great position. However, if the price breaks the level right now, it would be a risky trigger.
📝 Final Thoughts
Stay calm, trade wisely, and let's capture the market's best opportunities!
This analysis reflects our opinions and is not financial advice.
Share your thoughts in the comments, and don’t forget to share this analysis with your friends! ❤️
BITCOIN MONEY FLOW DIVERGENCEIn this demonstration, I depict money flow indicator divergence with Bitcoin price action after volume price anomaly was identified last week. check link reference to last week idea below. Smart money off loading to retailers at the best possible price.

BTCUSD H4 | Price Rejection Signals Bearish MoveBitcoin (BTC/USD) has reacted off the sell entry at 122,135.86, which is a pullback resistance and could potentially drop from this level to the downside.
Stop loss is at 126,215.15, whic is a swing high resistance.
Take profit is at 117,768.13, which is a pullback support that lines up with the 50% Fibonacci retracement.
High Risk Investment Warning
Trading Forex/CFDs on margin carries a high level of risk and may not be suitable for all investors. Leverage can work against you.
Stratos Markets Limited (tradu.com ):
CFDs are complex instruments and come with a high risk of losing money rapidly due to leverage. 65% of retail investor accounts lose money when trading CFDs with this provider. You should consider whether you understand how CFDs work and whether you can afford to take the high risk of losing your money.
Stratos Europe Ltd (tradu.com ):
CFDs are complex instruments and come with a high risk of losing money rapidly due to leverage. 66% of retail investor accounts lose money when trading CFDs with this provider. You should consider whether you understand how CFDs work and whether you can afford to take the high risk of losing your money.
Stratos Global LLC (tradu.com ):
Losses can exceed deposits.
Please be advised that the information presented on TradingView is provided to Tradu (‘Company’, ‘we’) by a third-party provider (‘TFA Global Pte Ltd’). Please be reminded that you are solely responsible for the trading decisions on your account. There is a very high degree of risk involved in trading. Any information and/or content is intended entirely for research, educational and informational purposes only and does not constitute investment or consultation advice or investment strategy. The information is not tailored to the investment needs of any specific person and therefore does not involve a consideration of any of the investment objectives, financial situation or needs of any viewer that may receive it. Kindly also note that past performance is not a reliable indicator of future results. Actual results may differ materially from those anticipated in forward-looking or past performance statements. We assume no liability as to the accuracy or completeness of any of the information and/or content provided herein and the Company cannot be held responsible for any omission, mistake nor for any loss or damage including without limitation to any loss of profit which may arise from reliance on any information supplied by TFA Global Pte Ltd.
The speaker(s) is neither an employee, agent nor representative of Tradu and is therefore acting independently. The opinions given are their own, constitute general market commentary, and do not constitute the opinion or advice of Tradu or any form of personal or investment advice. Tradu neither endorses nor guarantees offerings of third-party speakers, nor is Tradu responsible for the content, veracity or opinions of third-party speakers, presenters or participants.

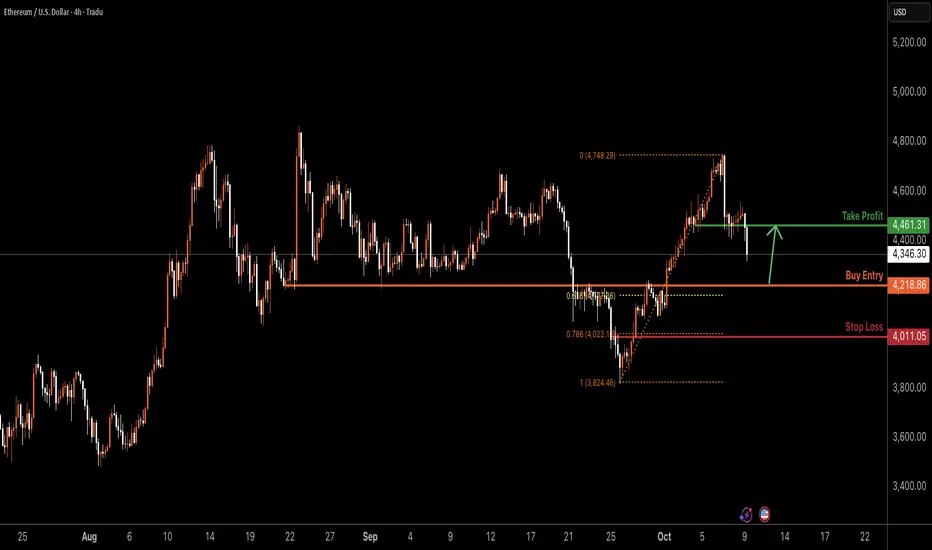
ETHUSD H4 | Bullish Reversal at Key SupportETH/USD is falling towards the buy entry at 4,218.86, which is an overlap support that is slightly above the 61.8% Fibonacci retracement and could bounce from this level ot the upside.
Stop loss is at 4,011.05, which is a pullback support that aligns with the 78.6% Fibonacci retracement.
Take profit is at 4,461.31, which is a pullback resistance.
High Risk Investment Warning
Trading Forex/CFDs on margin carries a high level of risk and may not be suitable for all investors. Leverage can work against you.
Stratos Markets Limited (tradu.com ):
CFDs are complex instruments and come with a high risk of losing money rapidly due to leverage. 65% of retail investor accounts lose money when trading CFDs with this provider. You should consider whether you understand how CFDs work and whether you can afford to take the high risk of losing your money.
Stratos Europe Ltd (tradu.com ):
CFDs are complex instruments and come with a high risk of losing money rapidly due to leverage. 66% of retail investor accounts lose money when trading CFDs with this provider. You should consider whether you understand how CFDs work and whether you can afford to take the high risk of losing your money.
Stratos Global LLC (tradu.com ):
Losses can exceed deposits.
Please be advised that the information presented on TradingView is provided to Tradu (‘Company’, ‘we’) by a third-party provider (‘TFA Global Pte Ltd’). Please be reminded that you are solely responsible for the trading decisions on your account. There is a very high degree of risk involved in trading. Any information and/or content is intended entirely for research, educational and informational purposes only and does not constitute investment or consultation advice or investment strategy. The information is not tailored to the investment needs of any specific person and therefore does not involve a consideration of any of the investment objectives, financial situation or needs of any viewer that may receive it. Kindly also note that past performance is not a reliable indicator of future results. Actual results may differ materially from those anticipated in forward-looking or past performance statements. We assume no liability as to the accuracy or completeness of any of the information and/or content provided herein and the Company cannot be held responsible for any omission, mistake nor for any loss or damage including without limitation to any loss of profit which may arise from reliance on any information supplied by TFA Global Pte Ltd.
The speaker(s) is neither an employee, agent nor representative of Tradu and is therefore acting independently. The opinions given are their own, constitute general market commentary, and do not constitute the opinion or advice of Tradu or any form of personal or investment advice. Tradu neither endorses nor guarantees offerings of third-party speakers, nor is Tradu responsible for the content, veracity or opinions of third-party speakers, presenters or participants.