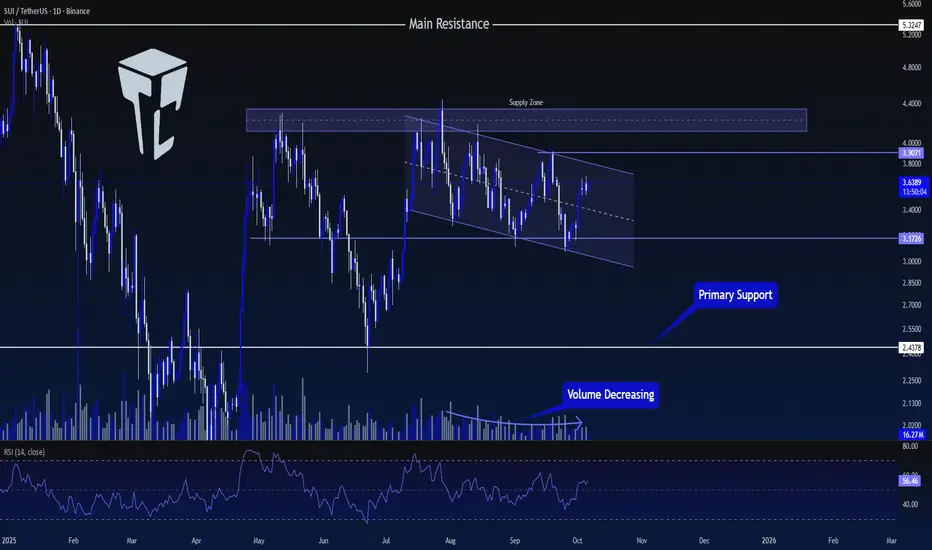
TradeCityPro | SUI: Approaching Key Breakout From Channel👋 Welcome to TradeCity Pro!
In this analysis, I want to review the SUI coin for you, one of the coins that gained significant attention in 2024 and currently ranks 14th on CoinMarketCap with a market cap of $13.22 billion.
📅 Daily Timeframe
On the daily timeframe, this coin has formed a supply zone near $4, and for the past few months, the price has been struggling with it.
⭐ At the moment, after the latest rejection from this zone, a descending channel has formed, guiding the price slowly downward.
✅ The support level that the price has recently built is 3.1726, which has been tested twice, and now the price is moving toward the top of the channel.
🎲 If the channel breaks to the upside, we can consider opening a long position. The main bullish confirmation will come after breaking the upper resistance zone, but an early long position can be opened upon the breakout of 3.9071.
🔍 If the downward movement resumes and 3.1726 breaks, the move could extend to the next support area at 2.4378.
📝 Final Thoughts
Stay calm, trade wisely, and let's capture the market's best opportunities!
This analysis reflects our opinions and is not financial advice.
Share your thoughts in the comments, and don’t forget to share this analysis with your friends! ❤️
Cryptomarket
ORDI / USDT : Looking in a good momentum for a rallyORDI / USDT has bounced from strong support and is showing positive momentum. If this strength continues, we could see a bullish move towards $10 – $12 – $15 in the coming days.
Keep a close watch on momentum and manage risk wisely.
NOTE : Breakdown from support will invalidate this setup
REZ / USDT : Approaching Trendline resistance with potentialREZ / USDT is approaching trend line resistance with strong potential. A successful breakout from this level could trigger a bullish rally of 50–60% in the short term.
Keep a close watch and always wait for confirmation before entering. Manage risk wisely.

ANFIBO | BTCUSD – Weekly Trading Plan [10.6 - 10.12.2025]Anfibo's here!
BTCUSD – Detailed Market Analysis & Outlook
It was great to see BITSTAMP:BTCUSD react strongly as I predicted last week, and I was absolutely right, BTC rallied from the $109,000 support to over $125,000 and set a new ATH. This strong move generated a profit of around $16,000 per BTC, reflecting the strength of the current bull cycle and the resilience of market demand. My family will definitely have a wonderful vacation thanks to that plan.
Market Outlook for the Week
Looking ahead, I anticipate the market may lean toward a period of healthy correction. Specifically, BTC could extend toward the $128,000 – $130,000 region before retracing to the nearest support zone between $118,000 and $116,000. Such a pullback would be constructive, allowing the market to reset before establishing a clearer direction or consolidating in a sideways range while awaiting new catalysts or macroeconomic developments.
Technical Perspective
On the H4 timeframe, BTC remains firmly within its ascending price channel, with no immediate signs of trend reversal. Momentum continues to favor the bulls, and as long as BTC maintains structure above key supports, the broader uptrend remains intact.
>>> SELL ZONE:
ENTRY: 128 - 130 (X1000)
SL: 132
TP: 118 - 116
>>> BUY ZONE:
(1) ENTRY: 117 - 118 (x1000)
SL: 115.8
TP: 123 - 128 - ATH
(2) ENRTY: 112.5 - 114 (x1000)
SL: 111
TP: 118 - 123 - 128 - ATH
Conclusion
BTC has successfully confirmed strength from the $109k base, pushing into new highs. While short-term corrections toward $118k–$116k would be considered healthy, the overall technical framework continues to support the bullish trajectory. Traders and investors alike should monitor key levels closely, maintaining flexibility while aligning with the prevailing trend.
WISH EVERYONE A PROFITABLE NEW WEEK!

#ETH/USDT LONG CHART ANALIYSIS !!🔹 Ethereum (ETH/USDT) Analysis
Ethereum has shown a strong recovery from the $3,800 support zone, bouncing sharply and now trading above the 50-day moving average (50MA) — a key bullish sign.
You can see from the chart that ETH has broken out of the descending wedge pattern that had been forming for weeks. This breakout, along with the reclaim of the 50MA, indicates a shift in momentum from bearish to bullish.
Additionally, price is currently sitting above the Ichimoku Cloud, which further strengthens the bullish bias. When ETH is trading above both the 50MA and Ichimoku Cloud, it often signals the start of a potential trend continuation move.
Bullish Structure – ETH has consistently made higher lows since hitting $3,800.
MA Confirmation – The move above the 50MA suggests renewed buyer strength.
Ichimoku Cloud Breakout – Indicates improving sentiment and trend reversal.
Volume Support – The recovery was backed by healthy buying volume.
Key Levels to Watch:
Support: $4,270 – $4,300 zone (previous resistance now support)
Resistance: $4,800 – $4,850 zone (next major target area)
Invalidation: Below $4,200 (would weaken bullish momentum)
If ETH holds above $4,270 and consolidates, we could see a continuation toward the $4,800–$5,000 range in the coming sessions.

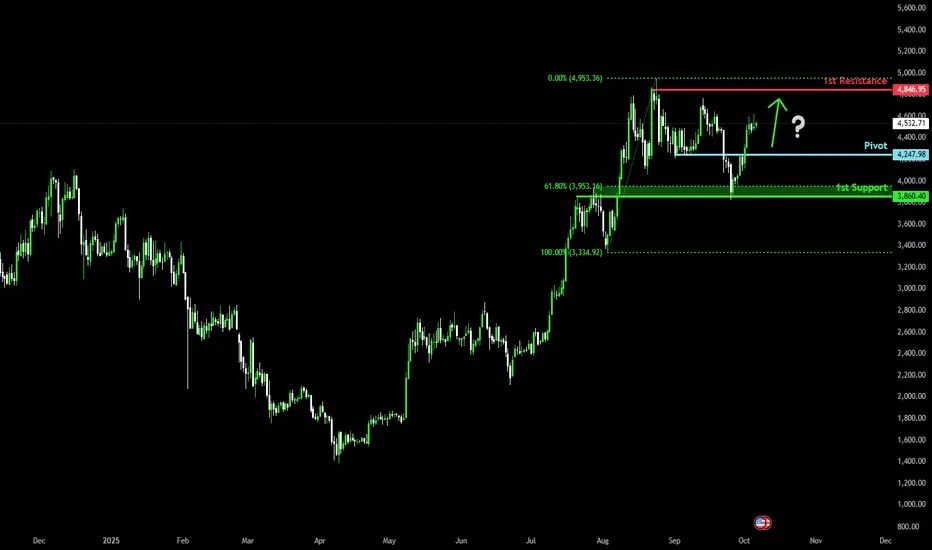
Bullish bounce from support?The Ethereum (ETH/USD) is falling towards the pivot which acts as a pullback support and could bounce to the 1st resistance.
Pivot: 4,247.98
1st Support: 3,860.40
1st Resistance: 4,846.95
Disclaimer:
The above opinions given constitute general market commentary, and do not constitute the opinion or advice of IC Markets or any form of personal or investment advice.
Any opinions, news, research, analyses, prices, other information, or links to third-party sites contained on this website are provided on an "as-is" basis, are intended only to be informative, is not an advice nor a recommendation, nor research, or a record of our trading prices, or an offer of, or solicitation for a transaction in any financial instrument and thus should not be treated as such. The information provided does not involve any specific investment objectives, financial situation and needs of any specific person who may receive it. Please be aware, that past performance is not a reliable indicator of future performance and/or results. Past Performance or Forward-looking scenarios based upon the reasonable beliefs of the third-party provider are not a guarantee of future performance. Actual results may differ materially from those anticipated in forward-looking or past performance statements. IC Markets makes no representation or warranty and assumes no liability as to the accuracy or completeness of the information provided, nor any loss arising from any investment based on a recommendation, forecast or any information supplied by any third-party.
Skate 30m analysisHere is an analysis of Skate on 30 minutes TF. Expected targets are on the chart. NFA DYOR

BTC/USDT | BTC Uptober Begins – Massive Rally Loading!By analyzing the Bitcoin chart on the 4-hour timeframe, we can see that the price moved exactly as expected — it hit the $118,000 target and even rallied up to $123,900 . After reaching this key supply zone, which we had marked earlier, BTC faced selling pressure and is now trading around $121,800.
If Bitcoin can hold and stabilize above $120K , we could see a new ATH soon ! “Uptober” has just begun, and it looks like we’re in for a strong bullish month. The next upside targets are $125K, $132K, and $138K.
Please support me with your likes and comments to motivate me to share more analysis with you and share your opinion about the possible trend of this chart with me !
Best Regards , Arman Shaban

DOGE 1H – Testing the Lines of Defense
DOGE on the 1H looks similar to LINK and ETH: price is hovering around the 50MA, with the 200MA sitting just below as the next line of defense.
If DOGE manages to hold this cluster of support, a rebound toward the previous highs is on the table.
This structure shows tightening momentum, and the next few candles could define the next week`s direction.
Key notes:
DOGE testing 50MA on 1H
200MA close below as backup support
0.618 Fib as confluence zone
Setup mirrors LINK and ETH
Bias:
Neutral-bullish — structure intact while 50MA holds. Losing it could open a deeper retrace.
Always take profits and manage risk.

KMNO Update📊 CRYPTOCAP:KMNO Update
After pumping strongly, CRYPTOCAP:KMNO is now retracing 🔄
If the price keeps retracing to the green zone, it could offer a potential long entry or a chance for more accumulation 💚
Always wait for confirmation before entering — trade smart, not blind.

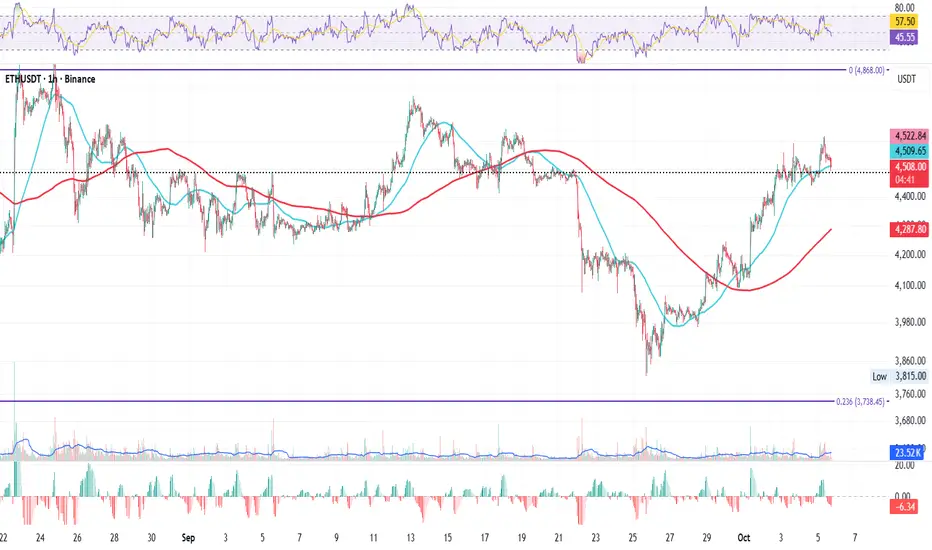
ETH 1H – Holding the Line or Breaking It?ETH 1H – Holding the Line or Breaking It?
Just like BTC, ETH on the 1H is currently testing the 50MA, the short-term line between strength and weakness.
The question now: will it hold as support, or will price break below and look for shelter near the 200MA?
Right under the 50MA sits yesterday’s close, adding an extra layer of support for the short-term structure.
Today’s close could be decisive for next week’s momentum. 👀
Key notes:
ETH testing the 50MA on 1H
200MA below as next support
Yesterday’s close acting as buffer
Close today could shape next week’s direction
Bias:
Neutral-bullish — momentum intact as long as the 50MA holds.
Always take profits and manage risk.
Interaction is welcome.
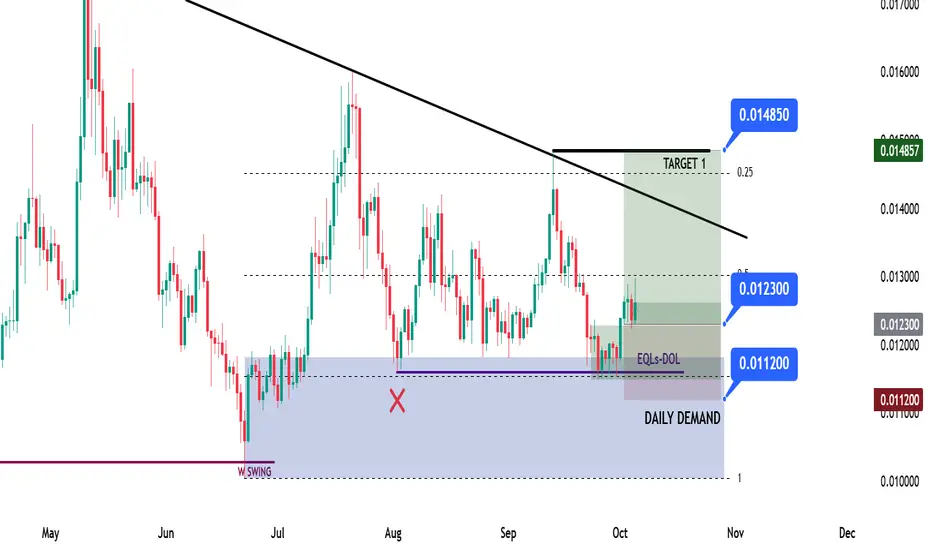
SHIB Long Idea - DLRMD Model SHIB Swing Long Opportunity - DLRMD MODEL
📊 Market Sentiment
FED has resumed its rate-cutting cycle, starting with a 0.25% cut in September, with two more expected. Institutional liquidity inflows have accelerated as the U.S. officially adopts crypto as part of its reserves. Despite elevated inflation, a weakening labor market is forcing the FED to ease, pushing more capital into risk-on assets.
📈 Technical Analysis
Price is in a higher time frame (HTF) bullish trend, so I’ll only be looking for longs.
Price swept the weekly swing liquidity, closed above, and broke the daily structure — forming a strong daily demand zone. The first tap to this zone generated a solid bullish reaction, confirming its validity.
Currently, price is rejecting from a bearish trendline after running previous liquidity. I assume price now has enough momentum to test and potentially break that trendline for the next leg higher.
📘 Model to be used – HTF Demand w/ Liquidity Run & Max Discount Zone (DLRMD Model)
1-Identify HTF trend direction and only trade in that direction.
2-Locate the HTF demand zone where price can find support and bounce.
3-Wait for LTF liquidity sweep to confirm energy for a reversal.
4- Use Fibonacci retracement to define the max discount zone (around 0.75 retracement).
5- Enter once price shows rejection or bounce confirmation.
📌 Game Plan
Entry already taken at $0.0123 from the retest of the daily demand + discount zone confluence.
I will hold the position until the bearish trendline and monitor for a breakout.
First target is the bearish trendline; once reached, stoploss will move to breakeven, and the rest will be managed toward the next liquidity level.
🎯 Setup Trigger
Setup is active now.
📋 Trade Management
Entry: $0.0123
Stoploss: $0.0112
Targets: TP1 = Bearish trendline | TP2 = $0.01485
💬 Like, follow, and comment if this breakdown supports your trading! More setups and insights coming soon stay connected!
⚠️ Disclaimer: This content is for informational and educational purposes only and does not constitute financial, investment, or trading advice. Always DYOR before making any financial decisions.
DOGE Swing Long Idea - TRKZ ModelDOGE Swing Long Idea w TRKZ Model
📊 Market Sentiment
FED has resumed its rate-cutting cycle, starting with a 0.25% cut in September, with two more 0.25% cuts expected in the coming months. Additionally, institutional liquidity inflows have accelerated as the U.S. officially adopts crypto as part of its reserves. While inflation remains elevated, the weakening labor market is forcing the FED to ease, driving more capital into risk-on assets.
📈 Technical Analysis
Price broke the bearish trendline that had been responsible for the bearish trend since December 2024 and closed above, indicating that price will seek higher levels.
Price also broke the HTF Key Level aggressively and closed above. I expect this level to hold and push us higher.
📘 Model to be used – Broken Trendline Retest supported by HTF Key Zone Retest (TRKZ)
In this model, we need to see a HTF trendline broken aggressively with a close above on HTF. Then, we check for a broken HTF Key Zone (Supply–Demand–Support–Resistance) aligned with the trendline break. Finally, we look to enter after the retest of both the broken trendline and the broken Key Zone.
📌 Game Plan
Carry the position toward the December 2024 high at 0.48$ as a mid–long term swing position. Trail the stoploss after taking first TP, move entry to breakeven, and manage forward.
🎯 Setup Trigger
Setup is valid after retesting the broken trendline and HTF Key Level.
📋 Trade Management
Stoploss: 0.18254$
Targets: TP1: 0.308$ | TP2: 0.4344$ | TP3: 0.4842$
Once TP1 is hit, stoploss will be moved to breakeven to secure profits.
💬 Like, follow, and comment if this breakdown supports your trading! More setups and market insights coming soon — stay connected!
⚠️ Disclaimer: This content is for informational and educational purposes only and does not constitute financial, investment, or trading advice. Always DYOR before making any financial decisions.

LINK Swing Long Idea - KZMT ModelLINK Swing Long Idea
📊 Market Sentiment
FED has resumed its rate-cutting cycle, starting with a 0.25% cut in September, with two more expected. Institutional liquidity inflows have accelerated as the U.S. officially adopts crypto as part of its reserves. Despite elevated inflation, a weakening labor market is forcing the FED to ease, pushing more capital into risk-on assets.
📈 Technical Analysis
Price is in a higher time frame (HTF) bullish trend, so I will only be looking for longs.
Price broke the HTF Key Zone and closed above, then retested and rejected from it — confirming the zone as demand.
Price also deviated and tapped back into the HTF bullish trendline, confirming trapped short-sellers and reinforcing bullish momentum.
📘 Model to be used – HTF Key Zone w/ HTF Manipulated Trendline (KZMT)
This model first identifies the HTF trend and only trades in that direction. Next, I locate key zones that support price. Finally, I look for a manipulated HTF trendline that aligns with those zones. When both confluences overlap, conviction for a strong bullish reaction increases.
📌 Game Plan
1)Price to revisit HTF Key Zone.
2)Retest of the HTF bullish trendline.
🎯 Setup Trigger
Limit entry at 22$
📋 Trade Management
Stoploss: Daily close below HTF Key Zone or hard stop at $19.5
Targets: TP1 = $25 | TP2 = $28
💬 Like, follow, and comment if this breakdown supports your trading! More setups and market insights coming soon — stay connected!
⚠️ Disclaimer: This content is for informational and educational purposes only and does not constitute financial, investment, or trading advice. Always DYOR before making any financial decisions.

BTC/USD Analysis: Bullish Continuation in FocusBitcoin continues to demonstrate strength following its recent recovery. After periods of consolidation and controlled retracement, the market shows clear signs of accumulation, with buyers maintaining momentum. Each upward leg has been supported by liquidity absorption, reflecting steady confidence in higher valuations.
The current structure suggests that even if retracements occur, they are likely to serve as a foundation for further expansion. Market behavior highlights resilience, with the broader trend still pointing toward bullish continuation. Bitcoin remains positioned for progressive growth, with sentiment and structure both aligning in favor of buyers.

FARTCOIN Update📊 FARTCOIN Update
FARTCOIN is currently retracing 🔄
If the price keeps dropping and reaches the green support zone, it could offer a potential long entry — but only with confirmation 💚
✅ Trade smart, not blind.

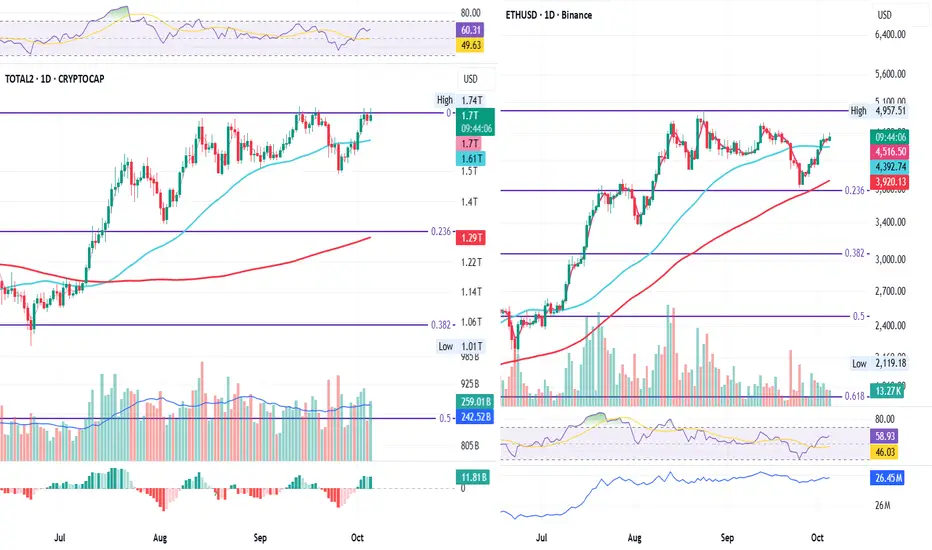
TOTAL2 Battles ATH While ETH Lags BehindTOTAL2 & ETH Daily – Testing the Edge of Structure
On the daily chart, TOTAL2 and ETH are showing a slight divergence.
TOTAL2 is battling its all-time high, while ETH is lagging slightly, hovering just above the 50MA.
If ETH manages to hold this level, it could build strength for another attempt at the highs. But if it loses the 50MA, this current high might turn into a lower high, risking a short-term break in bullish structure.
Today’s close will be key, it might offer the first clue about where momentum wants to flow next.
Key Notes:
TOTAL2 retesting all-time high
ETH consolidating over the 50MA
A hold could fuel another push up
A break below risks a lower high formation
Daily close likely to set short-term direction
Bias:
Cautiously bullish, structure holds, but confirmation depends on ETH defending the 50MA.
Always take profits and manage risk.
Interaction is welcome.
TradeCityPro | Bitcoin Daily Analysis #187👋 Welcome to TradeCity Pro!
Let’s go over Bitcoin’s analysis — today, Bitcoin has recorded a new ATH. Let’s review the market conditions together.
📅 Daily Timeframe
In the daily timeframe, Bitcoin is moving inside an ascending channel with a steady upward slope.
⭐ After a corrective move from the top of the box, the price made a fake breakdown of the channel’s bottom and then, with the bullish momentum that followed, moved upward and managed to set a new ATH.
✔️ During the correction, the volume was decreasing, but after the price was supported at the key support zone and the fake breakdown occurred, buying volume entered the market.
✨ The main confirmation of the bullish continuation could be taken after breaking above 117056. Currently, the next confirmation trigger is a price stabilization above 123433.
💥 In my opinion, since RSI is getting rejected from the 70 level and the price has reached a strong resistance zone, there’s a high chance that the market will range below this resistance for a few days to test it.
🧩 At the moment, the main RSI resistance level seems to be 75.38 — if this level breaks, the main market momentum could start, leading to a sharp move upward.
📊 It’s completely normal for the trend to show weakness after reaching an ATH, because this level is Bitcoin’s largest supply zone. These wicks hitting the resistance zone don’t necessarily mean trend weakness — it’s typical for the price to form such candles when testing its all-time high.
🔑 What really matters is how the price reacts in the next few attempts at this zone, which will tell us whether we have an actual trend weakness or not.
💫 Right now, the most important support Bitcoin has built is around 107000. If a bearish move begins, the first confirmation of a downtrend will be breaking this area. However, the main confirmation of a full bearish reversal would be the break of 100961.
🎲 Overall, since the price is currently at the top of the market, finding precise triggers on Bitcoin is difficult. But considering Bitcoin dominance has the potential to drop, altcoins could provide excellent trading setups in the coming days if that dominance decline begins.
❌ Disclaimer ❌
Trading futures is highly risky and dangerous. If you're not an expert, these triggers may not be suitable for you. You should first learn risk and capital management. You can also use the educational content from this channel.
Finally, these triggers reflect my personal opinions on price action, and the market may move completely against this analysis. So, do your own research before opening any position.

XLM trade idea. October 2025Hello this is my first ever trade idea what I have shared. I am here to learn , so any constructive feed back is more than welcome :)
After an impulsive move, I identified a bull flag with inverse H&S pattern. After price broke the neckline I decided to open the long position at the level 0,3974 with TP $0,85 and SL $0,29.
With overall market uptrend and correlation with XRP movements in the past I expect a bullish scenario to happen after XRP ETF decision will be made by SEC on 26th of October.

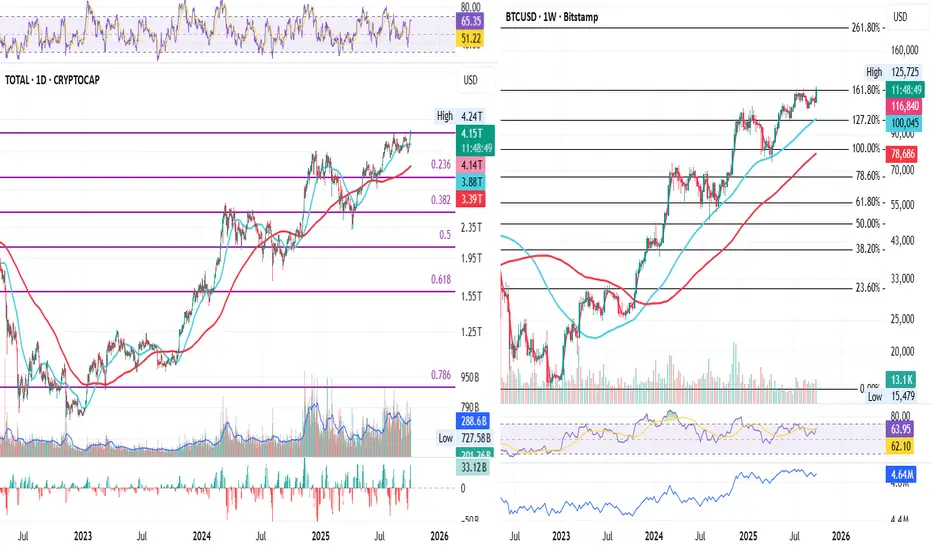
TOTAL vs BTC – Third Test at Fib ResistanceBoth TOTAL and BTC are testing the same thing today:
the Fib resistance, now on the third attempt.
Price action is coiling right under this key level, and today’s close might finally tell us which way we’re heading.
Until then, about 12 hours of speculation left: unless price decides to run both directions first (because why not, it’s crypto).
Key notes:
Fib resistance zone tested 3 times
BTC and TOTAL showing identical structures
Daily close = potential trigger
Breakout could open the path for continuation
Failure means short-term pullback or range
Bias:
Cautiously bullish, market structure still favors upside, but confirmation needs a daily close above Fib resistance.
Always take profits and manage risk.
Interaction is welcome.
ARKM 1H AnalysisHere is an analysis of ARKM on 1 Hour time frame. ARKM key buying area and expected targets are given on chart. DYOR NFA

TradeCity Pro | WLD: Consolidating at Key Fibonacci Support👋 Welcome to TradeCity Pro!
In this analysis I want to review the WLD coin for you. This is one of the crypto projects where Sam Altman, the CEO of OpenAI, also serves as the CEO. The coin currently has a market cap of $2.81 billion and is ranked 42 on CoinMarketCap.
⏳ 4-Hour Timeframe
In the 4-hour timeframe, this coin is sitting on a very important support area. This PRZ zone is significant not only as a key support but also because it aligns with the 0.618 Fibonacci level.
✔️ After a bullish move that pushed the price up to 2.038, WLD entered a corrective phase. Following the break of the 0.382 Fibonacci level, the price has now corrected down to this important area.
⭐ A very attractive range box has formed around this PRZ zone, and the price has built a clean structure within it.
📊 Volume has gradually decreased inside this box, but after a shadow wick touched the bottom of the support, buying volume entered the market again, suggesting that the price now has enough momentum to potentially break above 1.396.
⚡️ There are two SMAs (25 and 99) on the chart, both showing a slight upward slope and converging toward each other.
💥 This indicates that volatility in the market has decreased significantly, and since the market tends to move after periods of low volatility, the likelihood of a breakout has increased.
🔄 If the box breaks to the upside and the 1.396 trigger is activated, a bullish move can begin. The main confirmation of the uptrend will come after stabilization above 1.468, but in my opinion, the breakout of 1.396 alone is strong enough to justify an early long entry.
🔑 However, if the box breaks downward, the trend for this coin will turn completely bearish, with the next major support zone located at 1.037. The price could even decline further in the future.
📝 Final Thoughts
Stay calm, trade wisely, and let's capture the market's best opportunities!
This analysis reflects our opinions and is not financial advice.
Share your thoughts in the comments, and don’t forget to share this analysis with your friends! ❤️

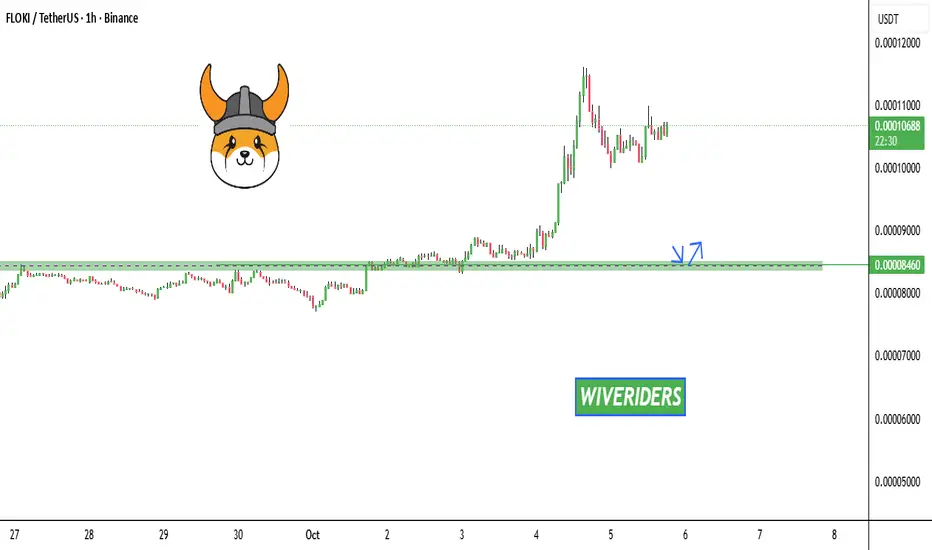
FLOKI Update📊 FLOKI Update
FLOKI is currently in an uptrend 🔥
If you’re planning to accumulate more or enter a new position, don’t rush —
💡 Wait for the price to retrace to the green zone (support area) and look for confirmation before entering long.
✅ Trade smart, not blind — patience = profits.