Stop!Loss|Market View: BTCUSD🙌 Stop!Loss team welcomes you❗️
In this post, we're going to talk about the near-term outlook for the BTCUSD☝️
Potential trade setup:
🔔Entry level: 72115.95
💰TP: 79200.75
⛔️SL: 66949.95
"Market View" - a brief analysis of trading instruments, covering the most important aspects of the FOREX market.
👇 In the comments 👇 you can type the trading instrument you'd like to analyze, and we'll talk about it in our next posts.
💬 Description: Bitcoin is unlikely to be attractive for a short-term trade today, but a more likely buy scenario could realize in the near future. This would require waiting for the price to return to the 67,000-71,500 range, and then wait for a breakout of the upper limit. The upside target in this case is considered to be near 80,000.
Thanks for your support 🚀
Profits for all ✅
Cryptomarket

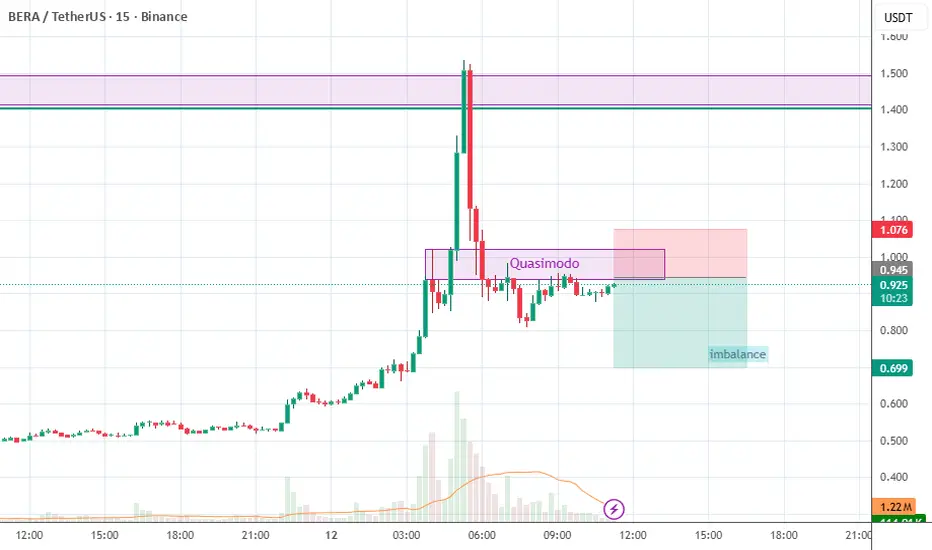
BERAUSDT plan 12-02-26BERAUSDT PLAN 12-02-26
Bera has rejected fresh supply on the high timeframe.
When we look at the 1-hour timeframe, we see a bearish engulfing. Then, we move down to the 30-minute timeframe and see a Quasimodo setup. We'll try setting a limit in that area, even though the head is too high.
XAUUSD Rejection From Range High → Bearish Move Toward TrendlineOn TradingView, the Gold Spot / U.S. Dollar (30m) chart shows a clean rejection from the upper range after extended consolidation inside a rising channel.
Price failed to sustain above the range high and delivered a strong bearish impulse, breaking structure and dropping into the key demand/support zone around 4950. The market is now pulling back toward the previous support, which may act as new resistance.
If this retest holds, the next leg is likely to follow the descending trendline toward 4917 and potentially 4850.
Key Levels:
Resistance / Retest Zone: 4950 – 4980
Intraday Support: 4917
Bearish Target Zone: 4850
Bias remains bearish unless price reclaims and holds above the 4980 resistance area. Patience for the retest setup can offer a high-probability continuation entry.

BCHUSD H1 | Could we see a a reversal from here?Based on the H1 chart analysis, we can see that the sell entry level is at 510.97, which is a pullback resistance.
Our stop loss is set at 535.48, which is a pullback resistance.
Our take profit is set at 467.84, which is a pullback support that aligns with the 61.8% Fibonacci retracement.
High Risk Investment Warning
Stratos Markets Limited fxcm.com Stratos Europe Ltd fxcm.com
CFDs are complex instruments and come with a high risk of losing money rapidly due to leverage. 69% of retail investor accounts lose money when trading CFDs with this provider. You should consider whether you understand how CFDs work and whether you can afford to take the high risk of losing your money.
Stratos Global LLC fxcm.com Losses can exceed deposits.
Please be advised that the information presented on TradingView is provided to FXCM (‘Company’, ‘we’) by a third-party provider (‘TFA Global Pte Ltd’). Please be reminded that you are solely responsible for the trading decisions on your account. Any information and/or content is intended entirely for research, educational and informational purposes only and does not constitute investment or consultation advice or investment strategy. The information is not tailored to the investment needs of any specific person and therefore does not involve a consideration of any of the investment objectives, financial situation or needs of any viewer that may receive it. Past performance is not a reliable indicator of future results. Actual results may differ materially from those anticipated in forward-looking or past performance statements. We assume no liability as to the accuracy or completeness of any of the information and/or content provided herein and the Company cannot be held responsible for any omission, mistake nor for any loss or damage including without limitation to any loss of profit which may arise from reliance on any information supplied by TFA Global Pte Ltd.
Stratos Trading Pty. Limited fxcm.com
Trading FX/CFDs carries significant risks. FXCM AU (AFSL 309763), please read the Financial Services Guide, Product Disclosure Statement, Target Market Determination and Terms of Business at fxcm.com

OUTSIDE THE NEWS, BITCOIN IS IN A DECAY CYCLEPrice expansion ratios are indicated on the chart.
First major bottom in 2022 completed on 685 weeks from the primary 2009 low.
Price completed 3 growth cycles at the 2017 top, 2021 top, and 2025 top forming
a 4-year topping cycle.
Each top is followed by a similar correction fractal, and by structural projection,
price is expected to reach the 44200 / 48700 price zone.
There are several sequence blocks we can build from the price action outside the
news and loud noise. The market tells its own story.
Trade safe, Good luck

ASTER / USDT Bullish continuation loading above key SupportASTER / USDT is showing strong bullish structure and remains well-positioned for a continuation towards $0.8345. As long as price holds above the key support zone of $0.5914 – $0.5826, the probability of a sustained bullish rally stays high. Manage risk wisely and wait for confirmation.

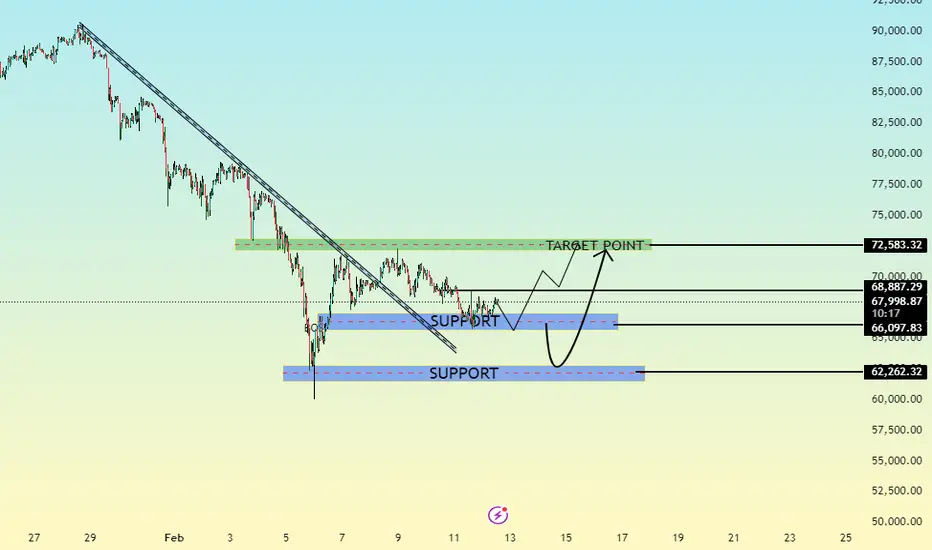
BTCUSD BEARISH ANALYSIS [READ CAPTION]GIVE YOUR OPINION ABOUT THIS ANALYSIS
Key Support Zones
Support Zone 1: 66,097
This level is acting as immediate support.
Price is currently consolidating above this area, indicating potential accumulation.
A strong hold above this level keeps short-term bullish recovery valid.
Major Support Zone: 62,262
This is the broader demand area and the origin of the strong bullish reaction.
If price revisits this zone, buyers are expected to defend aggressively.
A breakdown below 62,262 would invalidate the recovery scenario and shift bias back to bearish.
🔴 Resistance Levels
Minor Resistance: 68,026 – 68,887
This area represents short-term supply and recent consolidation highs.
A clean break above this region would confirm bullish continuation.
Target Zone: 72,583
This is the projected upside objective if momentum builds.
A successful breakout above resistance could drive price toward this level.
📈 Market Bias & Outlook
Holding above 66,097 → Short-term bullish recovery
Break above 68,887 → Momentum continuation toward 72,583
Rejection from resistance → Possible retest of support
Break below 62,262 → Bearish trend resumes
📌 Summary
The dominant trend was bearish, but the recent trendline break and strong reaction from support suggest a possible short-term structural shift. Confirmation will come from sustained price action above near-term resistance.
If buyers maintain control above key support, upside expansion toward the 72,583 target becomes increasingly probable.
ETH/USDT – 2H Chart UpdateETH/USDT – 2H Chart Update
ETH is compressing inside a falling wedge structure after a prolonged downtrend. Price is currently hovering around the 1,970–2,000 zone, sitting right at the intersection of trendline support and short-term resistance.
Descending trendline still acting as dynamic resistance
Price attempting to reclaim the 2,000 psychological level
The Ichimoku cloud shows early signs of flattening (momentum slowing)
Support: 1,900–1,880
Demand Zone: 1,750–1,800
Resistance: 2,050–2,100
Strong Resistance: 2,200 (trend + supply zone)
Clean breakout above 2,050 with volume → short squeeze toward 2,200–2,300.
Rejection below 2,000 → retest of 1,900 support.
Structure remains cautious-neutral inside compression. A breakout is likely soon as volatility contracts.
⚠️ Wait for confirmation

#HBAR—This HNS Structure Rarely Fails After Liquidity Is Taken
Yello Paradisers! -Are you noticing how HBAR is quietly setting a trap after taking liquidity exactly where most traders panicked and sold, and could this be the moment when patience finally pays off?
💎#HBAR forming a clean inverse head and shoulders pattern right at a previous support zone, which is a classic professional accumulation behavior. Before this structure started to develop, price deliberately swept liquidity below support, forcing out weak hands and triggering stop losses from inexperienced traders. This is exactly the type of environment where smart money likes to build positions.
💎After the liquidity sweep, we saw a sharp bullish impulse accompanied by strong volume. This move was crucial because it broke above the previous swing high of the left shoulder, which also aligned perfectly with horizontal resistance acting as the neckline. This is a strong technical confirmation that buyers are stepping in with conviction, not randomly.
💎At the moment, #HBAR is forming the right shoulder. What is important here is not speed but quality. Price is consolidating tightly while volume is clearly declining. This is a healthy sign, as it signals an absence of aggressive sellers. When price holds near the neckline without heavy selling pressure, it usually increases the probability of continuation to the upside rather than a breakdown.
💎The RSI already gave us an early warning signal. A bullish divergence formed between the left shoulder and the head, showing that downside momentum was weakening even while price was still moving lower. This divergence often appears before trend reversals and is another reason why this structure deserves close attention.
💎Another key detail is the neckline behavior itself. This level has already been tested three times, and each test weakens the ability of sellers to defend it. Repeated tests usually favor a breakout rather than rejection, especially when combined with declining volume during consolidation.
💎From a level perspective, major support is located around the 0.072 area. As long as the price holds above this zone, the bullish structure remains valid. On the upside, the major resistance sits near 0.135, with an intermediate resistance around 0.110 that may cause short-term reactions.
That's why Paradisers, we are playing it safe and focusing only on high-probability structures like this one. Strive for consistency, not quick profits. Treat the market as a businessman, not as a gambler. This is the only way you will make it far in your crypto trading journey and get inside the winner circle.
MyCryptoParadise
iFeel the success🌴

GBP/USD ANALYSIS GUYS [READ CAPTION]
GBP/USD – Bullish Reaction from Key Support
Price swept into the 1.3580–1.3600 demand zone and showed strong rejection, signaling buyers stepping in. The bounce created short-term higher lows, suggesting bullish momentum is building.
As long as price holds above 1.3580, continuation toward the 1.3690–1.3710 resistance / target zone is likely.
🔹 Bullish Outlook: Higher lows + support holding → upside continuation.
🔹 Key Target: 1.3700 area.
🔹 Invalidation: A strong close below 1.3580 shifts bias bearish.
Bias: Short-term bullish above 1.3580.
Wait for confirmation and manage risk accordingly.]

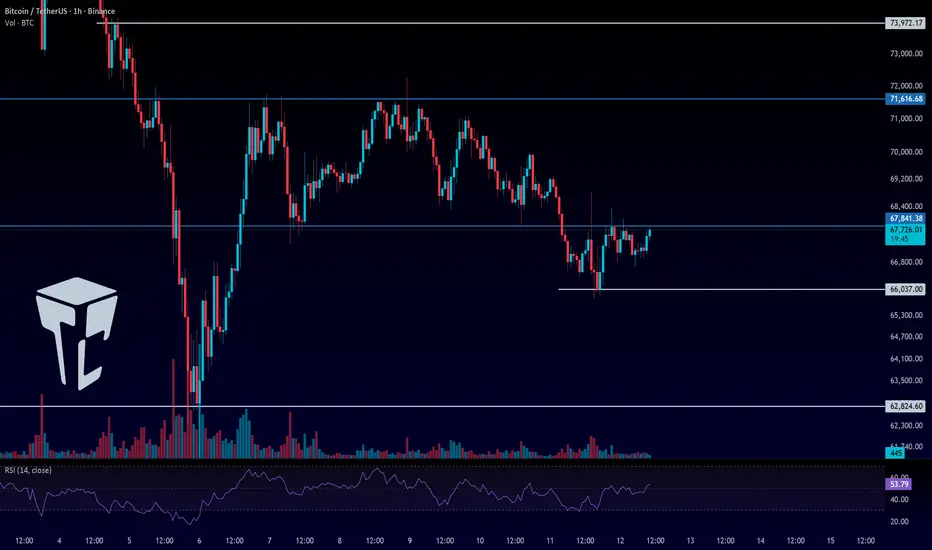
TradeCityPro | Bitcoin Daily Analysis #266👋 Welcome to TradeCity Pro!
Let’s move on to Bitcoin analysis. After activating our trigger yesterday, the market is now moving sideways.
⌛️ 1-Hour Timeframe
At the moment, Bitcoin has formed a small range box between 66,037 and 67,841, and after breaking 67,841, price has entered a consolidation phase.
✨ The fact that price started ranging after the break of 67,841, without bearish momentum entering the market, shows that sellers don’t currently have enough strength and haven’t been able to win the battle against buyers.
✔️ On the other hand, buyers haven’t been able to fake this breakout either, so their strength isn’t dominant as well. Overall, we can say that there’s no clear power or momentum in Bitcoin right now.
✨ If price doesn’t spend too much time inside this range and breaks out before the end of today’s New York session, momentum could enter the market.
📊 A break above 67,841 would confirm that the bearish move was fake and signal the entry of bullish momentum.
A break below 66,037 would confirm the continuation of the bearish move.
💥 Personally, I won’t open a long position on the break of 67,841, but I’ll be watching closely in case the market gives a trigger for a risky long position. The main long trigger remains 71,616.
⚖️ For shorts, the 66,037 level is a valid trigger. If you don’t already have a short position, you can enter on a break of this level.
💡 Since the market currently lacks momentum, RSI isn’t very useful right now. We should wait for the next impulsive leg to begin before relying on momentum oscillators again.
❌ Disclaimer ❌
Trading futures is highly risky and dangerous. If you're not an expert, these triggers may not be suitable for you. You should first learn risk and capital management. You can also use the educational content from this channel.
Finally, these triggers reflect my personal opinions on price action, and the market may move completely against this analysis. So, do your own research before opening any position.
Bitcoin in Bottom Range with Ability to move but just waiting
This really is just a waiting game right now.
We may wait for months before a REAL push higher
Initially, we wait for the USA Inflation data tomorrow and it is worth noting there is no FOMC meeting in Feb, so the next Rates decision will be on March 17 - 18.
So, while Bitcoin is rarely directly effected by Rates (See Circle in chart below ), The effect of Rates is more on the Companies in the Bitcoin world, like the ones that collapsed in 2022.
However, Inflation data DOES make an impact
So, where is Bitcoin right now ?
PA has Dropped since ATH and currently in the C wave of an ABC correction, that has the potental to go to around 50K. This followed the 12345 Elliot waves up to ATH.
Perfect PA
On the main chart
we see PA bounced off the Value Area Low of the VRVP ( Red Dash)
The White Dotted line is the Area of the 2021 ATH.. PA Should not Drop Much below this area normaly..
The Point of Control ( POC Red Dotted line ) is an aera of High trading volume. Resistance as we rise.
The Orange Dash line at the top is the Value Area High of Trading Volume and is also the current ATH line.
And the Red Line that has been falling with PA is the 50 Daily SMA - THIS needs to be crossed and Held again to be Truly Bullish, at a currentl price line around 87K
So, We ARE in the final stage of correction but we simply do not know how Deep .
However, we can look at other data and get an idea.
Bitcoin IS Oversold. The Daily MACD is just one that shows us how deeply Over Sold.
MACD looks like this on many Timeframes.....But we should remember that MACD being this Low does NOT guarantee a Rise but it can certainly point towards Ranging. Notice the Histogram bars getting smaller and White, showing increased potential for moves higher.
The RSI is also Down Low
Simply showing Room to move higher under the right circumstances.
This environment is created by Fear..People Selling and Capitulating......
We can see this below....
The SOPR ( Spent Output Profit Loss ) Shows us the Volume of Coins sold at a profit or Loss.....and we see a Lot of people selling at a Loss, for fear of Price continuing to Drop.
Bitcoin is being Sold a Lot...It is Over Sold.
This drops price, creates Fear and uncertainty. PERFECT Buying opportunity
These coins are being Bought back by others ..Cheap Bitcoin....
I'll End on this Chart
The weekly Version
Green SMA - 9
Red SMA - 50
Blue DMS - 100
Yellow SMA - 200
PA fell through the 9, 50 amd 100 in a simialr way to in 2021 but in a quicker time period.
That was most likely due to how PA had "ranged" for a year before a little push to ATH..Cooler Calmer PA.
And I see the same now....
PA is currently above the 200, having bounced off it. PA fell directly throuh it in 2021.
And I can see PA ranging inbetwen that 1.768 Fib Extension and the Green Bar for the remainder of this Bear Run...A similar range to what we saw in 2024....as mentioned previously.
The Daily
And what are we waiting For ?
For PA to break over and Hold that 9 SMA and on Friday, we may see PA do that if the inflation figures are acceptable.
If not, We may hit the 200 Weekly SMA again
As we have seen, we have FEAR in the Market and Clever Money is Buying the Sold Coins.
PA is over Sold and has abi;ity to push higher, even if it is just to remain in Range.
PA is near the Bottom on so many Chart lines and this includes the Ascending channel.
PA has NEVER fallen out of that channel and Currently, the base is around 60K
Enjoy, we Have past most of the painful stages.
We just waiting,,,,,,,,,,,,,,,,,,,,,

ASTER Price Could Be One Flip Away From a Recovery* The ASTER price is pushing into a major flip zone, and this is the level that could change the whole structure if it holds.
* Both the daily and 4-hour charts show ASTER tightening up, with resistance overhead but strong support still holding underneath.
* With market cap starting to recover and the token still deep off its highs, ASTER may finally be entering an early rebound phase.
When you zoom out and look at the ASTER price right now, it’s pretty clear the market isn’t panicking anymore. The big selloff already happened. The damage has been done. What’s happening now feels more like a slow reset than a collapse.
For the past few weeks, ASTER has basically been stuck around the $0.60–$0.65 zone, and that kind of price action is always weird. It’s not exciting. It’s not bullish. But it’s also not breaking down. The chart has gone quiet, volatility has tightened, and the token is just sitting there, waiting.
That’s why this phase actually matters. The ASTER price isn’t sliding lower the way it was before. Every dip into support is getting bought, but every rally still runs into sellers overhead. Buyers are showing up just enough to hold the floor, but nobody has fully taken control yet. It’s a pause, not a breakout.
This is the kind of stage a lot of altcoins hit after their launch hype fades. ASTER had that explosive run above $2, then the usual post-launch unwind. And now it’s been drifting for months, shaking out anyone who bought late and forcing the market to finally build something real.
ASTER’s market cap has started climbing again after the reset, which is usually what happens once the worst selling pressure cools off. At the same time, the token is still down more than 70% from its highs, and that’s often where early recovery phases start forming if support keeps holding.
From here, it’s not really about headlines. It’s about structure. As long as the ASTER price stays above that $0.60 base and keeps pressing into the $0.65–$0.70 flip zone, the rebound setup stays alive.
ASTER isn’t leading the market right now. It’s not the loud trade of the cycle. It’s just sitting in that quiet zone where selling has already happened, attention is low, and the chart is tightening up. And those are usually the moments where the next move surprises people.

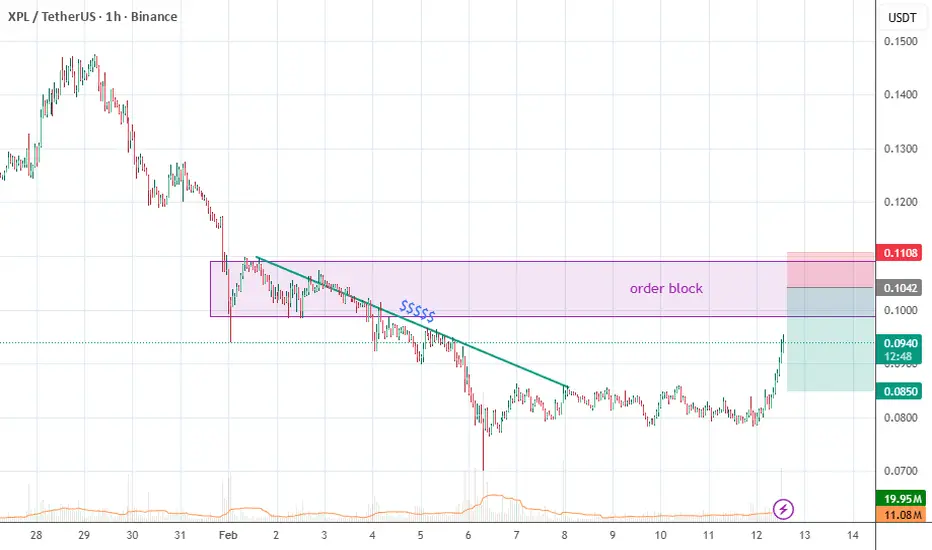
XPLUSDT plan 12-02-26XPLUSDT plan 12-02-26
Currently, the price is rallying to reach the supply area.
Because the supply is in the form of a longitudinal compression, the supply area will be quite wide.
Therefore, we should wait for a price reaction with a rejection candle or reversal pattern.
BTCUSD Falling Wedge Breakout Setup | 69K TargetBTCUSD on the 30m timeframe is forming a clear falling wedge pattern after a sharp sell-off. Price is compressing near the lower trendline with multiple rejections, showing signs of accumulation and seller exhaustion.
A breakout from this wedge can trigger a strong bullish move. The structure suggests a potential push toward the 69,000 – 69,200 resistance zone if buyers step in with volume.
🔹 Falling wedge pattern (bullish reversal)
🔹 Higher lows forming inside compression
🔹 Key breakout level near current consolidation
🔹 Target zone: 69K area
Watching for a clean breakout and retest for confirmation. This setup offers a good R:R for intraday traders.
Trade safe. Wait for confirmation

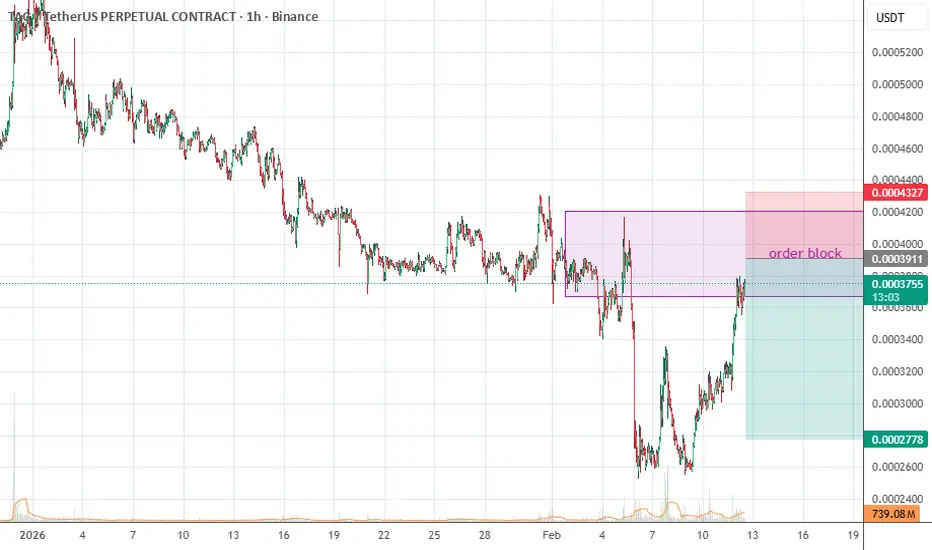
TAGUSDT plan 12-02-26TAGUSDT plan 12-02-26
The price is already in the supply area, currently moving sideways. In that area,
we'll try setting a sell limit in that area, at the top.
Since there are no signs of rejection yet, the price will likely move sideways for a while. Then, we'll wait for a rejection candle or bearish engulfing candle to appear.
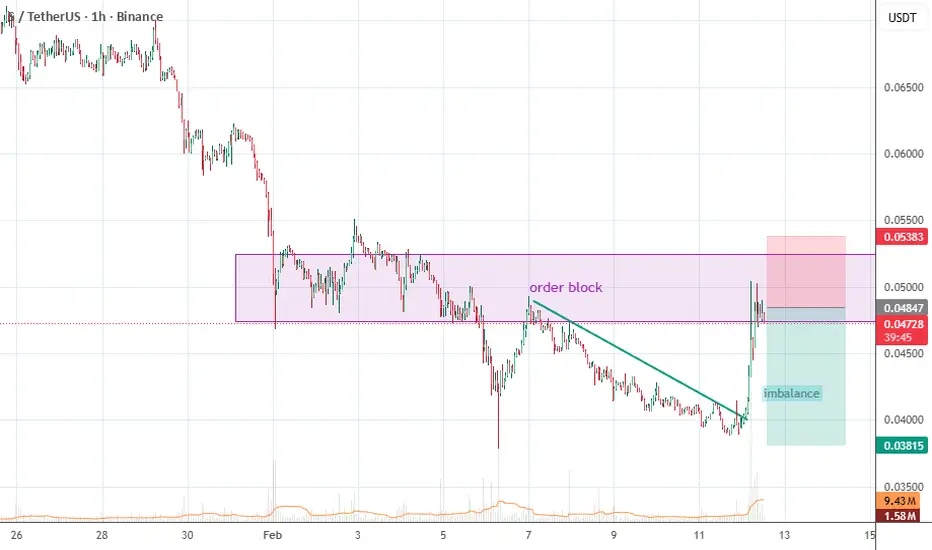
SUSDT plan 12-02-26SUSDT plan 12-02-26
The price is now at the supply level. On the 1-hour timeframe, the price is forming a base,
and below it, there is an imbalance. We'll try to set a sell limit in the supply area,
with the target of filling the imbalance area.
LINEAUSDT plan 12-02-26LineaUSD plan 12-02-26
The price has pumped and there's a rejection in the supply area.
There, we can try setting a pending sell limit in the supply area.
Because it's not at the high end, we can adjust the order size to avoid excessive risk.

XAUUSD (Gold Spot) – 1H Chart Analysis & Trade IdeaMarket Structure
Gold has shifted into a short-term bullish structure after forming a higher low and reclaiming the key support zone. Price is consolidating above the former resistance, which is now acting as support—a typical continuation setup.
Key Levels
Support / Entry Zone: 5,000 – 5,030 (blue zone, prior resistance turned support)
Stop Loss: Below 4,950 (red zone, structure invalidation)
Target: 5,100 – 5,150 (green demand/supply objective)
Trade Idea
Bias: Bullish continuation
Entry: Buy on pullback into the support zone or on bullish confirmation above it
Stop Loss: Below the marked stop-loss zone to protect against a breakdown
Take Profit: Target the upper demand zone for continuation upside
Confluence
Break-and-retest of resistance as support
Higher low formation on H1
Momentum holding above the support line
Risk Management
Maintain disciplined position sizing. If price closes decisively below the support zone, the bullish setup is invalidated.
This idea is based on technical structure and zone analysis. Always manage risk according to your trading plan.

LINK / USDT Reclaims Support — Bullish Move Towards $12 PossibleLINK / USDT has reclaimed its strong support zone after sweeping downside liquidity, indicating bullish strength. As long as price holds above the $8.47 – $8.43 area, a continuation towards the $12 level remains highly possible if overall market conditions stabilize. However, due to current BTC weakness, caution is advised—trade only with proper confirmation and consider taking profits at multiple targets. A breakdown below the support zone will invalidate this setup temporarily.

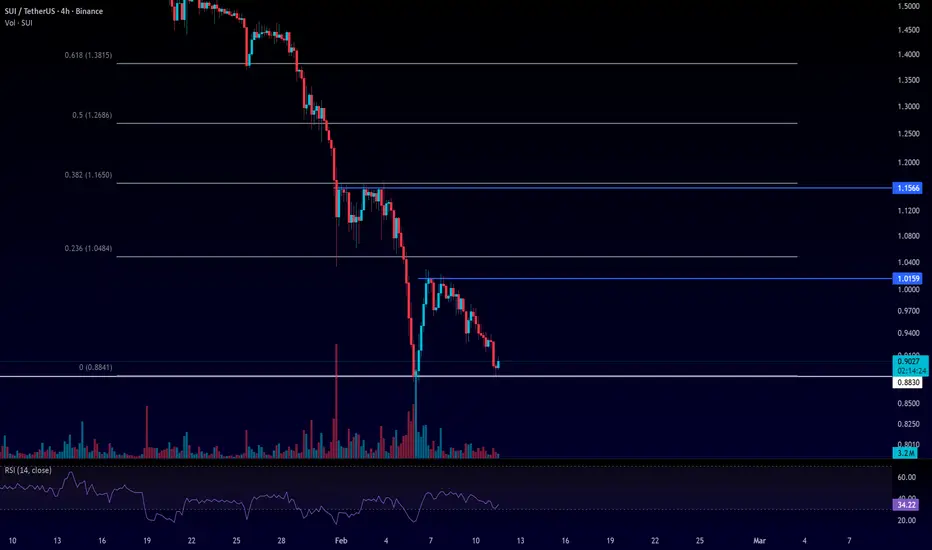
TradeCity Pro | SUI Bears Stay in Full Control👋 Welcome to TradeCity Pro!
In this analysis, I’m going to take a look at SUI, one of the Layer 1 projects, currently ranked #26 on CoinMarketCap with a market capitalization of $3.43 billion.
⌛️ 4-Hour Timeframe
On the 4-hour chart, this coin is in a very strong downtrend, and in its latest bearish leg, price dropped all the way to 0.8830.
🔔 After this move, price entered a corrective and consolidation phase, but the bearish trend is so strong that price couldn’t even retrace to the 0.236 Fibonacci level, and resistance formed before reaching it.
⚖️ The level that price reacted to during this correction is 1.0159, and after rejecting this zone, price moved back down toward 0.8830.
🧮 If 0.8830 breaks, the next bearish wave for SUI will begin. Therefore, a break of this level can be used as a short trigger.
📊 It’s very important that selling volume increases at the same time as the break of 0.8830, to confirm seller strength. A renewed move of the RSI into the oversold zone would also be a strong momentum confirmation.
✔️ During the corrective move up to 1.0159, the RSI oscillator couldn’t even move above the 50 level, which clearly shows the strength of the bearish trend. So if, during the next sell-off, RSI once again enters oversold territory, price could continue its downtrend with very strong momentum
❌ Disclaimer ❌
Trading futures is highly risky and dangerous. If you're not an expert, these triggers may not be suitable for you. You should first learn risk and capital management. You can also use the educational content from this channel.
Finally, these triggers reflect my personal opinions on price action, and the market may move completely against this analysis. So, do your own research before opening any position.
TradeCityPro | Bitcoin Daily Analysis #265👋 Welcome to TradeCity Pro!
Let’s move on to Bitcoin analysis. The market has finally started its bearish move.
⌛️ 1-Hour Timeframe
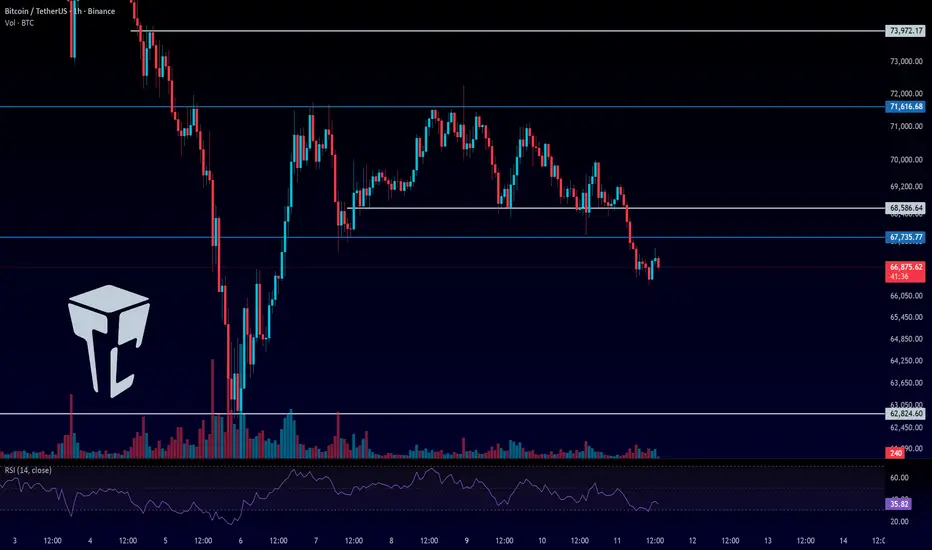
Yesterday, we had two short triggers on Bitcoin. The first was the break of 68,586, and the second was the break of 67,375.
✔️ If you opened a position on the break of either of these levels, price has now reached the target, and you can take profits.
🔍 That said, I believe there’s still a good chance price continues toward Bitcoin’s main low at 62,824. For that reason, I suggest securing partial profits and keeping the rest of the position open.
💥 If the RSI enters the oversold zone, the probability of this move increases significantly. Volume is also currently in favor of the sellers, with red candles showing stronger volume than green ones.
✨ Based on this, the chances of price moving down toward 62,824 are high. However, if you didn’t enter using yesterday’s triggers, we don’t have a new trigger today on Bitcoin itself, and we need to wait for a new structure to form.
⚖️ If this bearish move that started yesterday turns out to be a fake move, and price manages to stabilize back above 68,586, strong bullish momentum will enter the market, and the probability of breaking the 71,616 high will increase significantly.
🎲 So we need to stay alert and, if yesterday’s move gets invalidated, look for long opportunities.
🔔 As for short positions, just like I mentioned, we don’t have a new trigger today and need to wait for fresh structure to develop.
❌ Disclaimer ❌
Trading futures is highly risky and dangerous. If you're not an expert, these triggers may not be suitable for you. You should first learn risk and capital management. You can also use the educational content from this channel.
Finally, these triggers reflect my personal opinions on price action, and the market may move completely against this analysis. So, do your own research before opening any position.