AVL Set to Surprise Investors with Massive Breakout $0,50+AVL Set to Surprise Investors with Massive Breakout Potential — Target $0.50 🚀
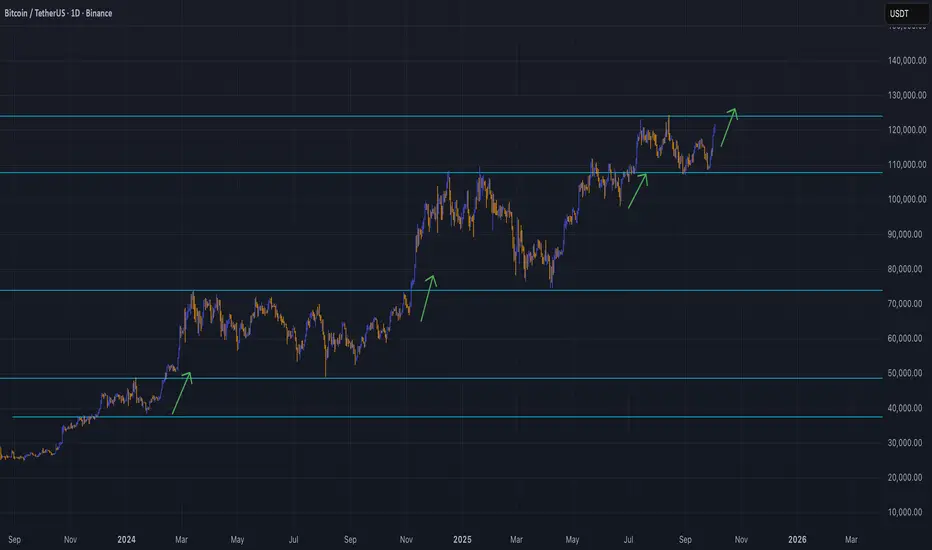
We are going to follow it as we did follow BTC below 110K to up to 124K
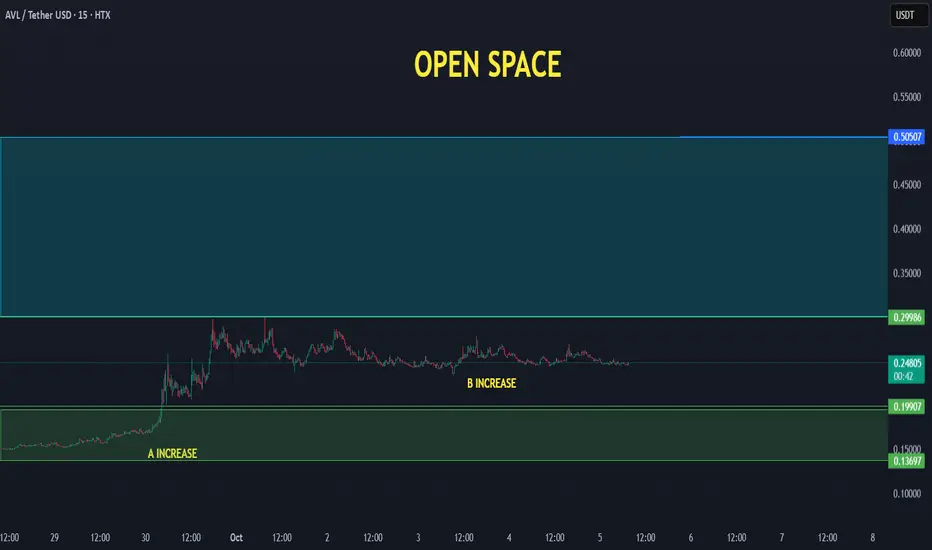
AVL/USDT continues to build strength after confirming its B increase phase, holding firm around the $0.24 – $0.26 range. This consolidation is happening just below a large open space zone, suggesting that a strong move could follow once momentum returns.
✅ A & B increase structure confirmed: The market shows a repeating cycle pattern, preparing for a C leg breakout.
✅ Open space to $0.50: Once AVL breaks above $0.30, there is very little resistance until $0.50, creating room for a powerful rally.
✅ Volume stability: Current sideways accumulation supports the potential for a sudden move as liquidity builds.
Technical Outlook:
As long as AVL holds above $0.24, bullish momentum remains intact. A breakout above $0.30 could ignite a sharp move toward the $0.50 target zone — aligning with prior high-volume cycles.
📈 Bias: Bullish
🎯 Targets: $0.30 → $0.42 → $0.50
Cryptomarket
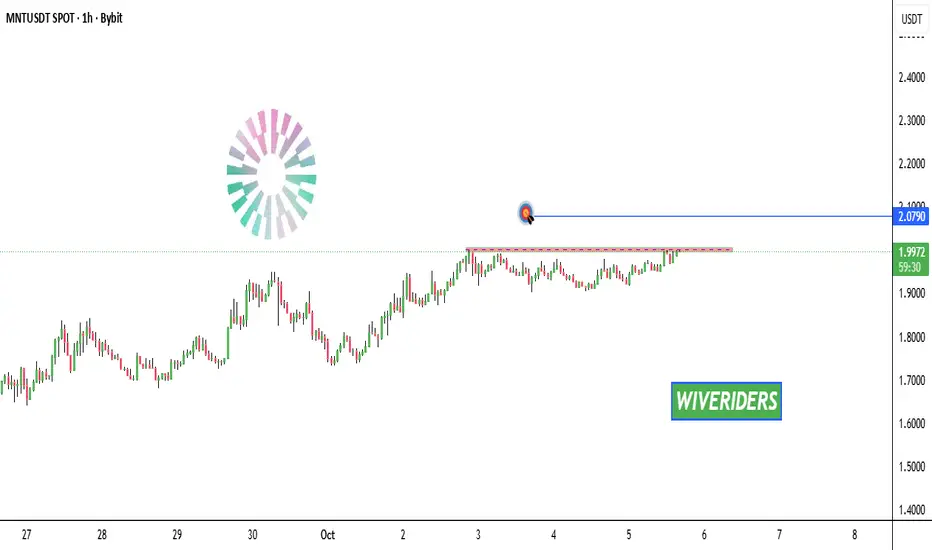
MNT Update📊 📊 MNT Update
MNT is testing the red resistance zone 🔴
If it breaks out, the first target will be the blue line level 🎯
Wait for confirmation before entering — a breakout could indicate the start of a bullish continuation 🚀
HYPE Update📊 GETTEX:HYPE Update
GETTEX:HYPE is testing the red resistance zone 🔴
If it breaks out, the first target will be the blue line level 🎯
Wait for confirmation before entering —

A VERY Bullish sign for Bitcoin but with a possible Warning
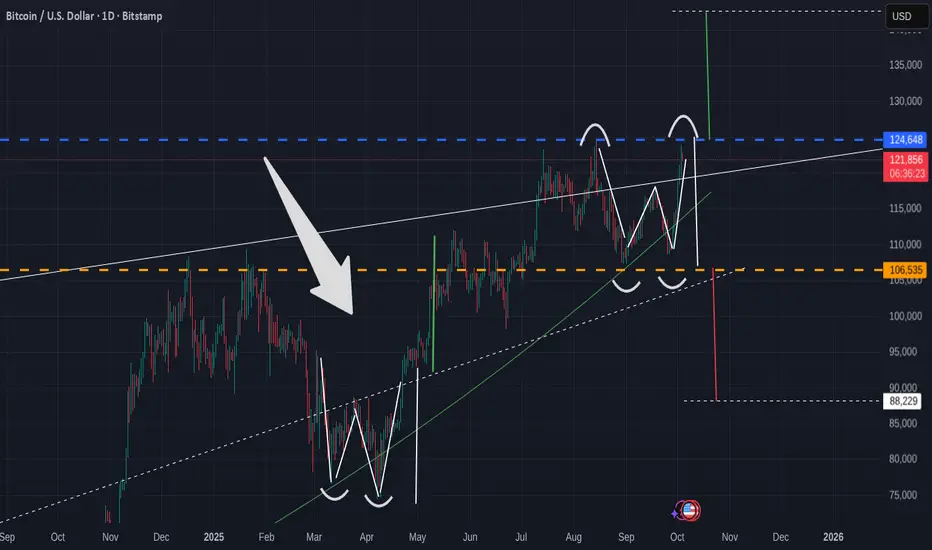
A Very simple Bitcoin Daily chart
Obviously, the eye is drwan to the Arrow pointing towards March / April 2025 when Bitcoin PA printed a W patter, or a double bottom.
The Vertical lines show the measured move higher that was executed perfectly.
The question we have right now is, have we just printed another W pattern, with a Measured Move higher to 142K usd
Or Have we just printed a Double TOP with a measured move LOWER to around 88K usd
4 days ago I posted the Monthly Charts and mentioned that we may start October with a Drop, that may last till around 12 - 15 October.
Untill this measured move plays out, I stand by this But I am obviously also open to this not happening.
What ever happens, I have learnt over the years to be ready for BOTH sides of the coin.
I DO have a BUY SPOT order placed for Bitcoin at 92K
IF we get down there,,IF,,,,,It may well be thelast time we get the chance to Buy Bitcoin under 100K
Time will tell
TradersCity Pro | Solana Bulls Eye Breakout Beyond Resistance👋 Welcome to TradeCity Pro!
In this analysis, I’ll be breaking down Solana (SOL),one of the most popular “Ethereum Killer” projects, currently ranked #6 on CoinMarketCap with a market cap of $122.87B.
⌛️ 4-Hour Timeframe
On the 4-hour chart, Solana started a bullish move after being supported at the $194 zone. Once it broke the trigger at $213.14, it rallied strongly toward the next resistance zone I’ve marked on the chart.
✨ At the moment, that bullish wave has cooled off. The RSI has exited the overbought zone, and price has been rejected from the resistance ceiling.
✔️ The next bullish trigger we’re watching will be a clean breakout of this resistance zone. On future retests, we can identify the exact resistance level more precisely and use it as an actionable entry trigger.
⭐ The main resistance for SOL is at $248.58. A breakout here would confirm the start of a larger bullish wave in the higher cycles. That’s why it’s important to already have a position before this breakout—so if the level flips, you’re not left behind and your earlier long runs into solid profit.
🔍 If price pulls back, the outlook remains bullish as long as SOL stays above $213.14. In that case, I see more probability for the next bullish leg than for a trend reversal.
📊 However, if $213.14 breaks and price consolidates below it, that would be the first confirmation of a bearish shift and a possible trend reversal.
📝 Final Thoughts
Stay calm, trade wisely, and let's capture the market's best opportunities!
This analysis reflects our opinions and is not financial advice.
Share your thoughts in the comments, and don’t forget to share this analysis with your friends! ❤️

AIA Update📊 AIA Update
AIA has made a new all-time high (ATH) 🚀
If the strength continues, we can expect the price to move toward the blue line level 🎯

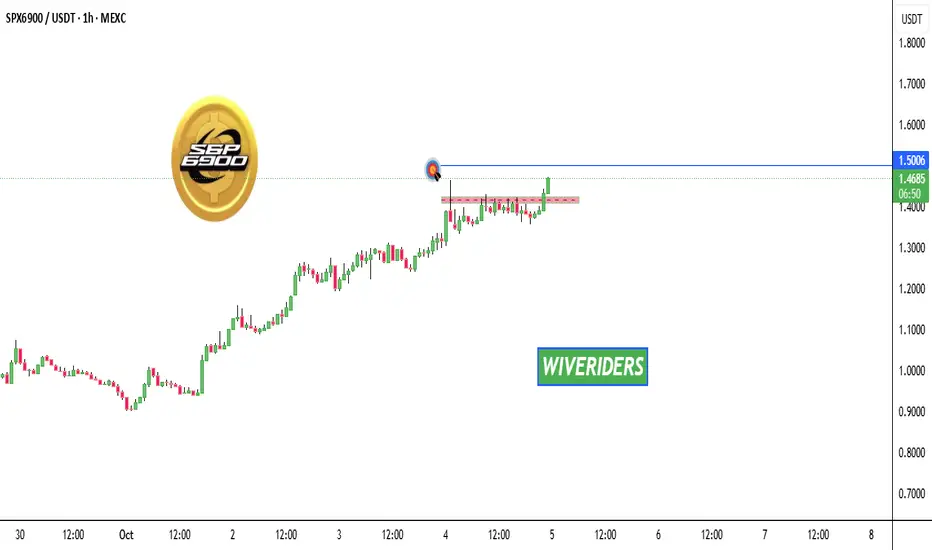
SPX Update📊 SPX Update
SPX has broken out of the red resistance zone ✅
and is now approaching the first target — blue line level 🎯
Momentum looks strong — watch for continuation or possible pullback at target zone ⚡
Bitcoin Trap or Breakout? Triple Top or Hidden Accumulation? Bitcoin is stalling at key resistance after a massive rally… but is this a distribution trap before a pullback, or accumulation building for the next breakout?
Huge volume with small candles and declining momentum raises the question: Are we topping, or loading for liftoff?
Watch the chart, decide for yourself and share your thoughts in the comment section — Distribution or Breakout?
Thanks for your time

GUN 2H AnalysisHere is an analysis of GUN on 2H TF. It has broken down trendline with high volume. Expected targets are given on charts. NFA DYOR

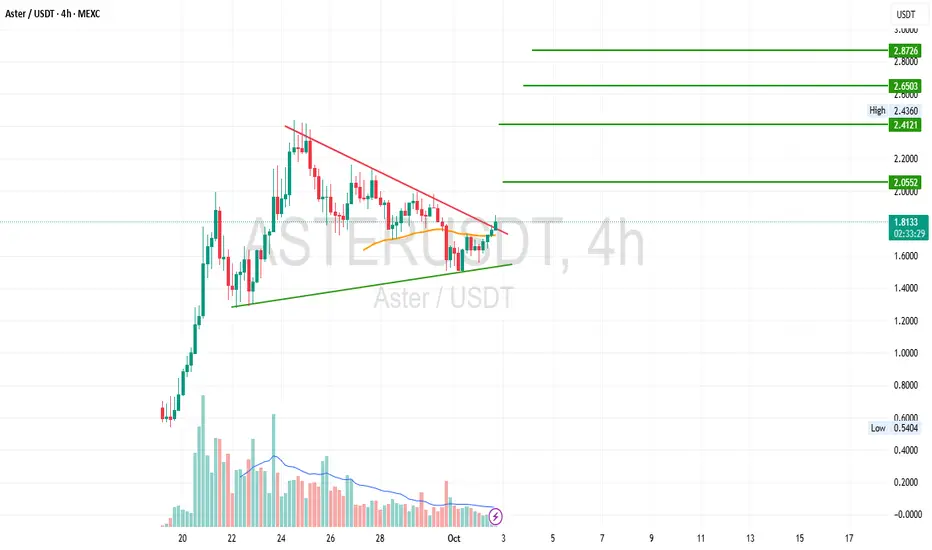
ASTER 4H Trade Idea$Aster has broke down trenline on 4H TF which quite strong indication. Expected targets are given on chart. NFA DYOR
BITCOIN HIGH PROBABILITY SETUP SOON!!!🚨 BTCUSD HIGH PROBABILITY SELL SETUP 🚨
* Here We Can See Clearly The Next Potential Moves For BTC Coming Hours/Days.
* Keep Your Eyes Close On Your Trading Positions.
* Happy PIP Hunting Traders.
FXKILLA.

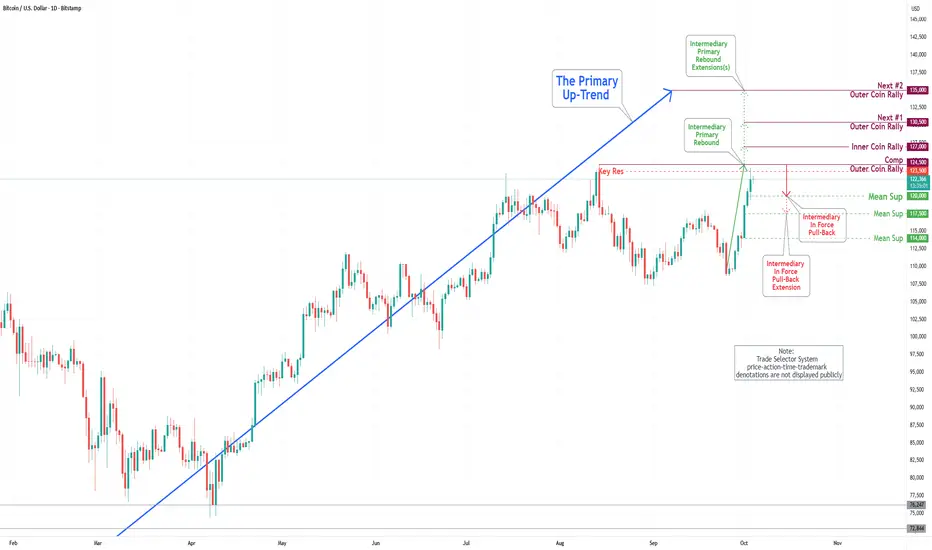
Bitcoin(BTC/USD) Daily Chart Analysis For Week of Oct 3, 2025Technical Analysis and Outlook:
During the most recent trading session, the Bitcoin market exhibited a notable surge, surpassing our Mean Resistance levels of 111600 and 113300, and the established Inner Coin Rally threshold of 117700. Currently, Bitcoin is fluctuating around the Key Resistance level of 123500 as it attempts to retest the completed Outer Coin Rally at 124500.
Following the conclusion of this retest, it is anticipated that the cryptocurrency may initiate an Intermediary In-Force Pullback towards the Mean Support target of 120000, with the potential for a further correction dip to Mean Support at 117500. Upon the completion of this phase(s), we expect Bitcoin to resume its upward trajectory.
Current analysis suggests the following designated upside targets: the Inner Coin Rally at 127000, the Next #1 Outer Coin Rally at 130500, and the Next #2 Outer Coin Rally at 135000. It is essential to recognize that Intermediary In-Force Pullbacks may occur at these specified levels.
BITCOIN STILL IN THE ZONE - UPDATE 03-10-2025📊 Market Update
BTC remains positive on the lower time frame at 119.8, while the main trend is holding at 110.3. In the next BTC update, we’ll see whether BTC is still maintaining its positive structure — any new changes will be added.

BTC vs. The Broader Market: A Dangerous Powerful Wave is Coming Today, we're taking a deep dive into the two most important charts in the crypto space: Bitcoin (BTC/USDT) and the Total Crypto Market Cap (TOTAL). Using an Elliott Wave framework on the weekly timeframe, we can see a clear bullish structure taking shape. However, some underlying weaknesses in key indicators warrant a cautious approach. Let's break it down.
1. Bitcoin (BTC/USDT): The Path to a new All-time high Hinges on a Key Level
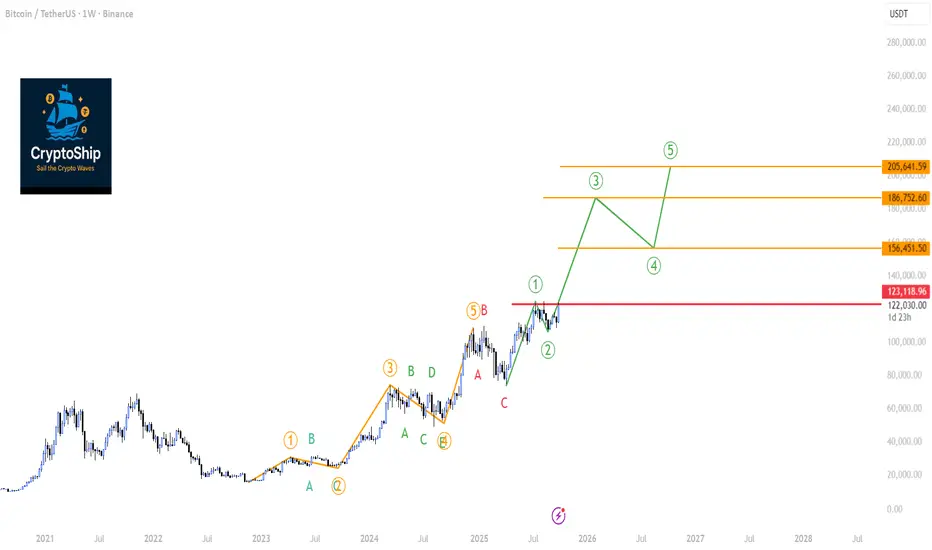
As we can see on the weekly chart, Bitcoin appears to have completed a major five-wave impulse cycle which topped out around the $108,000 mark. This was followed by a necessary ABC corrective phase.
The exciting part is what comes next. We are potentially witnessing the beginning of a brand new five-wave impulse.
Wave (1): Appears to have started from the $74,000 low and peaked near $124,000.
Wave (2): A healthy correction followed, finding support around $107,000.
If this count is valid, we are now in the early stages of Wave (3), which is typically the most powerful and extended wave in an impulse sequence.
The Critical Condition:
For this bullish count to remain the primary scenario, the current weekly candle must NOT close below $123,000. A weekly close below this crucial level would risk invalidating the start of this new impulse, suggesting that we may still be within a more complex corrective structure (such as a regular flat correction Check the article).
Also during wave (3) the Weekly RSI must go beyond "80" showing strong momentum ( if it fails to do so then it's a caution signal to be strongly considered because a reversal could happen at any time!)
Indicator Analysis:
Bearish Divergences: We must note the lingering bearish divergences on both the RSI and MACD. These signals are suspicious and suggest that momentum is not fully confirming the recent price highs. They need to be monitored closely.
Volatility Coiling: The Bollinger Band Width Percentile (BBWP) is showing significant contraction. This coiling of the bands indicates that weekly volatility is decreasing, which often precedes a massive price expansion in the coming weeks or months, However the lack of BBWP exhaustion (spectrum crossing 90%) remains a bullish sign combined with the contraction
Trend Strength: The ADX is rising on the weekly chart, confirming that a strong trend is in progress.
Volume: On-Balance Volume (OBV) and general volume profiles appear adequate for now.
2. Total Crypto Market Cap (TOTAL): The Broader Market Picture
The Total Crypto Market Cap chart tells a very similar story, reinforcing our Bitcoin analysis. The bullish phase began in sync with BTC back in November 2022.
The current Elliott Wave structure for the entire market is as follows:
Wave (1): Completed in March 2024.
Wave (2): Corrected into May 2024.
Wave (3): Finshed on March 2024
Wave (5): Finshed on December 2024
Currently the Total market cap chart is closely alligned with BTC chart which confrims the BTC leadership is intact. The current Elliot count of TOTAL market cap indicated wave (1) started April 2025 but curretly wave 2 showing caution signals
A Significant Red Flag - The Volume Divergence:
While the price structure remains bullish, there's a concerning signal under the hood. On the weekly RSI, we see a double bottom pattern, which is typically bullish. However, looking at the On-Balance Volume (OBV) during the same period, the OBV printed a lower low.
This is a classic bearish divergence between price/momentum and volume. It indicates that the recent push higher is not being supported by genuine, strong volume, suggesting conviction is weak.
Alternative Scenario:
If this volume weakness persists, we might see Wave (2) extenstion to around $3.23 Trillion. This would lead to a deeper Wave (2) correction, From that support, Wave 3 could launch that would still likely reach our ultimate ATH.
Conclusion: Bullish Outlook with a Note of Caution
Bringing both analyses together, the macro view for the crypto market remains decisively bullish. The Elliott Wave structures on both BTC and the TOTAL chart point towards significantly higher valuation, the lack of BBWP exhaustion on weekly charts of BTC & Total market cap remains a strong bullish indication combined with the BBWP expansion.
However, the market is showing signs of fatigue. The bearish divergences on Bitcoin's indicators and the critical volume divergence on the TOTAL chart cannot be ignored. This suggests that while the overall destination is uptrend, the journey might include a corrective dip before the next explosive leg higher.
Key Takeaways:
Overall Bias: Bullish.
Key Level for BTC: Watch the weekly close relative to $123,000. This is our line in the sand for the current impulsive structure.
Key Concern: The lack of strong volume confirming the market's recent move up warrants caution.
Volatility: Brace for a significant expansion in price movement. The compressed BBWP on both charts suggests a major move is brewing.
Stay vigilant and manage your risk accordingly. The next few weekly closes will be critical in determining whether we blast off directly or take a detour first.
AVL/USDT (AVALON LABS) WILL THE BURN SYSTEM BREAKOUT THIS COIN..This is a cycle update with the DCA effect.
The coin has entered a new DCA phase, which includes the possibility of a decrease in supply. A reduced supply could support higher prices, especially with the team’s burning mechanism that has already been implemented in part. If the burning system continues as expected, there is a strong chance that the price of this token could soon target $0.50.
✅ Fact: Avalon Labs has already conducted significant burns (e.g., ~80M AVL and later ~14M AVL), which reduced supply.
✅ Possible outcome: If they continue burning tokens and demand remains stable or grows, the reduced supply could push the price upward — mathematically, $0.50 is a reasonable short-term target (especially given the ~$0.26–0.27 current range).

$PUDGY: Watching for Flag Breakout
The CSECY:PENGU is still contained within the flag pattern, following a strong rally. While there’s upward momentum, the breakout hasn’t fully occurred yet.
Key points:
Resistance: Watch the 0.032 area as the flag's upper boundary. A breakout here could confirm a continuation of the bullish trend.
Support: The 0.026 support zone remains crucial. If price holds here, it could set up for another push higher.
For now, the price is stuck in the flag pattern, with the breakout above resistance being the next key move.
Follow us and stay tuned for more updates.
#PEACE
DYOR, NFA

SOL: Ready for a Big MoveWe can see CRYPTOCAP:SOL is currently in a period of accumulation, just like it was back in 2021 before a massive rally . The key rising support line has been holding up strong, and after periods of accumulation, the price has consistently exploded upwards, reaching new highs.
Right now , the price is approaching its previous all-time high (ATH), and if history repeats itself, we could be in for another "boom" phase. The price is holding well above the key support, which strengthens the bullish outlook.
Keep an eye on the price action around the ATH level, if we break through, it could signal the next major leg up. This setup looks very similar to past accumulation phases that led to significant price jumps.
#PEACE
Stay tuned for more updates

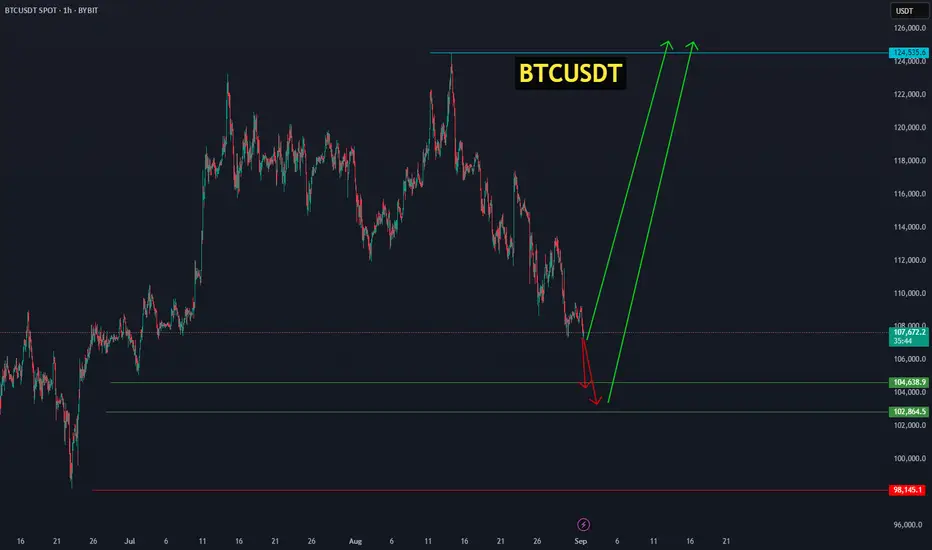
Bitcoin from the 102,864 zone is set to ignite its next bullish Bitcoin will either start its upward move from the current price or from the range of 104,638.9 – 102,864.5, aiming for targets between 118,000 and 124,535. BINANCE:BTCUSDT
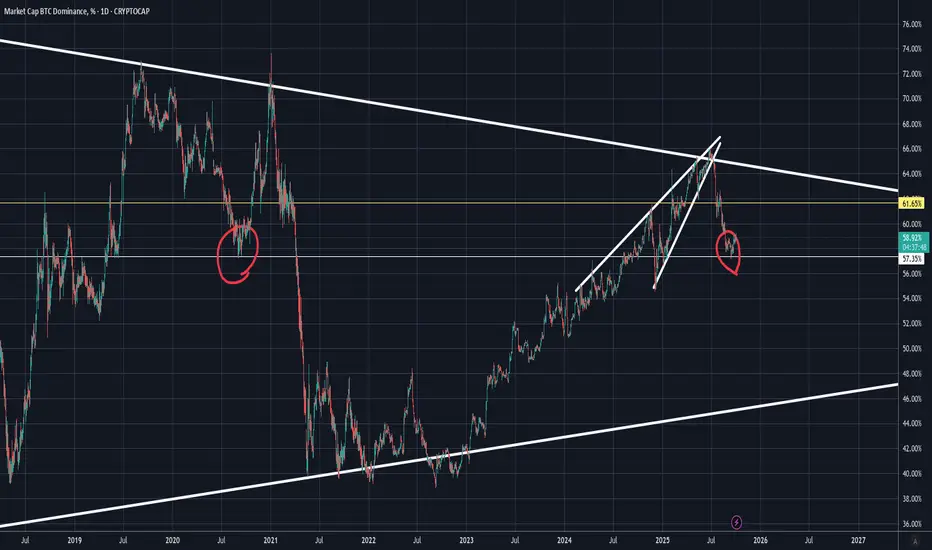
Bitcoin Dominance Bouncing as in 2020Bitcoin Dominance has bounced at the same level where it did during the 2020 bull market, right before the 2021 Alt Season.
The yellow line marks my first target.
Another thing worth of mention is the giant triangular pattern currently forming.
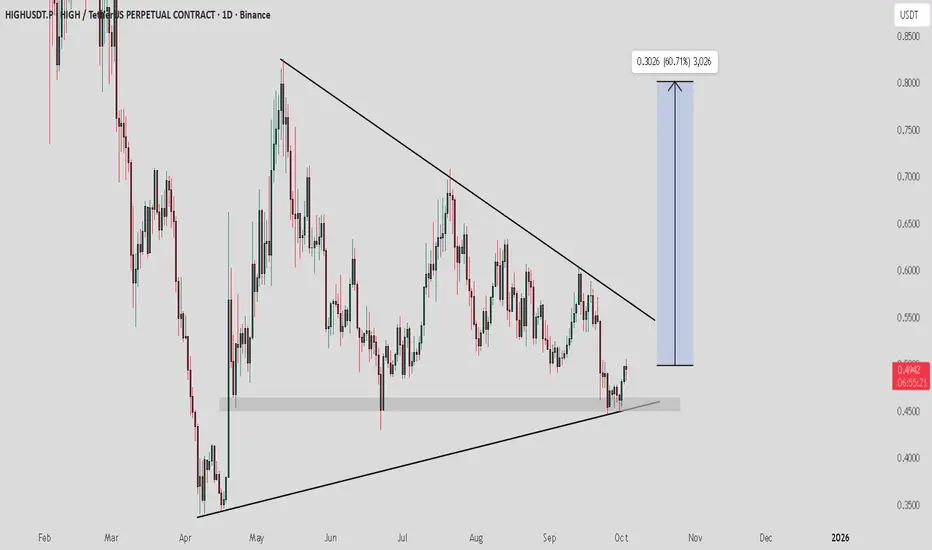
HIGH / USDT : Momentum building after bouncing backHIGH is bouncing back from strong support and is now heading towards trendline resistance. If momentum sustains and the breakout confirms, we could see a rally towards $0.70 – $0.85.
Manage risk wisely—any breakdown below the support will invalidate this setup.
BTC 1D analysisWhat will happen next? Will BTC break the previous high or will fall up to retest zone? Please comment your guess...

CAKE 3D AnalysisHere is an analysis of CAKE on 3 Day time frame. It has broke long term down trendline on 3 Day time frame. We can expect the next targets as expected on chart. NFA DYOR.

Is Bitcoin ready to go parabolic?If you see us restart posting trading ideas, you know the news must be good. Bitcoin has once again crossed $120k. Interest rates are going down, liquidity is rising. The pathway to a new Bitcoin All-Time-High seems firmly in sight. Even Altcoins, not a source of great joy so far this cycle, have seen momentum. Ethereum, Solana and other large-cap Alts are hovering near all-time-highs. The 'meta' of Perp Dexes has propelled HYPE, the currency of Hyperliquid, into the Top 20 Market Cap coins. The 'catchup trade' for other Perp Dex tokens such as Aster saw tokens jump 100%+ in a matter of hours. The animal spirits are back.
In each crypto-cycle there are multiple simultaneous trends. Some of the are purely speculation, others are actual technical innovations, others are on the political front. This cycle so far has seen the by-far most positive political breakthroughs for the industry. Stablecoin bills and regulation in jurisdictions such as the US and Europe allowed stablecoin use-cases to reach breakout velocity. In line with that comes accessible yield, as stablecoins are often backed by US bond yields, and payments. On the scalability front, rollups, extremely fast chains, zero-knowledge scaling technology and next-gen chains such as Monad or MegaETH have become available and at least somewhat battle-tested. There is still no solution to the Blockchain trilemma of how to achieve scalability, speed and decentralization. Yet it is obvious that we are on the road to a solution. That is extremely bullish for the promise of Blockchains to eventually become the backbone for large parts of finance.
In the meantime, this cycle's crypto price action has not managed to keep up with stock markets. The boom of AI has led to ever higher highs for the largest benefactors such as Google or Nvidia. The proliferation of ETFs that give exposure to new 'hot' topics, from modular nuclear to data centers, has made stock investing extremely accessible to retail investors. Many of these retail investors have previous first-hand knowledge of crypto markets' volatility and have so far refused to re-enter in the same numbers as last seen during the 2021 Bull market.
Will a new Bitcoin all-time-high change this and lure traders back into crypto markets? The probability of this happening remains but the pathway is less obvious. First and foremost, Crypto needs to see 'large new winners'. Nothing gets a retail trader back like watching their friend earn significant returns from a 100x on a new coin. But too many retail traders lost out in this cycle's launches due to insiders, overvalued market caps and a general lack of demand. Too few genuine retail participants have 'won'. For now though, Bitcoin continues to rise higher. The cycle continues. We ride on.