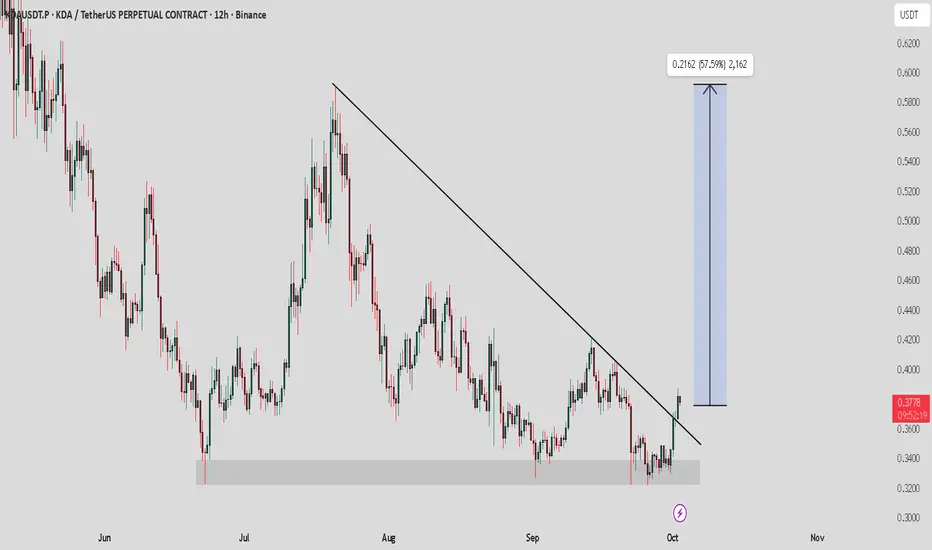
KDA / USDT : Momentum building after a successful breakoutKDA / USDT has confirmed its breakout with strong potential. If momentum sustains, we can expect a bullish rally towards $0.50 – $0.60.
Always manage risk wisely and avoid entering without proper confirmation.
Cryptomarket
TradeCityPro | Bitcoin Daily Analysis #186👋 Welcome to TradeCity Pro!
Let’s move on to Bitcoin analysis. Bitcoin is still pushing upward, so let’s review the market conditions together.
⌛️ 4-Hour Timeframe
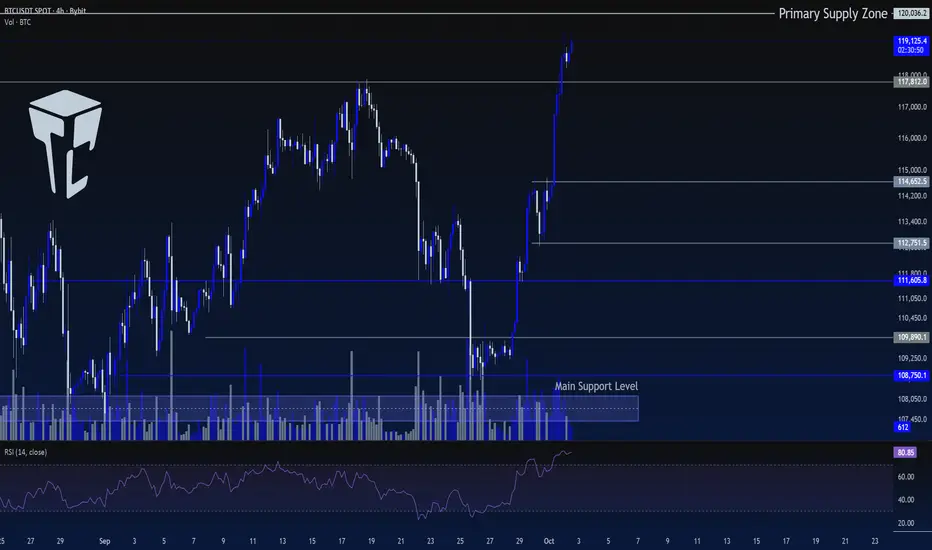
Yesterday, Bitcoin reached the next resistance level at 117,812.
🔍 On the lower timeframes, there was a small rejection from this zone, but on the 4-hour chart, price managed to hold above it and is now moving toward the 120,036 level.
🔔 Given the strong buying power and the heavy volume in the market, I believe the probability of continuation to the upside is very high, and price could push to even higher zones.
💥However, the RSI oscillator is currently deep in the overbought zone, sitting around 80. That’s quite an extreme level, and a correction in RSI is almost certain soon.
✔️ This doesn’t necessarily mean the uptrend is over. Price can still continue upward while RSI corrects.
⚡️ As long as RSI remains above 70 and stays in overbought territory, I expect the bullish leg to continue. Once RSI stabilizes below 70, price may enter a corrective phase.
⭐ In that case, we can look for long triggers during the price correction to catch the next bullish wave.
📊 If Bitcoin keeps rallying, the next zone to watch as a potential trigger will be 120,036. A reaction at this level could give us a new long setup.
💫 That said, on the first touch of 120,036, I personally won’t be opening a position—even if it breaks. I’ll wait for more structure to form before making an entry.
❌ Disclaimer ❌
Trading futures is highly risky and dangerous. If you're not an expert, these triggers may not be suitable for you. You should first learn risk and capital management. You can also use the educational content from this channel.
Finally, these triggers reflect my personal opinions on price action, and the market may move completely against this analysis. So, do your own research before opening any position.
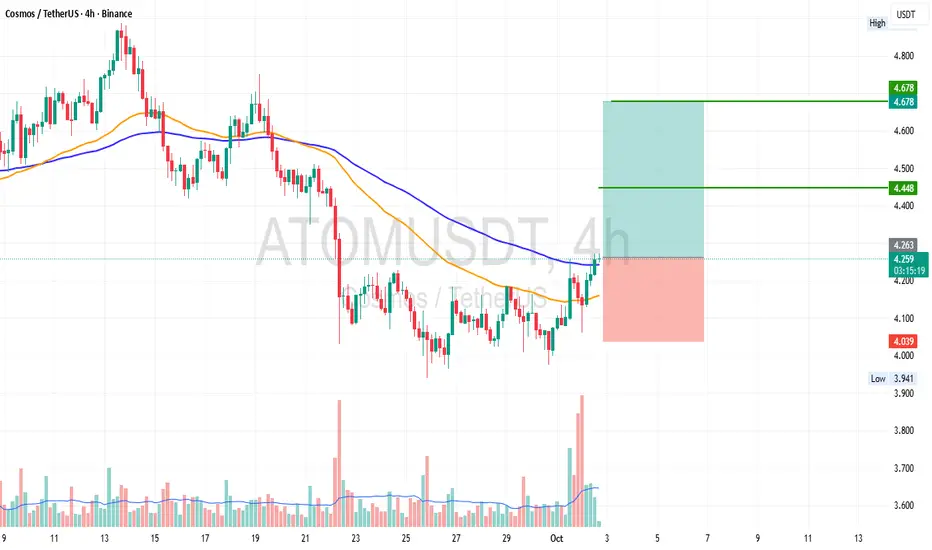
ATOM 4H Trade ideaATOM is going good. We can execute long trade here. Entry & Exit points are given on chart. NFA DYOR
BTCUSDTHello Traders! 👋
What are your thoughts on Bitcoin?
Bitcoin continues to move within a valid ascending channel. After a recent correction, price successfully broke above the descending trendline and reclaimed a key resistance area.
Currently, the previous high near the 120,000 level is acting as a resistance barrier. A short-term pullback toward the broken structure is expected. If this area holds as support, the price is likely to resume its upward move and attempt to break the previous high.
As long as the price holds above the support zone and the bottom of the ascending channel — and does not break below the previous low — this bullish scenario remains valid.
The medium-term outlook remains positive, and pullbacks may offer new buying opportunities.
What do you think? Will Bitcoin break above the previous high, or is a deeper correction ahead?
Don’t forget to like and share your thoughts in the comments! ❤️

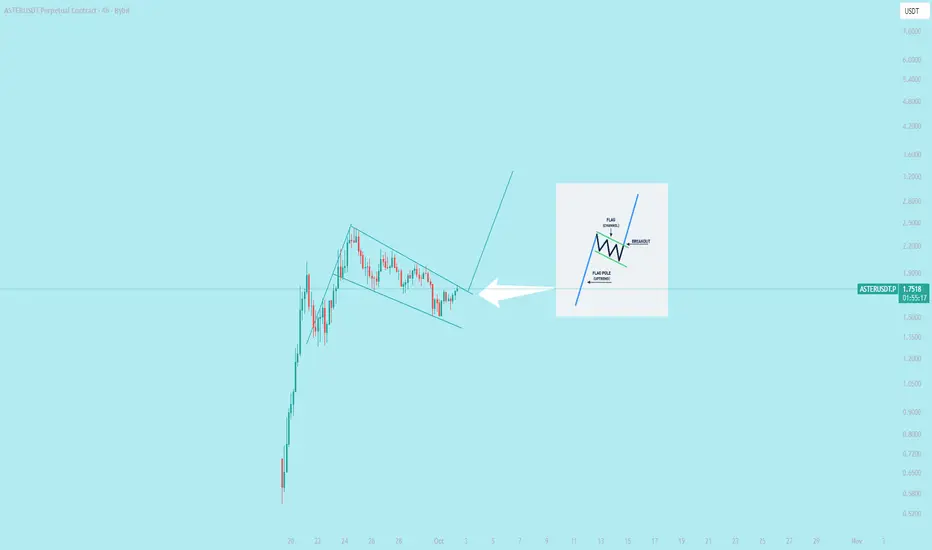
Is Aster Ready for an Upside Surge?$ASTER bounced before reaching the key zone, but now it's facing a slight rejection at the trendline. If it manages to close successfully above the resistance line, we could see a solid upside move.
Keep a close eye on this setup, it might just break out soon.
DYOR, NFA
Stay tuned for more update and follow us on tradingview!

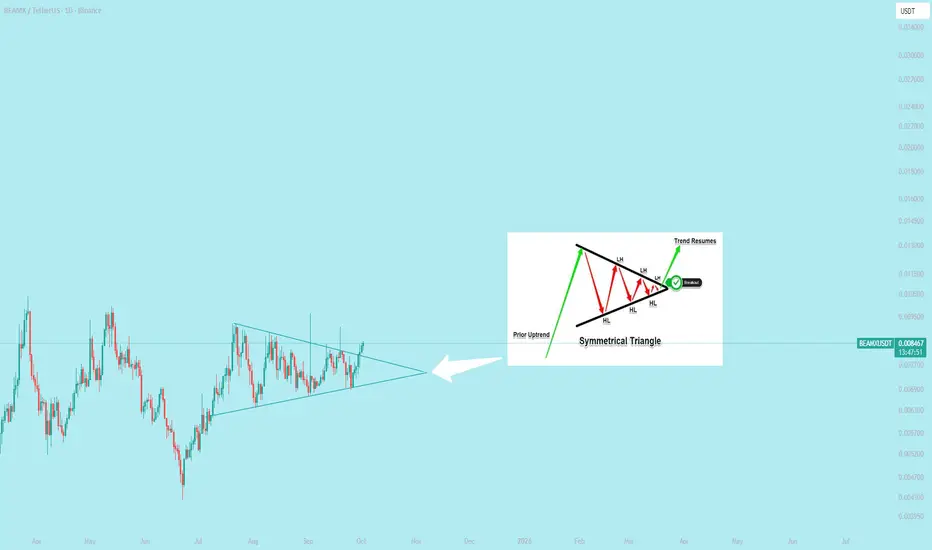
$BEAMX Breakout bullish symmetrical pattern in Daily time frame
**Execute the trade**
Once the breakout is confirmed, there are two primary entry strategies:
**Aggressive entry**: Enter a long position immediately after a candle closes above the upper trendline.
**Conservative entry:** Wait for a retest of the broken trendline, which now acts as a support level. Enter a long position when the price bounces off this line. This approach offers a tighter stop-loss but may cause you to miss the trade if the price does not retest the trendline.
@everyone
Has the Toxicity of Ethereum been seen? Charts never Lie
It really is as simple as that
THESE ARE THE DAILY TOTAL CRYPTO MARKET CAP CHARTS
Top line - TOTAL Crypto Market Cap - TOTAL 2 (Excluding BTC )
Bottom Line - TOTAL 3 ( Excluding BTC & ETH ) - OTHERS ( Top 125 coins minus Top 50 by market cap )
TOTAL 3 is ALL ALT coins
OTHERS is Mid to Lower Cap ALT coins
These 4 Charts use the VRVP
the Volume Profile Visible Range (VPVR), is a technical analysis indicator on TradingView that displays the distribution of trading volume at different price levels within the currently visible range of a chart.
The Colour Key is below
Value Area High ( VAH ) - Yellow Dashed Line
Value Area Low ( VAL ) - Red Dashed line
Point of Control ( POC ) - Red Dotted line
Developing POC - Blue Dashed line
Developing Value Area - Purple Dotted line
The Thing to note here is how EVERY TOTAL chart is above its own Value Area High EXCEPT the TOTAL 2 Chart
TOTAL 2 is all Crypto except BTC, so it is not BTC holding this back.
The TOTAL 3 chart , that is Everything except BTC and ETH. is above its own Value area High, nothing holding it back.
This clearly shows that ETH is the Stagnant Crypto token here.
We could start talking about how the SEC refused to state if ETH was ever a security in the days gone past, in the Dark and murky world of pre regulation. How ETH was adopted by the USA as "Its own Crypto". How ETH is NOT decentralised because the more you have, the more "Voting" rights you have. How FTX used ETH in its bribery attempts.
Many consider the ETH to have been the 2nd Crypto to arrive after Bitcoin...This is not the case.. LITECOIN was the 2nd....ETH came many years later.
Anyway..The charts say it all..
ETH is not being asopted really......and compared to BITCOIN.....
The ETH BTC chart also says it all
It has recovered a little But has NOT broken the long term resistance
The Next few weeks are Critical for the Toxic Token.
There is room to ETH to recover and it will likely break that line of resistance but there are certainly better returns and projects to invest in.

$ASTER Perform of a bullish flag in 4hr
A bullish flag is a chart pattern used in technical analysis that signals a continuation of an uptrend. It is named for its resemblance to a flag on a pole. The pattern consists of two parts: the "flagpole" and the "flag".
**How to trade a bullish flag**
Traders can use the bullish flag pattern to identify potential entry, exit, and stop-loss points.
**Entry**: Enter a long (buy) position after the price breaks above the upper trendline of the flag, indicating the continuation of the uptrend. More conservative traders may wait for the breakout candle to close for confirmation.
**Stop-loss:** Place a stop-loss order just below the lower trendline of the flag. This helps protect against a false breakout or a market reversal.
**Profit target:** A common method for setting a profit target is to measure the height of the flagpole and then project that distance upward from the point of the breakout.
@everyone
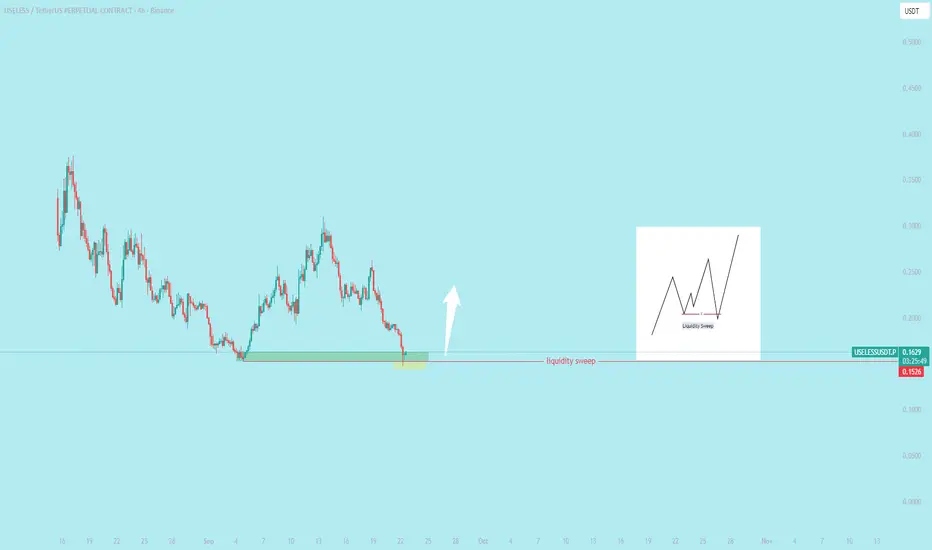
$USELESS liquidity sweep **liquidity sweep** in trading happens when the price of a coin or asset quickly moves to a level where many stop-loss orders or pending orders (buy/sell) are placed, triggering them. These orders are often clustered at key support or resistance levels, like round numbers or recent highs/lows. Large players (like whales or institutions) may intentionally push the price to these levels to "sweep" or clear out this liquidity (execute these orders), allowing them to buy low or sell high before the price reverses.
**In simple words**: It’s when the market price suddenly moves to hit a bunch of stop-losses or pending orders, clearing them out, often before a big price move in the opposite direction. For example, if many traders set stop-losses just below a support level, a liquidity sweep might push the price down to trigger those stops, then bounce back up.
**How to use this in trading**:
- Watch key levels (support/resistance) on charts where stop-losses might cluster.
- Avoid placing stop-losses at obvious levels (e.g., exact round numbers like $0.10).
- For coins like #WLFI or #USELESS, check order books or volume spikes to spot potential sweeps.
- Manage risk by using smaller position sizes and setting stops away from crowded levels.
Always confirm price action and trends before acting, especially with volatile new coins.
ANFIBO | BTCUSD Analysis – Weekly Trading PlanHi guys! It's me, Anfibo. My plan last week gave us a good profit selling from 118,000 USD to 115,000 USD.
And over the past weekend, BITSTAMP:BTCUSD consolidated in a sideways range, consistently holding above key support. However, with the opening of the new week’s Daily candle, the market decisively broke down through this support zone, signaling that selling pressure is now taking clearer control.
From a technical perspective, the next critical support levels to monitor are:
• $113,000
• $111,000
• $109,500
Around the $110,000 region, I view this as a pivotal area to consider initiating spot entries or building larger long-term positions. This zone is not only a technically strong support level but also carries significant psychological weight for institutional and large-scale flows.
Imo, in the short term, BTC may still attempt a retest of the $115,000 level before resuming its downward trend, depending on lower-timeframe reactions. This creates an opportunity for traders to capitalize on corrective moves.
>>> My Trading Plan for the Week:
(1) SELL SCALP:
– ENTRY: around 115,000
– SL: 117,000
– TP1: 113,000
– TP2: 110,000
(2) BUY SETUP:
- ENTRY: 109,000 - 111,000
- SL: 107,000
- TP1: 117,500
- TP2: 122,000
- TP3: 128,000
This strategy is designed for short-term trades, taking advantage of volatility within the current range. For long-term investors, patience will be key—waiting for BTC to approach $110,000 or lower provides a strategic opportunity to restructure portfolios and scale into positions at more favorable prices.
👉 Conclusion: BITSTAMP:BTCUSD has broken out of its weekend consolidation and is now entering a fresh leg down. Short-term traders should look to sell corrective bounces, while long-term investors should focus on accumulation opportunities near $110,000 - a level that could serve as a “strategic entry” for the upcoming cycle.
WISH EVERYONE A NEW WEEK FULL OF ENERGY! ;)

Will US Gov Shutdown Continue to Support Bitcoin Prices?Fundamental approach:
- Bitcoin prices this week have been driven by renewed risk appetite and positive spot ETF inflows, with sentiment supported by the US government shutdown’s data blackout and expectations of further Fed easing as labor market signals soften. The institutional demand narrative strengthened as US spot ETFs returned to inflows, with assets under management remaining elevated, thereby bolstering dip-buying interest.
- Drivers included a modest uptick in the ISM manufacturing PMI, which is still in contraction, and ADP private payrolls showing job losses, reinforcing the view that looser policy could persist and liquidity conditions may remain supportive for the crypto beta. The shutdown has curtailed government data releases, prompting markets to rely on private indicators and amplifying sensitivity to risk sentiment and ETF flow headlines throughout the week.
- Bitcoin prices could sustain momentum if ETF inflows remain positive and macro uncertainty keeps rate-cut expectations intact, though volatility may rise with limited official data.
Technical approach:
- BTCUSD broke the triangle pattern and rose higher, positioning itself above both EMAs, indicating an upward momentum.
- If BTCUSD remains above 117000, the price may retest the previous swing high at around 123000.
- On the contrary, closing below 117,000 may prompt BTCUSD to retest the broken triangle pattern and the area between both EMAs.
Analysis by: Dat Tong, Senior Financial Markets Strategist at Exness

BTC consolidates after a significant price spikeBITSTAMP:BTCUSD price has had a slight correction after the previous increase.
Yesterday, the price broke the trendline and the EMA approached, creating a momentum accumulation zone before a strong break - as planned to buy.
Currently, BTC is correcting after the increase, just cutting down the EMA, showing that buying power is weakening, the short-term trend may turn down.
There is no clear signal to enter the order. Continue to observe the price reaction around the EMA and wait for a clear setup before taking action.
You can refer to my previous analysis here:
Please like and comment to support our traders. Your feedback motivates us to produce more analysis in the future 🙏✨

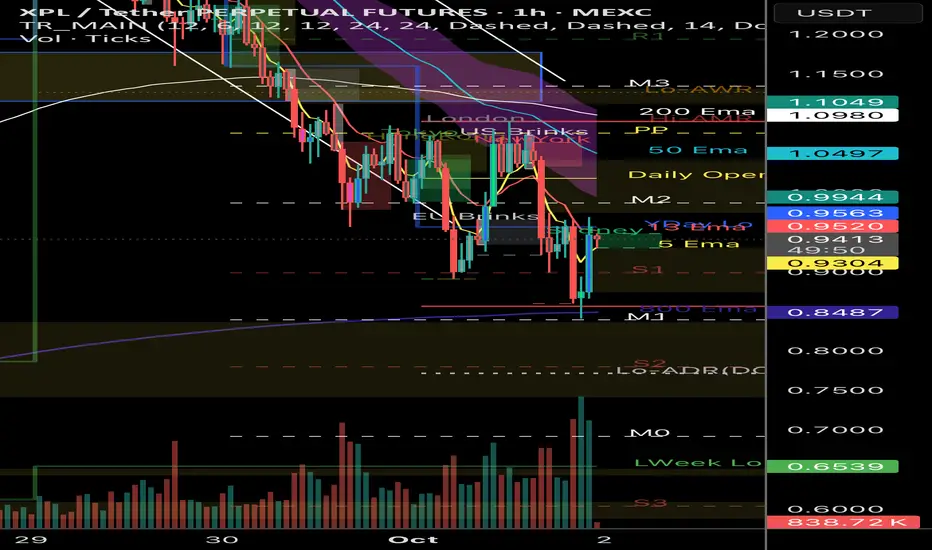
BOTTOM IS IN FOR $XPL PLASMA Nice retrace after initial rally, time for next leg up in the coming days/weeks
Loaded up around $0.96 average
BTC Game Plan – (LDMD Model)BTC Game Plan – (LDMD Model)
📊 Market Sentiment
FED has resumed its rate-cutting cycle, starting with a 0.25% cut in September, with two more expected. Institutional liquidity inflows have accelerated as the U.S. officially adopts crypto as part of its reserves. Despite elevated inflation, a weakening labor market is forcing the FED to ease, pushing more capital into risk-on assets.
📈 Technical Analysis
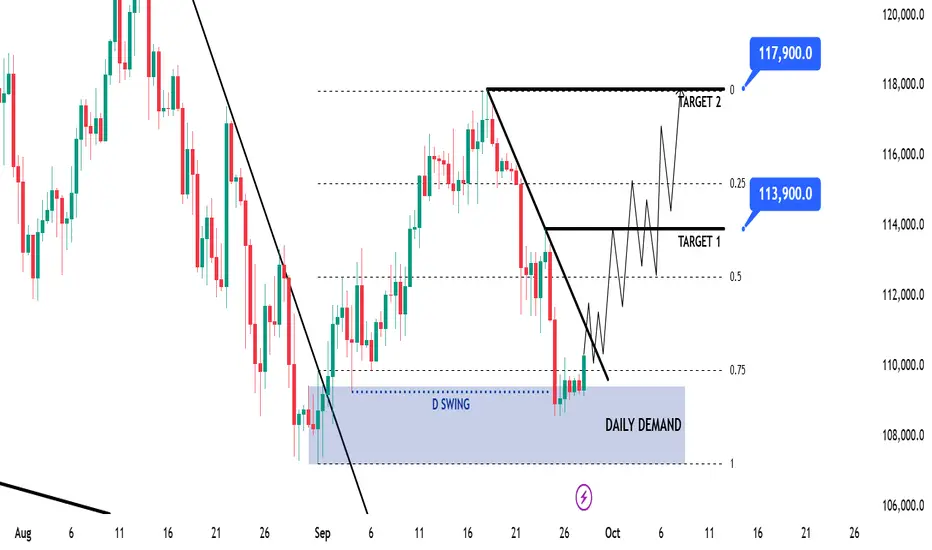
BTC is trending strongly bullish on the HTF, so long setups remain the priority. Recently, price broke the bearish trendline that had capped price action since August 13, signaling a shift in momentum. That breakout created a Daily Demand zone, which was tapped once before price moved higher — confirming liquidity inside the zone.
Currently, BTC ran the daily swing low (the first tap of that demand), revisited the Daily Demand, and repriced into the 0.75 Fibonacci max discount level. This strong confluence suggests accumulation and potential continuation higher.
📘 Model to be used – LDMD (Liquidity Run inside Daily Demand w/ Max Discount Zone)
In this model, I start by confirming the HTF trend to set directional bias. Then, I identify key Demand/Supply zones that carry significant liquidity. A sweep of HTF swing lows adds confluence by trapping liquidity. Finally, I align this with the 0.75 max discount retracement zone for a high-probability entry point.
📌 Game Plan
1-Wait for a daily close above the bearish trendline.
2-Enter long on confirmation.
🎯 Setup Trigger
Daily close above the bearish trendline.
📋 Trade Management
Stoploss: 108,500$
Targets:
TP1: 113,900$
TP2: 117,900$
After TP1, move SL to breakeven to secure profits.
💬 Like, follow, and comment if this breakdown supports your trading! More setups and insights coming soon — stay connected!
⚠️ Disclaimer: This content is for informational and educational purposes only and does not constitute financial, investment, or trading advice. Always DYOR before making any financial decisions.
Why Solana Could Surpass $300 in 2025–2026Hey guys, today I want to share my full view on Solana (SOL) .
For a long time, my main focus as an investor and trader was always on Bitcoin and Ethereum. But in the last 12 months, I started massively investing into Solana. The reason is simple: the ecosystem is not only recovering from its darkest days but is now proving real resilience, adoption, and growth.
When FTX collapsed in November 2022, Solana took one of the hardest hits. FTX and Alameda were among the biggest backers of the Solana ecosystem. When they went bankrupt, SOL crashed under $12 and many people stopped believing in its future. The market saw Solana as “FTX’s chain.” But fast forward to today, and we are witnessing a complete turnaround. Users are coming back, new protocols are being launched, and on-chain activity is stronger than ever.
In our crypto prop trading company , we’re building new infrastructure for our traders, and after careful research, we chose Solana as the best chain for implementation . Its speed, scalability, and near-zero fees make it the most practical blockchain to build on. And it’s not just us — many other companies and institutions are starting to integrate with Solana, which will bring even more growth in the months ahead.
⚠️ Quick disclaimer: This is not financial advice — only my humble opinion based on research, analysis, and experience.
Solana Price Action & Key Events (2022–2025)
To understand Solana’s current position, let’s look back at its journey over the last few years:
Bridge Breach (Feb 2022): The Wormhole bridge hack stole ~$325M, hurting trust in Solana DeFi.
DeFi Winter (May 2022): The Terra UST/LUNA collapse triggered a full liquidity crisis across all DeFi. Solana’s TVL drained fast.
FTX Implosion (Nov 2022): The turning point. FTX and Alameda went bankrupt, SOL crashed under $12, and the bear market bottom was defined.
Meme Season (Early 2024): Retail users came back with BONK and other meme coins. Solana’s speed and low fees made it the perfect hub for speculation.
WIF Mania (Spring 2024): Dogwifhat (WIF) went viral, volumes on Solana even surpassed Ethereum at times.
Pump.fun Frenzy (Apr 2024): Millions of tokens launched through Pump.fun, onboarding hundreds of thousands of wallets and driving record on-chain activity.
Full Recovery (2025): After two years of stagnation, SOL broke above $200 again, fully recovering to pre-FTX levels and proving that it can thrive as a community-driven, retail-driven chain.
Solana On-Chain TVL (Total Value Locked)
TVL (Total Value Locked) shows how much capital is locked in DeFi protocols on Solana — lending, staking, DEXes, and yield farming.
2021–2022: First boom, TVL surged past $10B.
2022–2023: Collapse after Terra and FTX, TVL fell close to zero.
2024–2025: Strong recovery — TVL passed $9–10B again, showing users are back and Solana DeFi is alive.
Why this matters: TVL growth proves Solana is not only about meme coins. Capital and liquidity are returning, and users are once again trusting the chain with real money.
Solana DEX Volume & Pump.fun Impact
In just one day, DEXs on Solana processed $10.3B in trading volume.
Pump.fun alone made up ~80% of that ($7.93B).
Pump.fun is unique because it allowed anyone to instantly create and trade tokens, onboarding massive numbers of new users. At its peak, Pump.fun had over 400,000 weekly active addresses , and even today it still makes up around 10% of all Solana DEX activity .
This shows two things:
Solana is the clear leader in retail-driven trading.
The ecosystem still needs broader use cases to sustain growth once meme speculation slows.
Futures Open Interest – Market Confidence
Open interest (OI) in Solana futures collapsed after FTX, but in 2024–2025 it came roaring back, growing alongside SOL’s price.
Positive: Rising OI shows traders trust Solana again, and rallies are backed by real activity.
Risk: Very high OI means higher liquidation risk. If markets turn, leveraged positions could cause sharp corrections.
Pump.fun Traders Data – Not Everyone Wins
According to Dune Analytics, 99.6% of Pump.fun traders never made more than $10K in realized profits . Only a small fraction hit big wins, while most made little or lost money.
This highlights the gambling-style nature of meme trading: it drives huge network activity but is not sustainable long-term. For Solana, the key is converting this short-term hype into long-term adoption.
Why Solana Could Rise in Late 2025–2026
Looking forward, here are the main reasons I believe Solana has strong upside potential:
1. Tokenization Boom
By 2033, $20T in assets could be tokenized.
Solana has the scalability, low fees, and adoption needed to be the leading infrastructure.
2. On-Chain Usage
Solana already surpasses Ethereum in active addresses and transactions (100M monthly users, 3.5B monthly txs).
More usage → more fees → higher staking yield → stronger SOL demand.
3. Institutional Adoption
Major players like BlackRock, Franklin Templeton, Visa, and PayPal are already launching tokenized products or stablecoin integrations on Solana.
4. Ecosystem Growth
Solana dominates in trading, token creation (60% of new tokens), and new sectors like AI agents.
From Pump.fun (retail) to xStocks and OnRe.finance (institutional), Solana is proving versatile.
5. Technology Roadmap
With Firedancer and other upgrades, Solana is moving toward 100k–1M TPS capacity, making it “internet-scale finance.”
6. Investment Case
SOL is scarce (~750M fixed supply), yield-bearing (7–13% staking), and directly tied to network growth.
Analysts project potential 4x–30x appreciation (short-term ~$900, medium ~$2,000, long-term ~$6,000).
Outlook – Target $300+
If 2022–2023 was about survival, and 2024–2025 was about recovery, then 2026 could be Solana’s breakout moment as the backbone of digital finance.
With on-chain activity at record highs, institutional adoption growing, and scalability improvements rolling out, a move above $300 in late 2025 or 2026 is not only possible but realistic.


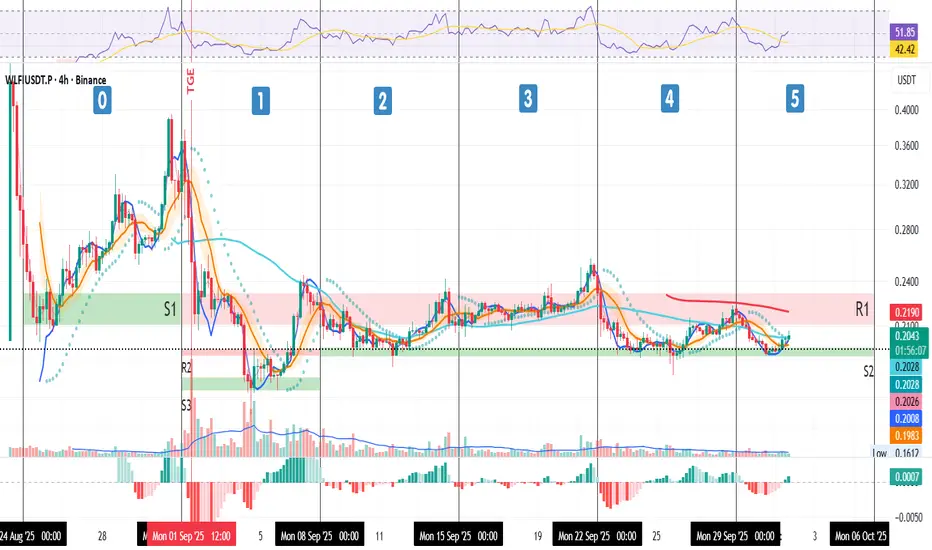
Week 5 / Oct 1 – WLFI 4H Update
Price action is holding support.
After bouncing off S2 as support, price is now pushing toward R1, where the 200MA sits, already proven resistance once.
Currently trading above the 50MA, SMA (pink), BB center, and MLR. PSAR looks ready to flip bullish. MACD has already crossed up, while RSI is above its MA and pressing into mid-range.
Momentum is cautious but tilting upward, shy signs of strength are building.
⚠️ Risk Management:
If price closes under S2, I’ll start scaling out to protect capital and avoid liquidation.
Always take profits and manage risk.
Interaction is welcome.
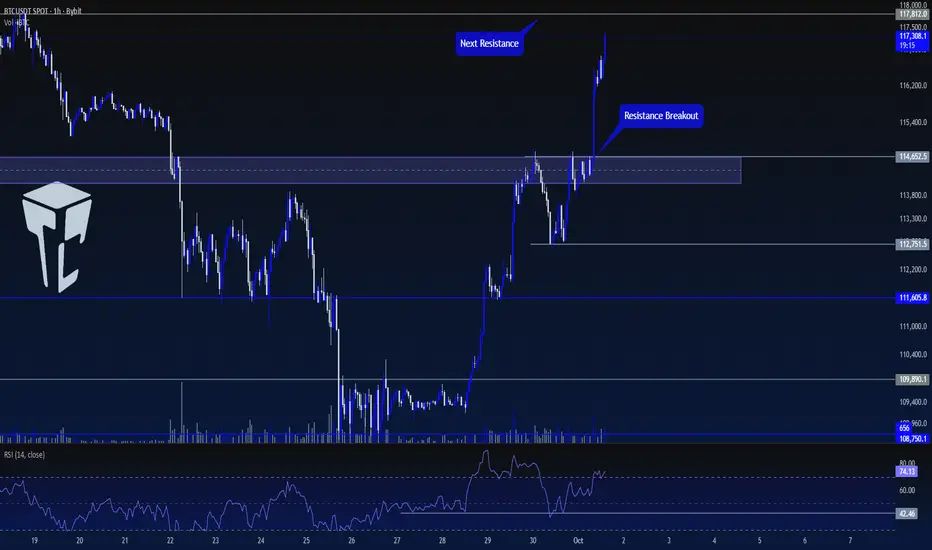
TradeCityPro | Bitcoin Daily Analysis #185👋 Welcome to TradeCity Pro!
Let’s move on to the Bitcoin analysis. Bitcoin’s bullish trend is still continuing, and today during the London session it made another upward move. Let’s review today’s triggers together.
⏳ 1-Hour Timeframe
Yesterday, after the correction, Bitcoin formed a bottom at 112751 and with the RSI being supported at 42.46, the upward move started.
🔔 The trigger we had yesterday for opening a position was the breakout of the resistance zone, with the exact trigger forming at 114652. After the breakout, the price started its second upward wave.
💥 The RSI oscillator has also entered the Overbuy zone, and the market momentum is fully bullish. The next resistance we have is at 117812.
💫 If the price reaches 117812 and the RSI exits the Overbuy zone, we can take profit on the position.
✅ For a new position, no fresh trigger can be given right now because the price is moving sharply upward, and opening any new position here would be considered risky with a high chance of hitting stop-loss.
📊 The area I expect the price to react to is 117812, but I will wait for the price to first build a structure before opening a position.
❌ Disclaimer ❌
Trading futures is highly risky and dangerous. If you're not an expert, these triggers may not be suitable for you. You should first learn risk and capital management. You can also use the educational content from this channel.
Finally, these triggers reflect my personal opinions on price action, and the market may move completely against this analysis. So, do your own research before opening any position.
BTC/USDT ; Is the shedding over?Hello friends
Due to the price correction we had, the price has bounced back into a good support area where there were many buy orders and has reacted well.
Now it remains to be seen whether it will succeed in defeating the trading pain or not.
If buyers continue to support the price, it could break the range and move towards the specified targets.
*Trade safely with us*

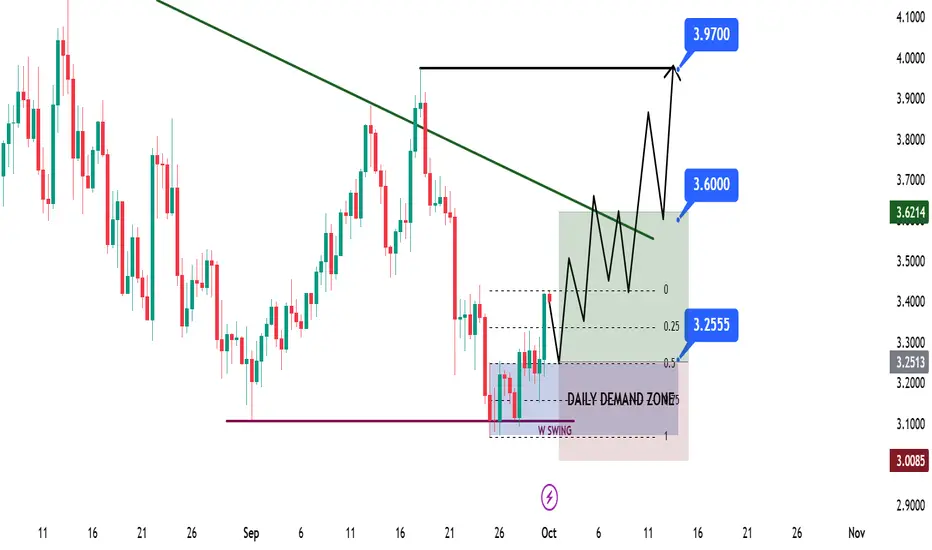
SUI Swing Long Opportunity - HDDZ Model SUI Swing Long Opportunity – HTF Demand w/ Discount Zone (HDDZ Model)
📊 Market Sentiment
FED has resumed its rate-cutting cycle, starting with a 0.25% cut in September, with two more expected. Institutional liquidity inflows have accelerated as the U.S. officially adopts crypto as part of its reserves. Despite elevated inflation, a weakening labor market is forcing the FED to ease, pushing more capital into risk-on assets.
📈 Technical Analysis
SUI is bullish on HTF, so only long setups are considered. Price recently swept the weekly swing liquidity and closed above, then broke market structure on LTF — confirming bullishness and creating a valid Daily Demand zone. Price has already tested this zone once and found rejection, validating its significance.
Currently, price is rejecting from the bearish LTF trendline above, which remains a key resistance. A retest of the confluence at 3.25$ (Daily Demand + Discount Zone) offers a strong setup for continuation higher.
📘 Model to be used – HDDZ (HTF Demand w/ Discount Zone)
In this model, I first confirm HTF bias. Then, I look for creation of HTF Demand zones. Finally, I use Fibonacci retracement to locate the discount zone. When both the demand zone and discount zone align, it creates a strong confluence for trade entries.
📌 Game Plan
1-Wait for price to revisit 3.25$ confluence zone.
2-Carry trade toward bearish LTF trendline, securing profits early if price rejects.
🎯 Setup Trigger
Entry confirmation once price hits 3.25$.
📋 Trade Management
Stoploss: 2.97$
Targets:
TP1: 3.61$
TP2: 3.97$
After TP1, move SL to breakeven to secure the position.
💬 Like, follow, and comment if this breakdown supports your trading! More setups and insights coming soon — stay connected!
⚠️ Disclaimer: This content is for informational and educational purposes only and does not constitute financial, investment, or trading advice. Always DYOR before making any financial decisions.
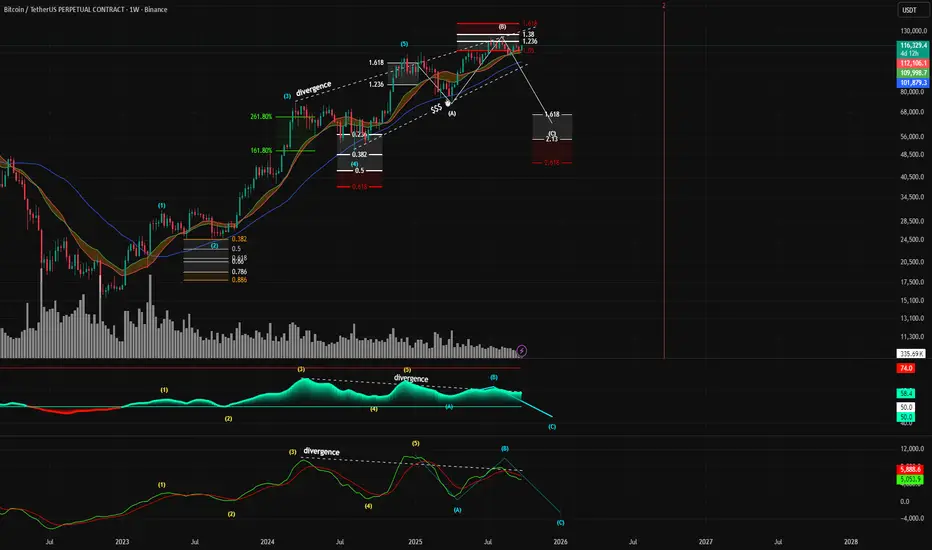
Expanding Flat Elliot wave countBitcoin may be approaching a significant macro top, with multiple technical indicators aligning to signal a potential reversal and a subsequent major corrective wave.
Key Projections:
Potential Top Formation: The current price action is forming what appears to be the peak of a corrective Wave (B), with a potential top range between $109,000 and $150,000.
Projected Corrective Target: Following the completion of Wave (B), a significant downward move, labeled as Wave (C), is anticipated. This corrective wave targets the $45,000 - $67,000 price zone.
Timeline: The entire corrective structure, from the formation of the top to the potential bottom of Wave (C), is projected to unfold by approximately September 2026.
Elliott Wave Structure: The primary thesis is based on an Elliott Wave count. The chart indicates the completion of a five-wave impulse cycle, and the market is now in a larger A-B-C corrective pattern. The current price is likely forming the peak of the B-wave.
Fibonacci Confluence: There is a strong confluence of Fibonacci extension levels at the potential top. The peak of the current Wave (B) is precisely testing the 1.618 Fibonacci extension level, a critical ratio often associated with the termination of corrective waves.
Significant Bearish Divergence (Crucial Point): This is one of the most compelling signals on the chart.While the price is making higher highs (from the peak of wave (5) to the peak of wave (B)).Both the RSI and the MACD indicators are showing lower highs. This is a classic, multi-indicator bearish divergence on a high timeframe (weekly), indicating that the upward momentum is weakening significantly and a trend reversal is becoming more likely.
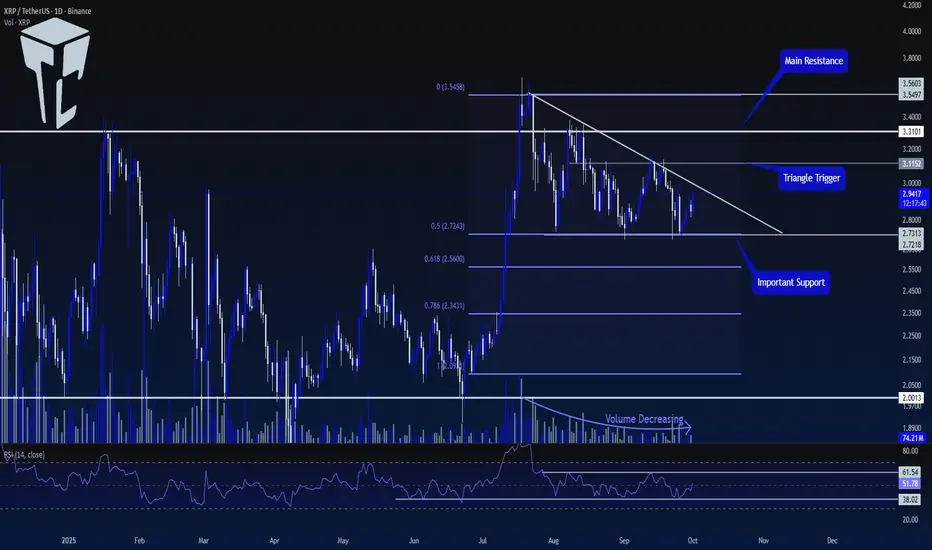
TradeCity Pro | XRP: Key Support and Resistance Zones Testing👋 Welcome to TradeCity Pro!
In this analysis, I will review the XRP coin. One of the oldest crypto projects, XRP aims to align crypto transactions with the SWIFT system. The coin has a market cap of $173 billion and is ranked 4th on CoinMarketCap.
📅 Daily Timeframe
After getting support at the 2.0013 level, XRP made a bullish move up to the 3.5603 resistance. Now, it has formed a descending triangle, and the volume has been decreasing as the price moves down.
⚡️ Currently, a crucial support zone has formed at 2.7218, which overlaps with the 0.5 Fibonacci level, forming a PRZ for us.
🧩 A descending trendline has also been created, and the price has touched it several times, making lower highs.
📊 To confirm the next bullish move for this coin, the first confirmation we need is the breakout of the trendline. The trendline breakout trigger is at 3.1152.
✨ Once this level is broken, we can open a long position. This trigger is the first long position trigger and is considered risky since we haven't yet received the main confirmation for a bullish trend.
🔍 The main trigger for the start of a new bullish trend is the breakout of the 3.3101 level. Breaking this level could start a new upward move for XRP.
💥 A very important confirmation for both long and short positions on the RSI is the breakout of the range between 38.02 and 61.54.
🎲 As long as the RSI remains between these two levels, the probability of hitting stop losses is high. Therefore, for a long position, we can wait for the 61.54 level on the RSI to be broken.
🔽 For a short position, the 38.02 level on the RSI is a good momentum trigger. We can also use the 2.7218 level as a trigger, but keep in mind that the main market momentum is bullish, so this short trigger is considered risky.
📝 Final Thoughts
Stay calm, trade wisely, and let's capture the market's best opportunities!
This analysis reflects our opinions and is not financial advice.
Share your thoughts in the comments, and don’t forget to share this analysis with your friends! ❤️
This month Will Define This Entire Crypto Cycle🎯 October Just Started — And It Might Define This Entire Crypto Cycle 📈
Happy October, everyone — a month with a powerful pattern.
If history repeats, this could be a defining moment:
2017 saw a 5x BTC rally in 60 days,
2021 delivered a 2.5x in just 45 days.
Now it’s 2025 , and we’re watching the charts line up once again. 🔁
We’ve been long Bitcoin since two days ago, right off the support at the bottom of the channel — a level we’ve tracked since March 14, 2023 .
That same chart gave us:
42K (hit summer 2023)
46K (initial rejection, later support)
And now, we’re targeting 127,370 → 138K–140K as part of the final macro wave. 🚀
Ethereum is showing strength too. From a solid buy zone near 4,000 , I still believe the next key levels are 6,443 and 10,364 .
Altcoins? Let’s talk dominance:
Bitcoin Dominance is still high (~58%) but could drop toward 56.91 — giving room for alts to breathe.
Ethereum Dominance remains in a clear descending channel, with a clean target of 18.29% dominance.
📊 We’ve revisited Ethereum vs. BTC charts, and I remain long ETH here with a 0.06 BTC target.
Other setups:
Solana support at 204.81 , targets 240 and 276 .
XRP ? I remain cautious — still preferring ETH over XRP based on recent cycles.
Total Market Cap still shows bullish structure, aiming for 4.8T and later 6.5T .
We’ve seen the October pattern repeat across cycles. While the exact altcoin winners change (XLM & XRP in 2017, ETH in 2021), the macro truth remains:
Bitcoin tends to lead — and October tends to explode.🔥
Thought of the Day 💡
“Cycles evolve, but the rhythm remains. Each October is a chance — not a promise. But charts give us a map, and right now, the map points up.”
Disclaimer
I share market views for educational and entertainment purposes only. This is not financial advice. I am not a licensed advisor. Trade at your own risk and always manage your capital responsibly.
One Love,
The FXPROFESSOR 💙
ps. it's a video..watch it and let me know your thoughts
