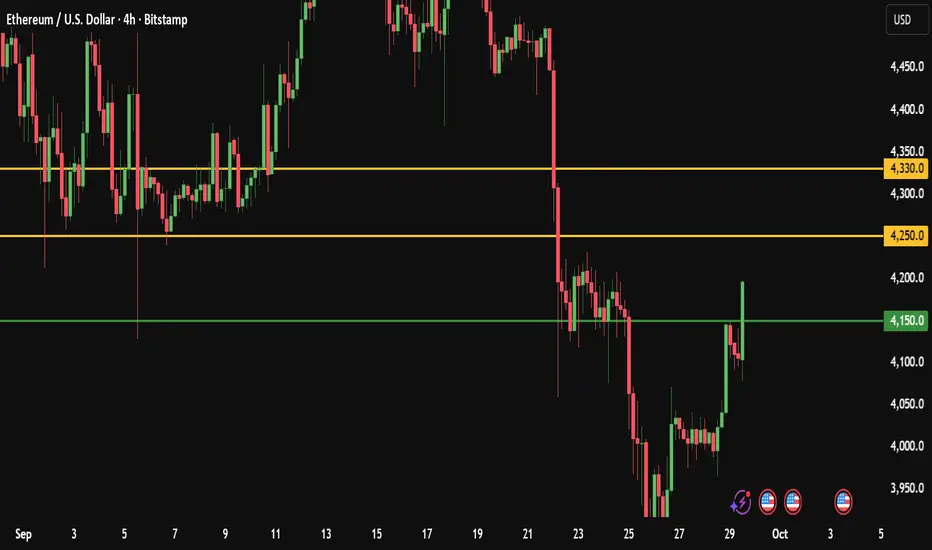
Ethereum Daily Technical Signal: Buy and Target 4330Ethereum Daily Technical Analysis
Ethereum is currently showing signs of strength as it tests the key resistance level around 4150.
A confirmed 4H candle breakout above this zone could trigger fresh bullish momentum, opening the door for higher targets in the short term.
My Personal Long Setup
If the price breaks and closes a 4H candle above 4150, I will enter a long position.
🎯 Target 1: 4250
🎯 Target 2: 4330
❌ Stop-loss: 4040
👍 Don’t forget to boost this trading idea if you found it helpful,
and follow me for more daily crypto insights and trade setups.
⚠️ Please note:
This is not financial advice – I’m only sharing my personal trades.
Always do your own research before taking action.
Best of luck 🌹
Cryptomarket
Cryptocurrency : The New Normal & The World of Leverage Trading.📌 Cryptocurrency: The New Normal & The World of Leverage Trading ⚔️ ( A Sweet Killer! )
🌍 Why Are Traders Shifting to Crypto? COINBASE:BTCUSD BITSTAMP:ETHUSD COINBASE:SOLUSD
✔️ Lower capital required compared to stocks
✔️ Fewer gaps (24/7 market = no overnight gap-up/down shockers)
✔️ High leverage opportunities (control bigger trades with smaller margin)
✔️ Global accessibility (Binance, Bybit, OKX, CoinDCX, Mudrex etc.)
📊 Types of Trading in Crypto
💠 **Spot Trading** → In India, 30% tax on capital gains ( check according to your country ).
💠 **Options & Futures** → Taxed as *Business Income* ( like F&O in stocks ). No flat % rule.
⚡ What is Leverage?
👉 Leverage means using *small capital* to control a *large trade size* , because the exchange lends you money.
Think of it like **margin trading** in stocks — but much more aggressive.
🔹 Example 1 : Normal Trade style ( No Leverage )
suppose you have 💰 Capital = $10,000
Bought BTC at Price = $10,000,000
* You can buy 0.001 BTC ( 10000 ➗ 10,000,000 ).
* If BTC rises 10% → Profit = $1,000 (+10%)
* If BTC falls 10% → Loss = $1,000 (-10%)
👉 Risk & reward move in proportion to your capital.
🔹 Example 2 : Leverage Trade style ( 10x Leverage )
suppose you have 💰 Capital = $10,000
opted Leverage = 10x
New Trade Size ( margin ) = $1,00,000 ( you can now utilize this margin amount for trading )
* You can buy 0.01 BTC ( 10000 ➗ 10,000,000 ).
* If BTC rises 10% → Profit = $10,000 (+100% return)
* If BTC falls 10% → Loss = FULL $10,000 ( Liquidation 🚨 )
👉 A 10% move = your account will be blown.
🔹 Example 3:
suppose you have 💰 Capital = $10,000
opted Leverage = 50x (Extreme ⚠️)
New Trade Size ( margin ) = $5,00,000 ( you can now utilize this margin amount for trading )
* You can buy 0.05 BTC ( 50000 ➗ 10,000,000 ).
* If BTC rises just 2% → Profit = $10,000 (+100% return)
* If BTC falls just 2% → FULL $10,000 loss ( Liquidation 🚨 )
* If BTC rises just 10% → Profit = $50,000 (+500% return)
* If BTC falls just 10% → FULL $10,000 loss ( Liquidation 🚨 )
👉 Tiny moves in high volatile asset class = jackpot or wipeout/blown.
⚔️ Key Takeaways :
1️⃣ Leverage multiplies profits 💸 but also multiplies losses too💀 ( a sweet killer! )
2️⃣ Crypto is *highly volatile* (10–20% daily moves are common) → High leverage is extremely risky, if not managed well.
3️⃣ Beginners should **never use more than 2x–3x leverage**
👉 In simple words: **Leverage is a double-edged sword ⚔️**
Used wisely → You’re a king 👑
Used recklessly → You’re broke 🥀
---
🚘 Liquidation Explained ( ex: Car Analogy )
Imagine you pay $10,000 ( as a security ) to rent a car worth $1,00,000. (That’s 10x leverage).
* The car is in your hands, but $90,000 still belongs to the owner of car (exchange).
* If the damage goes beyond your $10,000 margin → the owner takes back the car immediately.
👉 That’s liquidation: when your loss = your margin.
🔹 Case 1: Normal Trade style ( No Leverage )
Margin = $10,000 → Buy BTC.
If BTC drops 10% → Loss = $1,000.
You still have $9,000 left.
✅ No liquidation. Just a normal loss.
🔹 Case 2: 10x Leverage Trade style
Margin = $10,000
New Trade Size ( margin ) = $1,00,000
* BTC rises 10% → Profit = $10,000 (+100%)
* BTC falls 10% → Margin wiped = Liquidation 🚨
🔹 Case 3: 20x Leverage Trade style
Margin = $10,000
New Trade Size = $2,00,000 ( margin )
* BTC rises 5% → Profit = $10,000 (+100% return)
* BTC falls 5% → Margin wiped = Liquidation 🚨
👉 Just 5% against you = Account gone.
🔹 Case 4: 50x Leverage Trade style (High-Risk Zone ⚠️)
Margin = $10,000
New Trade Size = $5,00,000 ( margin )
* BTC rises 2% → Profit = $10,000 (+100% return)
* BTC falls 2% → FULL $10,000 loss = Liquidation 🚨
👉 Just 2% against you = Blown account = Game over.
🎯 Final Word
Leverage = Power ⚡
But in crypto’s volatile world, it’s also a **trap for the impatient**.
* Liquidation is directly proportionate to Leverage.
* Smart traders use small leverage.
* Impulsive traders burn out with high leverage.
💬 Question for you: What’s the **highest leverage** you’ve ever used in a trade? Drop it below 👇 (Be honest—we’ve all been tempted!)
If this Idea gave you a value information then please, Boost it, share your thoughts in comments, and follow for more practical trading!
Happy Trading & Investing!
@TradeWithKeshhav and team

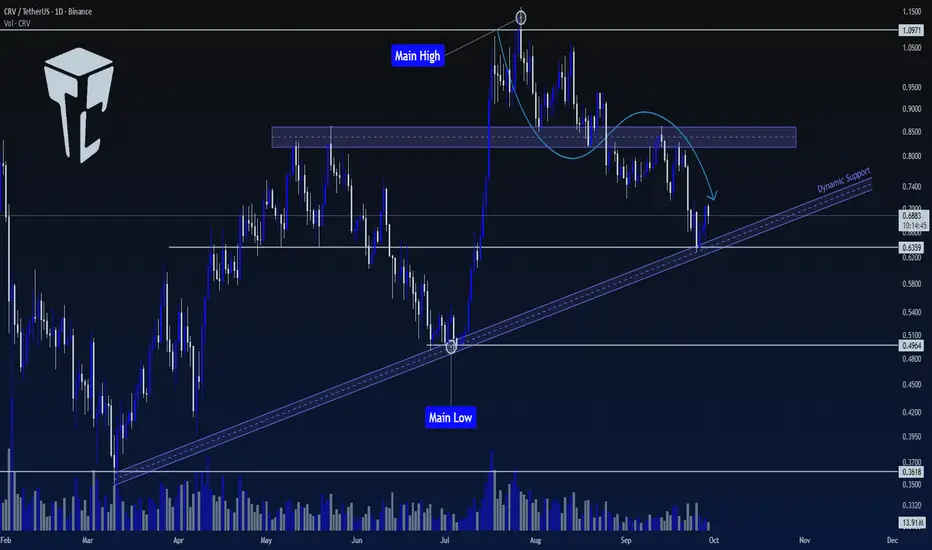
TradeCity Pro | CRV Testing Key Support Zone for Trend Reversal👋 Welcome to TradeCity Pro!
In this analysis, I will be reviewing the CRV coin, one of the popular DEXs, with a market cap of $954 million, currently ranked 81 on CoinMarketCap.
📅 Daily Timeframe
In the daily timeframe, this coin is in an uptrend with a trendline, and the price has currently reached it.
🔍 In higher cycles, the trend of this coin is bullish. However, in lower cycles, after being rejected from 1.0971, a downward movement has started, and it has corrected to the 0.6359 level.
✔️ This level is currently overlapping with the trendline and forms an important support zone.
✨ If this PRZ zone breaks, we can confirm the bearish reversal for CRV, and a short position can be opened. This trigger is one of the first signals for a trend change, and the main trend change will be confirmed after breaking 0.4964.
📈 For a long position, we will have to wait until a proper bullish structure is formed. If the price moves sharply, we will confirm the bullish trend after stabilization above the zone.
❌ Disclaimer ❌
Trading futures is highly risky and dangerous. If you're not an expert, these triggers may not be suitable for you. You should first learn risk and capital management. You can also use the educational content from this channel.
Finally, these triggers reflect my personal opinions on price action, and the market may move completely against this analysis. So, do your own research before opening any position.
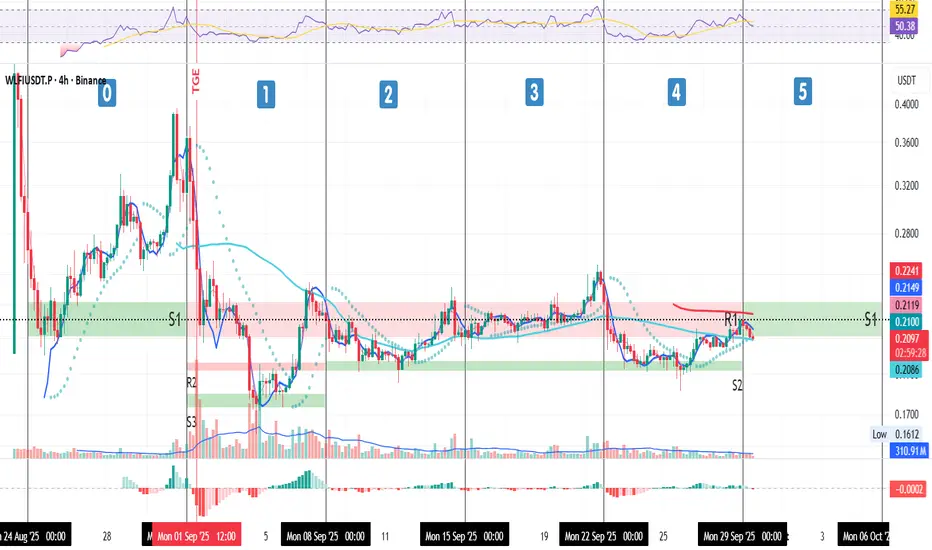
Week 5 Update – WLFI (4H)
Week 5 Update – WLFI (4H)
After holding S2 last week, price pushed higher into the red resistance zone, broke above the 50MA, and stopped right at the newly-formed 200MA, sitting perfectly in the middle of that red zone.
Today (Monday), price is testing the bottom of the S1 zone as support, which is now aligned with the 50MA, an important confluence level.
📈 Position:
I’m still long and plan to hold for a longer period, as long as the structure stays intact.
⚠️ Risk Management:
If price closes under S2, I’ll start scaling out to protect capital and avoid liquidation.
Always take profits and manage risk.
Interaction is welcome.
BCH 4H Trade IdeaMarket is doing recovery and I have find opportunity on BCH. Entry & Exit point are given. NFA. DYOR.

Bitcoin DROP & RISEThere is a possibility Bitcoin drop to daily 200MA at $104,700 and go up from that area to $138k

Don’t Blink! BTC Signal Turns Bearish# BTC Quant Signals Stock 1M Prediction — 2025-09-28
CRYPTOCAP:BTC Quant Signals Kline Signal
📊 **CURRENT MARKET STATUS**
* Current Price: **$48.71**
* Data Quality: **Good**
* Timeframe: **1-Minute Bars (Scalping)**
---
🎯 **SCALPING PRICE PREDICTIONS**
* 30-Minute Target: **$48.32 (-0.81%)**
* 2-Hour Target: **$48.39 (-0.66%)**
* End-of-Day Target: **$48.49 (-0.45%)**
📌 Extended Outlook
* Final Target: **$48.39 (-0.66%)**
* Predicted Volatility: **21.8%**
* Expected Range: **$48.30 – $48.83**
---
📈 **SCALPING TREND ANALYSIS**
* Direction: **BEARISH**
* Confidence: **64%**
* Support: **$48.30**
* Resistance: **$48.83**
* Range Size: **1.1% of current price**
---
💰 **INTRADAY TRADE RECOMMENDATION**
* Direction: **SHORT**
* Entry Price: **$48.71**
* Target: **$48.45**
* Stop Loss: **$49.44**
* Confidence: **64%**
* Risk/Reward: **0.35 : 1**
* Session: **Intraday (1m bars)**
* Trend: **BEARISH**
#BTC #Crypto #Scalping #QuantSignals #TradingView

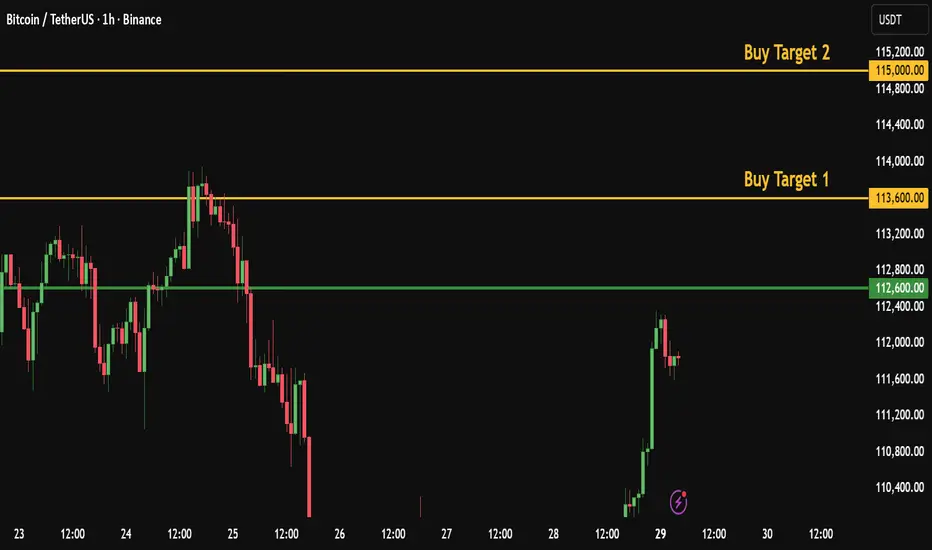
Daily Bitcoin Signal: Watching the 112,600 Breakout, target 115K
Bitcoin Daily Numeric Analysis
Bitcoin is currently showing signs of strength as it tests the key resistance level around 112,600. A confirmed breakout above this zone could trigger fresh bullish momentum, opening the door for higher targets in the short term.
My Personal Long Setup
If price breaks and closes a 1H candle below 109,150, I will enter a short trade.
🎯 Target 1: 108,250
🎯 Target 2: 107,500
❌ Stop-loss: 110,600
👍 Don’t forget to boost this trading idea if you found it helpful,
and follow me for more daily crypto insights and trade setups.
Please note:
This is not financial advice – I’m only sharing my personal trades.
Always do your own research before taking action.
Best of luck 🌹
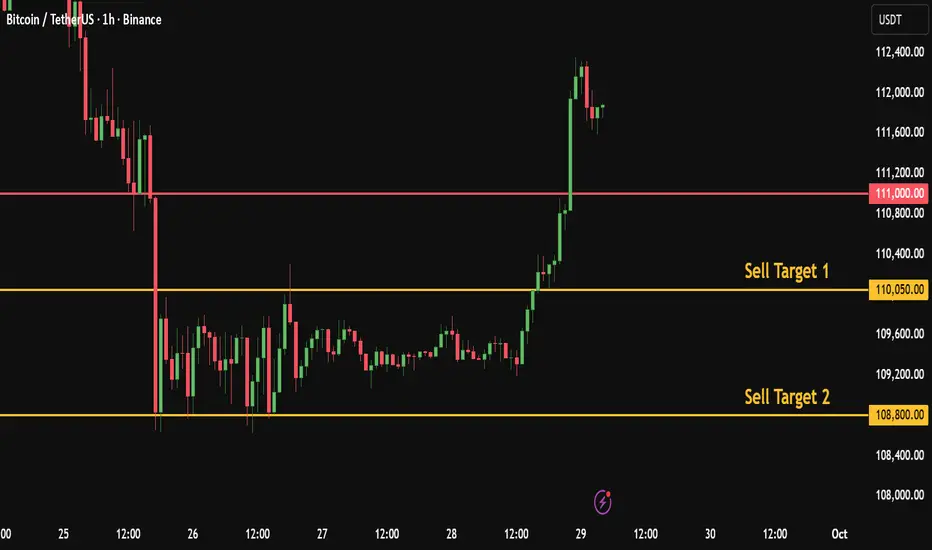
Daily Bitcoin Signal: Watching the 111K Breakout, target 108KBitcoin Daily Numeric Analysis
Based on my numeric analysis, Bitcoin is showing potential weakness near key support.
My Personal Short Setup
If price breaks and closes a 1H candle below 111K, I will enter a short trade.
🎯 Target 1: 110,050
🎯 Target 2: 108,800
❌ Stop-loss: 112,700
👍 Don’t forget to boost this trading idea if you found it helpful,
and follow me for more daily crypto insights and trade setups.
Please note:
This is not financial advice – I’m only sharing my personal trades.
Always do your own research before taking action.
Best of luck 🌹
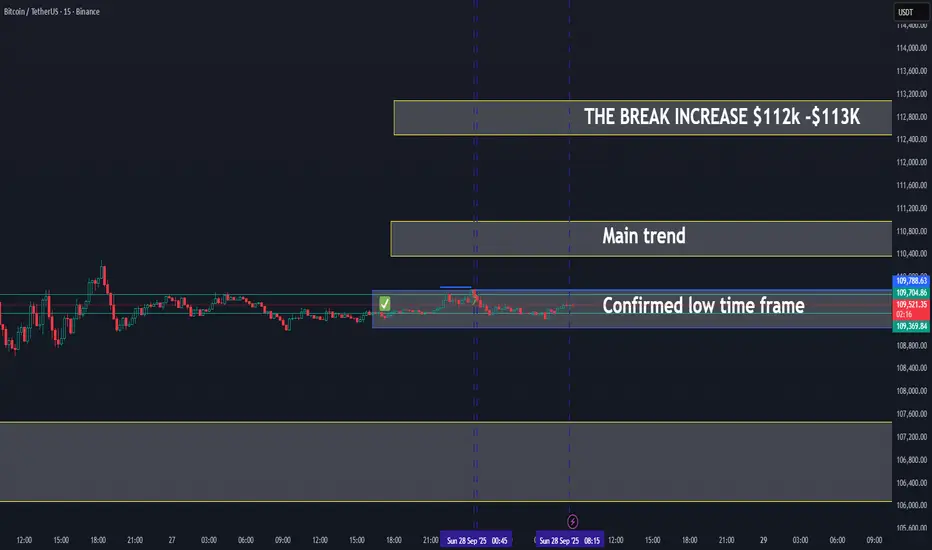
BITCOIN ON WAY TO MAINTREND - UPDATE 28-09-2025📊BTC/USDT Trading Update
✅ Low time frame confirmed: Bitcoin has established support in the $109.3K – $109.7K zone, which now acts as a strong base.
📈 Price is moving toward the main trend zone ($110.8K – $111.5K). This will be the key resistance area to watch.
🔑 Breakout potential:
If BTC clears the main trend zone, momentum could accelerate with the next target around $112K – $113K.
This would confirm a stronger continuation of the short-term uptrend.
Scenarios:
Bullish case: Hold above $109.3K and break $111.5K → expansion toward $112K – $113K.
Bearish case: Failure to break the main trend could lead to sideways action or retest of $109K support.
📌 Summary:
BTC has confirmed its low time frame breakout and is now targeting the main trend zone. A break above this range will likely fuel a push toward $112K – $113K.
But Ser, Wen Moon? Wen Alt Season?But Ser, Wen Moon? Wen Alt Season?
Why 2024 Was Your Alt Season (And Why the Next One Is Years Away)
The Uncomfortable Truth: Alt Season Already Happened
Everyone’s still asking “wen alt season?” The painful reality: it already came and went in 2024.
The Altcoin Season Index hit 88 in Dec 2024 - its highest since 2021 - before collapsing to 12 by April 2025 - that was your alt season. The memecoin mania, the AI‑narrative pumps, the handful of legitimate winners like CRYPTOCAP:HBAR , CRYPTOCAP:SOL (at the time of writing still up 10x from 2023 lows), CRYPTOCAP:SUI , COINBASE:SEIUSD , CRYPTO:INJUSD , CRYPTO:RENDERUSD and a few others - that was it.
CRYPTOCAP:TOTAL3ES It peaked symbolically when the President of the United States launched his own memecoin $BINANCE:TRUMPUSDT.
Pause and think about that for a minute: when the most powerful person on earth is shilling crypto memes, you’re not early anymore - you’re late.
Most people missed it because they were waiting for a 2017‑style blow‑off where everything pumped indiscriminately. Instead, 2024 was surgical: only the strongest assets with real utility or meme community power survived. The rest 95-99% of the market - stayed the same laughable junk it’s always been. This wasn’t broad‑based euphoria; it was natural selection.
Why Traditional Finance Beat Crypto This Cycle
Here’s the overlooked truth: the AI rally happened at the same time as Bitcoin’s halving rally.
Faced with a choice between dead altcoins hoping for a 2021 revival or BIVA:NVDA and BMV:MSFT printing real revenue, smart money chose AI and equities over dead altcoins. Retail followed. The AI trade sucked the oxygen out of crypto, leaving most alts gasping for liquidity.
NASDAQ:NVDA added $2.2 trillion in market cap in 2024.
NASDAQ:APP surged +758%.
NASDAQ:PLTR and NASDAQ:MSFT rode AI adoption to record highs.
INDEX:ETHUSD path tells the story: it clawed back to its 2021 highs - just enough for whales to exit three years of underwater bags. Mission accomplished. Retail still waiting for $10K ETH? Game over.
In September alone, COINBASE:ETHUSD saw it largest ETF NASDAQ:ETHA outflow and this money didn't go to alts it was out of the market - Institutions don’t rotate into alts - they rotate out of crypto entirely...
The Institutional Playbook vs. Retail Delusion
The 2024–25 rally was institutional, not retail.
BlackRock’s iShares Bitcoin Trust NASDAQ:IBIT has seen $60B+ inflows since Jan 2024, holding ~756,000 BTC.
Fidelity’s CBOE:FBTC holds ~$22B.
Together, they dominate >70% of U.S. ETF flows.
When Blackrock NYSE:BLK and Fidelity CFI:FBTC buy billions in Bitcoin ETFs, they’re not chasing 100x moonshots. They’re happy with 2–3x on massive positions. In institutional terms, a 5x is a career‑making home run.
This isn’t 2017 or 2013 anymore. Crypto is a multi‑trillion dollar ecosystem where retail’s few thousand dollars are statistical noise. The old playbook - “Bitcoin pumps, then alts follow” - is dead - it assumed retail drove the cycle. Today, institutions hold the keys, and like i said they don’t rotate into your favorite altcoin. They rotate into other asset classes entirely.
The Timing Mismatch: Why Q4 Narratives Are Dead Wrong
Veterans keep calling for a Q4 2025 blow‑off top, stuck on the 2013/2017 template. But this cycle is different:
The 4th halving was April 19, 2024 - not May.
IG:BITCOIN typical 1.5‑year post‑halving peak landed in Q3 2025 (~$124K), not Q4.
The cycle is already complete.
Altcoins only thrive when IG:BITCOIN highs are fueled by retail FOMO and leverage. This cycle was powered by measured institutional accumulation. Without retail mania, alts had no fuel. The few that did pump ( CRYPTOCAP:HBAR , CRYPTOCAP:SUI , CRYPTOCAP:SOL , BINANCE:RENDERUSDT ) had real narratives or tech advantages. In a mature market, only quality survives.
The Next Real Alt Season: Q4 2026 and Beyond
Here’s the contrarian call: the next true alt season won’t arrive until Q4 2026 at the earliest.
Why? Because it will take a global financial crisis bottom, central banks printing like mad, and risk appetite returning before crypto regains its role as the speculative playground. That’s when we’ll see a decade‑long melt‑up that makes 2017 look quaint.
By then, 95% of today’s projects will be gone. Regulation will be clearer. Infrastructure will be mature. The survivors of this purge will form the foundation of the next supercycle. But first, the forest fire has to clear the dead wood.
What This Means for Your Bags
If you’re still holding 2021 altcoins waiting for a miracle, you’re fighting the last war. Smart money has rotated out. Retail is exhausted. Institutions aren’t coming to save your bags.
Most alts will bleed slowly into irrelevance - not with dramatic crashes, but with grinding decline as liquidity and attention flow elsewhere. The few survivors will be those with genuine utility, strong teams, and institutional interest. Everything else is destined for zero.
The New Playbook: Cash Is King
For the next 12–18 months, the winning strategy isn’t catching falling knives. It’s preservation of capital and patience. Hold cash. Maybe some Bitcoin as a hedge. Wait for the real bottom - when fear replaces hope and quality trades at fire‑sale prices.
The casino days are over. The market has grown up. And grown‑up markets don’t hand out infinite money glitches to anyone with an internet connection. The future belongs to those who adapt to the new rules - not those who keep playing by the old ones.
Bottom line: Alt season already happened in 2024. The next one won’t come until 2026+. Plan accordingly.

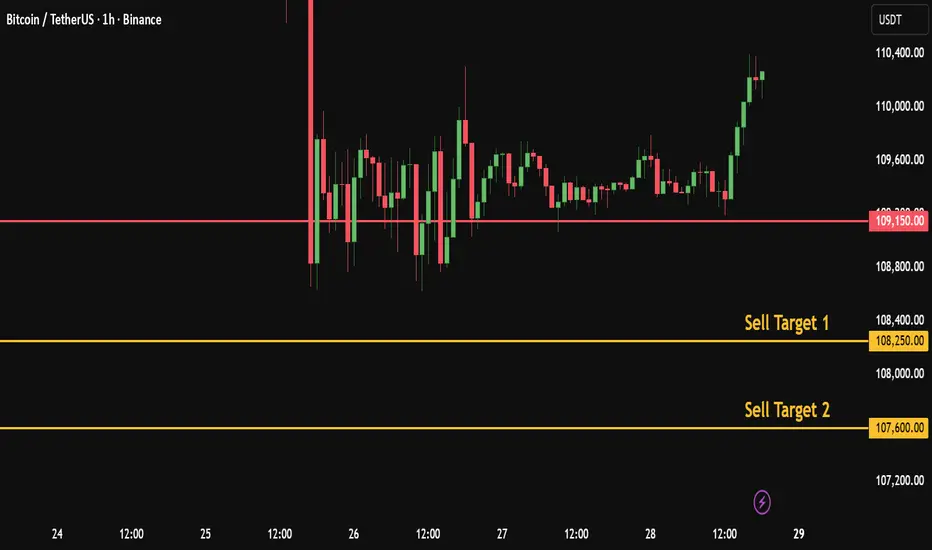
Daily Bitcoin Signal: Watching the 109K Breakout, target 107KBitcoin Daily Numeric Analysis
Based on my numeric analysis, Bitcoin is showing potential weakness near key support.
If price breaks and closes a 1H candle below 109,150, I will enter a short trade.
My Personal Short Setup
🎯 Target 1: 108,250
🎯 Target 2: 107,500
❌ Stop-loss: 110,600
👍 Don’t forget to boost this trading idea if you found it helpful,
and follow me for more daily crypto insights and trade setups.
Please note:
This is not financial advice – I’m only sharing my personal trades.
Always do your own research before taking action.
Best of luck 🌹
Daily Bitcoin Signal: Watching the 110,500 Breakout, target 113KBitcoin Technical Signal
Bitcoin is currently showing signs of strength as it tests the key resistance level around 110,500. A confirmed breakout above this zone could trigger fresh bullish momentum, opening the door for higher targets in the short term.
Here’s my personal trade plan:
If the price breaks and closes a 1H candle above 110,500, I will enter a long position.
🎯 Target 1: 111,650
🎯 Target 2: 113,200
🛑 Stop-loss: 109,500
Please note:
This is not financial advice – I’m only sharing my personal trades.
Always do your own research before taking action.
👍 Don’t forget to boost my trading idea if you found this useful, and feel free to follow me for more analysis of this kind.
Best of luck 🌹

TradeCityPro | Bitcoin Daily Analysis #182👋 Welcome to TradeCity Pro!
Let’s move on to Bitcoin analysis. Today the weekly candle closes, and from tomorrow the market can start moving again.
⌛️ 4-Hour Timeframe
On the 4-hour chart, Bitcoin has started a downward move from the 117,570 high, dropping in two bearish legs down to the 108,750 zone.
✨ After reaching this area, volume began to decrease—both because the market is ranging and because it’s the weekend.
✔️ Yesterday, in my analysis, I highlighted a range box on the 1-hour chart. This same box is still visible now on the 1-hour timeframe, spanning 108,750 to 109,890.
🧩 Today’s New York session is very important, since this session often drives weekend market moves. So watch the market carefully,our triggers might get activated.
🔑 If strong volume enters today and 108,750 breaks, we can look to open a short position. However, keep in mind there’s an important support area just below this level that could prompt a reaction and halt further decline.
⭐ For a long position, the first trigger we have is a breakout of 109,890. But note that the short-term trend is still bearish, so it’s better to wait for bullish confirmation first. A clean break of 109,890, followed by a higher high and higher low above this level, would be a solid confirmation for a potential upward move.
❌ Disclaimer ❌
Trading futures is highly risky and dangerous. If you're not an expert, these triggers may not be suitable for you. You should first learn risk and capital management. You can also use the educational content from this channel.
Finally, these triggers reflect my personal opinions on price action, and the market may move completely against this analysis. So, do your own research before opening any position.

SPX Market Update📊 SPX Market Update
SPX is testing the blue support level 🔵
⚠️ If it breaks down, this could confirm further downside momentum 📉
⚡ Stay alert and wait for confirmation before entering any trade.

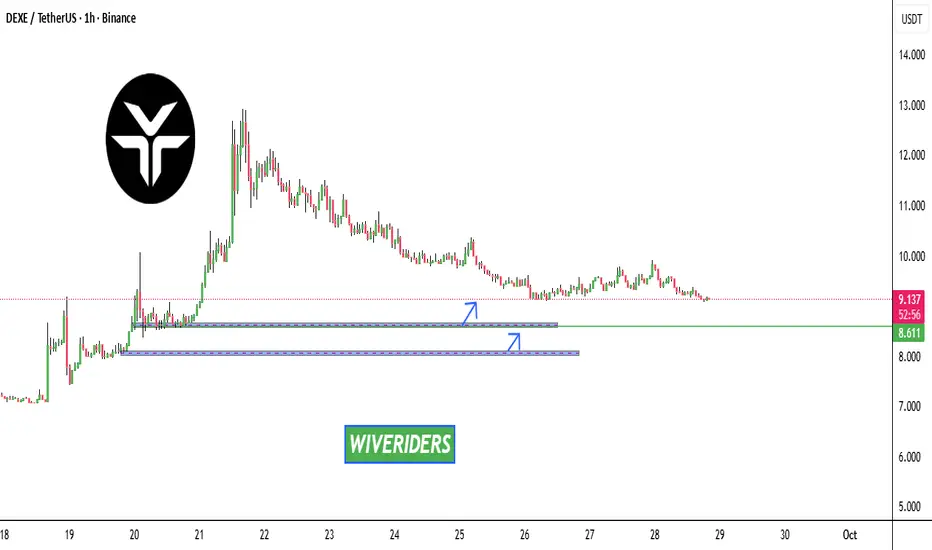
DEXE Market UpdateDEXE Market Update
DEXE is in a downtrend 📉
If the price keeps retracing, we have two green zone levels 🟢 where buyers previously accumulated. From these levels, the price could bounce up again with confirmation ✅
⚡ Always trade smart, not blind — wait for confirmation before entering.
ASTER Market Update📊 ASTER Market Update
ASTER has formed a bearish Double Top pattern ⚠️ and broke the blue support zone 🔵
What’s next? If price keeps retracing down, we have two green zone levels 🟢 where buyers previously accumulated.
These zones could give potential long entries or spots to accumulate more — but always wait for confirmation before entering ✅
⚡ Trade smart, not blind.

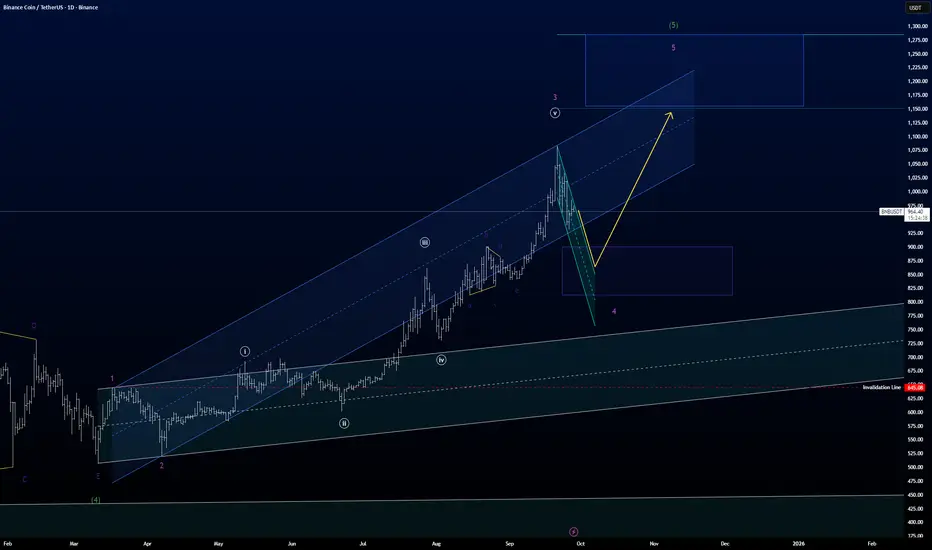
BNB does not completely obey, what BTC commands..In a count I did yesterday I wrote about BTC has started the decent, but from what I can see here, I still believe BNB need a little push up before going into a correction of a higher degree.
Right now BNB is in what I count to be purple wave 4.
And there is a chance purple wave 4 has already finished, and we therefor have started the move up in purple wave 5.
One of the guidelines in Kennedy channeling technique, which is a powerful tool in counting Elliott Waves, is that price has not completed wave 4 before tagging the bottom of the acceleration channel. (the blue channel).
Another guideline in Elliott Wave is that wave 4 often retraces down into wave 4 of the previous lower degree. (This area I have marked in the Purple box)
Therefor we could have a little downside left before starting the purple wave 5.
Being optimistic purple wave 4 is done, since I can count an simple zig-zig correction.
A confirmation of wave 4 is done and the purple wave 5 has started, is to wait for price to break the deceleration channel. (the green channel.)
But in either case, I believe BNB still has a wave 5 to finish before the correction down in a higher degree.
Bitcoin Daily - getting ready for a move higher ?
As I mentioned last time, that Red disgonal "line" is actually a large 236 Fib circle and, as usual, it has proved to be a line of resistance, pulling PA down, to reset and allow for moves higher.
Is the "Dip" over ?
Impossible to say but PA is certainly getting into a position to make moves higher.
The Daily MACD
Now below Neutral but note how th eHistogram is showing a White bar..A weakening of the Bearish move. But do understand, this alone is not reliable, as it can turn Red again.
The Daily RSI
This could offer some hope as we see that RSI is in an area were it has bounced previously
But, again, n Guarantees.
The 4 Hour PA chart
This shows us more detail on how PA has just gone Flat...waiting.
Early next week, we get the start of anew Month.
To be able to maintain the Bullish run over the previous months, we need a GREEN month cndle from BTC..
It is currently an inverse Green Hammer candle.
We may stay were we ar enow and Dro further at the start of October.
DON'T PANIC

ETH Price Action Looks Heavy – Danger Ahead?This chart is showing a clear pattern of accumulation followed by decline. Every time price moves sideways in a box range, instead of breaking upward with strength, it rolls over into another drop.
What this tells us is that the market is using these sideways phases as resting points for sellers to reload, not buyers to take control. Until CRYPTOCAP:ETH can break out of this cycle and hold above one of these consolidation zones, the overall trend remains heavy to the downside.
DYOR, NFA
#PEACEFUL
Follow for more updates and market insights on TradingView

BTCUSD ShortAs you see in the chart, I see many reasons that we can see BTC to the level of 85,000$ by end of the year. So the reasons are:
Head&Shoulder pattern
Started the downtrend channel
The bold blue trendline is what the price is expected to touch.

Ethena $ENAENA has been under selling pressure for several weeks, but price is now approaching a key breakout level from the downtrend line.
Breakout entry: above the trendline
Target zone: $0.8745 – $0.9070 (+55%)
Risk: limited if the breakout fails
R/R ratio: highly favorable
If the breakout is confirmed with volume, a strong move toward the target zone becomes very likely.
DYOR and NFA
Follow on X - for more details!

ZEC 4HZEC Looks bullish here. Broke trendline on 4H timeframe. We can expect the targets as shown on the charts. NFA DYOR
