Bearish drop off?The Bitcoin (BTC/USD) is rising towards the pivot which is a pullback resistance and could reverse to the 1st support that lines up with the 100% Fibonacci projection.
Pivot: 111,257.18
1st Support: 107,260.23
1st Resistance: 113,469.79
Disclaimer:
The above opinions given constitute general market commentary, and do not constitute the opinion or advice of IC Markets or any form of personal or investment advice.
Any opinions, news, research, analyses, prices, other information, or links to third-party sites contained on this website are provided on an "as-is" basis, are intended only to be informative, is not an advice nor a recommendation, nor research, or a record of our trading prices, or an offer of, or solicitation for a transaction in any financial instrument and thus should not be treated as such. The information provided does not involve any specific investment objectives, financial situation and needs of any specific person who may receive it. Please be aware, that past performance is not a reliable indicator of future performance and/or results. Past Performance or Forward-looking scenarios based upon the reasonable beliefs of the third-party provider are not a guarantee of future performance. Actual results may differ materially from those anticipated in forward-looking or past performance statements. IC Markets makes no representation or warranty and assumes no liability as to the accuracy or completeness of the information provided, nor any loss arising from any investment based on a recommendation, forecast or any information supplied by any third-party.
Cryptomarket

Bitcoin Drops Below $108.6K — What’s Next?
Bitcoin was holding near $115K, but now it's fallen below the $108.6K level. The next support is around $105K. If that breaks, we could see further downside toward $100K.
To turn bullish again, Bitcoin needs to reclaim $112K as support. If that happens, it could retest $115K–$120K.
#PEACE

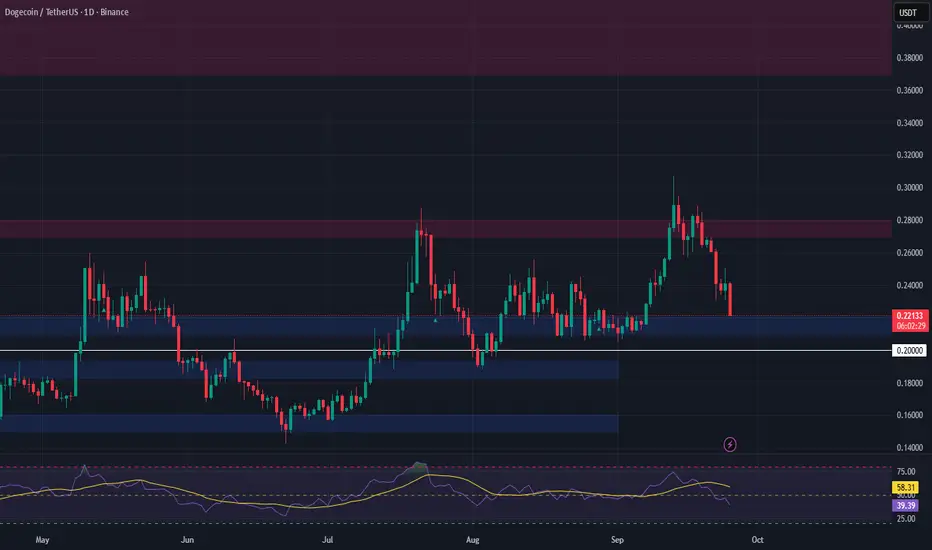
DOGE — Watching for a Relief Bounce from SupportDogecoin has pulled back into a key support zone at $0.21–$0.22, a level that has historically acted as both resistance and support. With the broader market showing signs of consolidation, this area could offer a short-term bounce opportunity.
That said, this is likely a relief rally within a broader downtrend, so managing risk is critical. A failure to hold this support could lead to a deeper correction later this month.
🔹 Trade Plan:
• Entry Zone: $0.21–$0.22
• Targets: $0.27–$0.28, $0.37–$0.44
• Stop Loss: Below $0.20
This is a spot-only setup with an asymmetric risk-reward profile if the bounce materializes. Avoid overleveraging and stick to your plan.
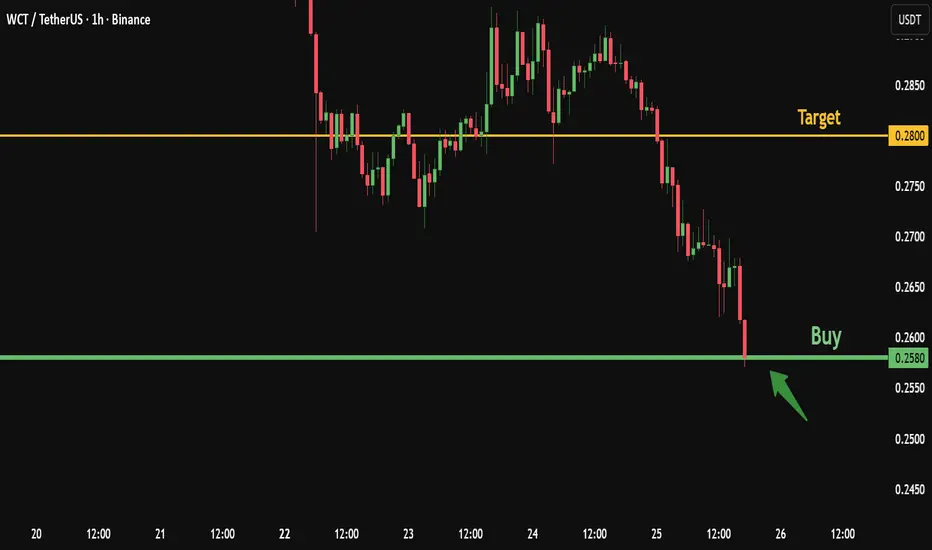
Don’t Miss WCT at Its Lowest Levels – Strong Buy SetupWCT is currently trading near its lowest levels, with the downtrend showing signs of exhaustion and price approaching its historical listing zone.
This creates an attractive risk–reward setup for potential buyers.
Here’s my personal trade plan:
✅ Entry : Buy from current price 0.2580
🎯 Target : 0.2800
The coin is at its bottom range, so if it falls further to 0.2300, I will add another buy position.
And if it reaches the historical listing price at 0.216, that would provide a great long-term buying opportunity once again
Please note:
This is not financial advice – I’m only sharing my personal trades.
Always do your own research before taking action.
👍 Don’t forget to like if you found this useful, and feel free to follow me for more analysis of this kind.
Best of luck 🌹
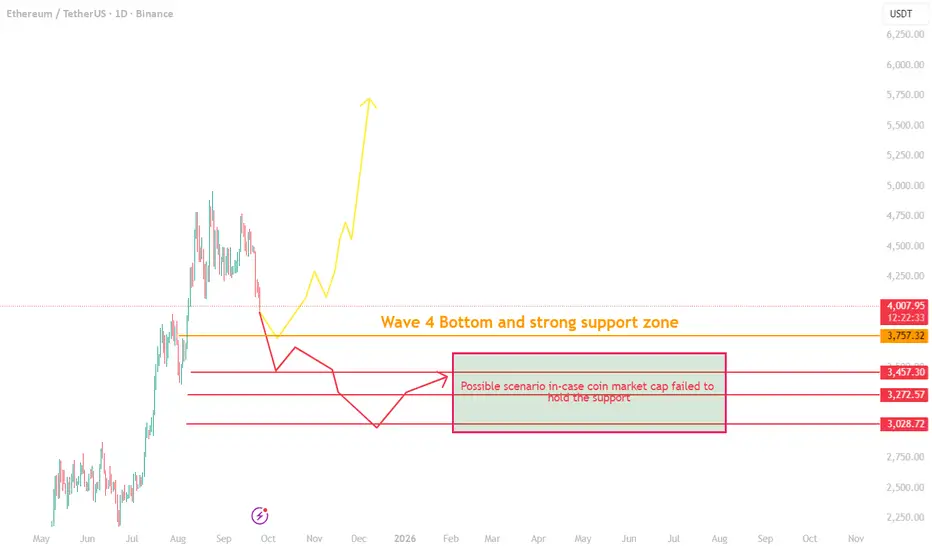
ETH Crash or Bounce? The Critical Level Everyone Is WatchingEthereum (ETH/USDT) – Critical Support Test Ahead
Ethereum is currently under pressure after breaking below the $4,000 support. The next significant level to watch is the $3,760 zone, which is not only a strong technical support but also aligns with the Elliott Wave 4 bottom as well as a key Fibonacci retracement area.
Key Scenarios
1. Bullish Recovery (Primary Expectation)
If ETH holds above the $3,760 support, we can expect consolidation in the range of $4,000 – $4,350.
This zone is likely to act as a base for Ethereum until broader market conditions stabilize.
Once momentum returns, ETH has the potential to resume its upward trend.
2. Bearish Breakdown
If ETH fails to defend $3,760, then deeper downside levels may come into play:
$3,450
$3,270
$3,000
This would represent a sharp and aggressive downturn. While possible, this remains weak scenario, given how violent the move would be.
Why the Answer Lies Outside ETH’s Chart
The real driver here isn’t just Ethereum—it’s the total "crypto market cap excluding BTC" as I have warned 2 days ago that's it's falling into a correction
The altcoin market cap is currently in correction as capital flows back into Bitcoin dominance, which has already broken its downtrend line and reached today 59%.
If the altcoin market cap holds its critical support and BTC dominance starts dropping, we can expect a broader bullish recovery across altcoins, with Ethereum following.
If that support breaks, then the weaker bearish scenario may unfold.
Conclusion
For now, the $3,760 support remains the critical line in the sand. Holding it keeps Ethereum within a bullish recovery path. Breaking it could open the door to deeper corrections.
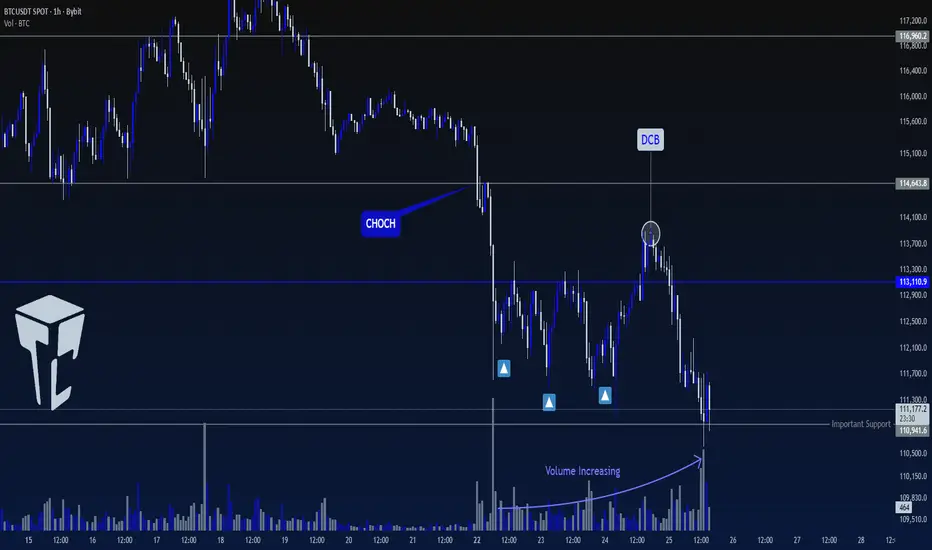
TradeCityPro | Bitcoin Daily Analysis #180👋 Welcome to TradeCity Pro!
Let’s move on to Bitcoin analysis. Yesterday Bitcoin continued its drop and made another downward move. Let’s check the market together.
⏳ 1-Hour Timeframe
Bitcoin in the 1-hour timeframe started a downward move and, with consolidation below the 114643 area, turned bearish in lower cycles.
⭐ After finishing the first bearish leg, the price formed a top around the 113110 area and made a deep correction up to above this area, which can be called a DBC, because after that a new downward move started.
✔️ At the moment the price is on the 110941 support, and during this downward move that happened after the break of 114643, the volume has completely increased and the volume of bearish candles has been much higher than bullish candles.
🔑 Breaking the 110941 area can start the next bearish leg. In this case the next move can be much longer and the price can move down with more bearish momentum.
✨ On the other hand, if this area holds as support, we can get the first sign of a trend change, but for now I don’t think the market is giving us any specific position because there is not a proper structure for a long and at the same time there isn’t enough bearish momentum for a short position either.
❌ Disclaimer ❌
Trading futures is highly risky and dangerous. If you're not an expert, these triggers may not be suitable for you. You should first learn risk and capital management. You can also use the educational content from this channel.
Finally, these triggers reflect my personal opinions on price action, and the market may move completely against this analysis. So, do your own research before opening any position.
BMNR HIGH PROBABILITY SETUPS SOON!!!🚨 BMNR HIGH PROBABILITY SETUPS 🚨
* Here We Can See Clearly The Next Potential Moves For BMNR Coming Hours/Days.
* Keep Your Eyes Close On Your Trading Positions.
* Happy PIP Hunting Traders.
FXKILLA.

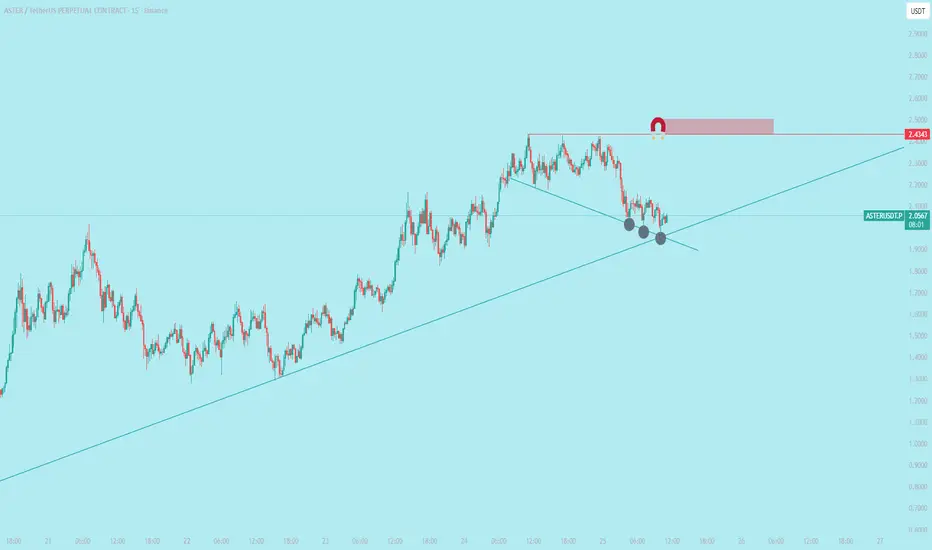
$ASTER is ready for ATH vibes again$ASTER is ready for ATH vibes again
Price Movement: The chart shows a significant uptrend from around $1,000 to a peak near $2,443, followed by a pullback to the current price of $2,049 (as of 10:44 UTC on September 25, 2025). This indicates a recent correction after hitting resistance.
Resistance Level: The horizontal red line at $2,443 acts as a key resistance level where the price struggled to break through, suggesting strong selling pressure at this point.
Support Zone: The intersection of the two trend lines (light blue upward trend and darker blue downward trend) around $2,000-$2,100 marks a potential support zone. The gray circles highlight this area where the price might find buying interest.
Trend Lines: The upward-sloping light blue line reflects the overall uptrend, while the downward-sloping darker blue line indicates a short-term correction or consolidation phase.
Volume and Momentum: While volume data isn't fully visible, the price action suggests momentum has slowed after the resistance test, with a 0.27% change indicating stability at the current level.
Outlook: The price is currently testing the support zone. A bounce from here could signal a retest of $2,443, while a break below $2,000 might lead to further downside toward $1,800-$1,900.
$ETH shows bullish hidden RSI divergence.A **bullish hidden RSI divergence** is a trading signal that suggests a continuation of an upward trend, often indicating that the price will keep rising. It occurs when the price action and the Relative Strength Index (RSI) show a specific pattern. Here's a simple explanation of how to identify and trade it:
### Step 1: Understand the Pattern
- **Price Action**: The price makes **higher lows** (each low point is higher than the previous one), indicating an uptrend.
- **RSI**: The RSI makes **lower lows** (the RSI is declining while the price is not), showing a divergence from the price trend.
- This mismatch suggests that the uptrend is still strong, and the dip in RSI is just a temporary slowdown in momentum, not a reversal.
### Step 2: Identify the Divergence
1. **Chart Setup**: Use a price chart (e.g., candlestick chart) with the RSI indicator (typically set to 14 periods) on a platform like TradingView .
2. **Spot Higher Lows in Price**: Look for a price chart where the recent low is higher than the previous low (e.g., $100 to $105).
3. **Check RSI for Lower Lows**: At the same time, check if the RSI is making a lower low (e.g., RSI drops from 50 to 45 while price makes a higher low).
4. **Confirm the Uptrend**: Ensure the overall trend is bullish (price is generally moving up with higher highs and higher lows).
### Step 3: Trading the Bullish Hidden RSI Divergence
1. **Entry Point**:
- Enter a **buy** trade when you confirm the divergence and see the price starting to rise again after the higher low.
- Look for additional confirmation, like a bullish candlestick pattern (e.g., a hammer or engulfing candle) or a break above a resistance level.
2. **Stop Loss**:
- Place a stop loss below the most recent higher low to protect against a potential trend reversal.
- For example, if the higher low is at $105, set the stop loss slightly below, like $103.
3. **Take Profit**:
- Target a take-profit level based on previous highs, support/resistance levels, or a risk-reward ratio (e.g., 1:2, meaning you aim for twice the profit compared to your risk).
- For instance, if your stop loss is $2 below entry, aim for a $4 profit target.
### Step 4: Manage the Trade
- **Monitor RSI**: Ensure RSI doesn’t drop into oversold territory (below 30) or show signs of a bearish reversal.
- **Adjust Stop Loss**: As the price moves up, consider trailing your stop loss to lock in profits.
- **Exit Strategy**: Exit the trade if the price hits your target, or if you see signs of a trend reversal (e.g., a bearish divergence or break of key support).
### Example
- **Price**: Stock XYZ makes a low at $100, then a higher low at $105.
- **RSI**: RSI drops from 50 to 45 during the same period.
- **Action**: You enter a buy trade at $106 after a bullish candle. Set a stop loss at $103 and aim for a take-profit at $110 (1:2 risk-reward).
- **Outcome**: If the price continues its uptrend to $110, you take profit. If it drops below $103, you exit with a small loss.
### Tips
- **Timeframes**: Use higher timeframes (e.g., 1-hour, 4-hour, or daily) for more reliable signals.
- **Confirmation Tools**: Combine with other indicators like moving averages or trendlines for stronger signals.
- **Practice**: Test this strategy on a demo account before using real money to understand how it works in different market conditions.
- **Risk Management**: Never risk more than 1-2% of your trading account on a single trade.
This strategy works best in trending markets, so always confirm the broader trend before trading.

BTC/USDT Outlook – Volatility Rises After Sharp DeclineBTC/USDT Market Report
Bitcoin recently faced heavy selling pressure, pushing the market into a sharp decline. This drop reflects a shift in sentiment where earlier stability has been replaced by increased volatility and downside momentum.
Price action shows signs of exhaustion after the fall, suggesting the possibility of a short-term rebound attempt. However, broader behavior still reflects uncertainty, with buyers needing stronger participation to shift momentum back in their favor.
If downward pressure continues, deeper corrections could emerge before any meaningful recovery. In the near term, traders should expect sharp swings as the market tries to stabilize.

The Bitcoin Long Trigger No One MentionsYo traders, Skeptic from Skeptic Lab! 🚀 Bitcoin’s in a wild phase—any move could drag us for weeks! In this video, I break down the buy squeeze candle that started it all, dive candle-by-candle into the market, and hunt for long/short triggers. We’ll also check Bitcoin dominance and altcoin vibes. From a V pattern to pivot 4 action, I’ve got you covered. no FOMO! Drop your coin picks in the comments, boost if it helped, and follow for more.

BAD NEWS for Bitcoin :(. BE CAREFUL!My last Prediction was PERFECT . i know this will UPSET many bulls, but this is how the MARKETS WORK. After a strong uptrend and extreme greed environment, its time for Bitcoin to CORRECT and have strong PULLBACK. Look at the channel and trendlines, I expect bitcoin to reach a price of 100k/96k in the coming weeks. That will be a GOOD BUY opportunity. BE CAREFUL AND STAY WISE.
See My Previous PERFECT prediction:
BINANCE:BTCUSD COINBASE:BTCUSD CRYPTO:BTCUSD OKX:BTCUSD

Ethereum $ETH similar price action to late JuneIt's not perfect look to see CRYPTOCAP:ETH losing the daily range
However, the current PA oddly reminds me of one from late June
RSI and AO are similar as well
The next few days will be interesting to see if they are trying to scare the paper hands before the generation run, or the generational run is getting postponed for now

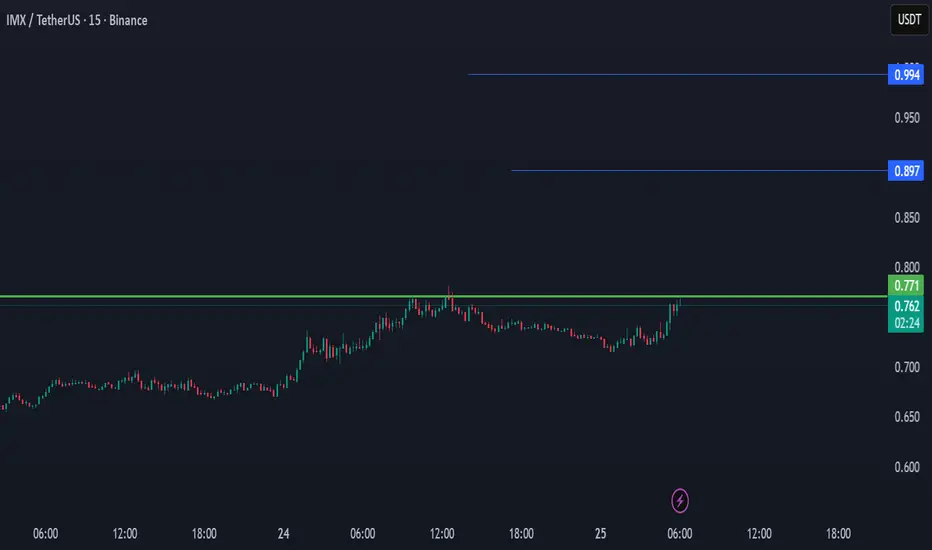
IMX NEW INCREASE VOLUME📊IMX has a pre-scan increase, which could build to a real increase in the coming time frame.
With the View of 2 levels, what IMX can target
Between $0,73 and $0,75, possibility of new uptrend volume
With the data study, this coin comes out as a coin that can show a new increase, even with the breakdown of the main market.
We will follow it to see what the possibilities are
BTCUSD H4 | Bearish drop offBitcoin (BTC/USD) has rejected off the sell entry at 113,380.39, which is a pullback resistance and could potentially drop from this level to the downside.
Stop loss is at 115,645.29, which is a pullback resistance.
Take profit is at 109,425.81, which acts as a pullback support that aligns with the 78.6% Fibonacci retracement.
High Risk Investment Warning
Trading Forex/CFDs on margin carries a high level of risk and may not be suitable for all investors. Leverage can work against you.
Stratos Markets Limited (tradu.com ):
CFDs are complex instruments and come with a high risk of losing money rapidly due to leverage. 65% of retail investor accounts lose money when trading CFDs with this provider. You should consider whether you understand how CFDs work and whether you can afford to take the high risk of losing your money.
Stratos Europe Ltd (tradu.com ):
CFDs are complex instruments and come with a high risk of losing money rapidly due to leverage. 66% of retail investor accounts lose money when trading CFDs with this provider. You should consider whether you understand how CFDs work and whether you can afford to take the high risk of losing your money.
Stratos Global LLC (tradu.com ):
Losses can exceed deposits.
Please be advised that the information presented on TradingView is provided to Tradu (‘Company’, ‘we’) by a third-party provider (‘TFA Global Pte Ltd’). Please be reminded that you are solely responsible for the trading decisions on your account. There is a very high degree of risk involved in trading. Any information and/or content is intended entirely for research, educational and informational purposes only and does not constitute investment or consultation advice or investment strategy. The information is not tailored to the investment needs of any specific person and therefore does not involve a consideration of any of the investment objectives, financial situation or needs of any viewer that may receive it. Kindly also note that past performance is not a reliable indicator of future results. Actual results may differ materially from those anticipated in forward-looking or past performance statements. We assume no liability as to the accuracy or completeness of any of the information and/or content provided herein and the Company cannot be held responsible for any omission, mistake nor for any loss or damage including without limitation to any loss of profit which may arise from reliance on any information supplied by TFA Global Pte Ltd.
The speaker(s) is neither an employee, agent nor representative of Tradu and is therefore acting independently. The opinions given are their own, constitute general market commentary, and do not constitute the opinion or advice of Tradu or any form of personal or investment advice. Tradu neither endorses nor guarantees offerings of third-party speakers, nor is Tradu responsible for the content, veracity or opinions of third-party speakers, presenters or participants.

ETHUSD H4 | Falling towards pullback supportEthereum (ETH/USD) is falling towards the buy entry at 3,895.02, which is a pullback support that is slightly above the 38.2% Fibonacci retracement and could bounce from this level to the take profit.
Stop loss is at 3,551.04, which is a pullback support that aligns with the 50% Fibonacci retracement.
Take profit is at 4,386.55, which is a pullback resistance.
High Risk Investment Warning
Trading Forex/CFDs on margin carries a high level of risk and may not be suitable for all investors. Leverage can work against you.
Stratos Markets Limited (tradu.com ):
CFDs are complex instruments and come with a high risk of losing money rapidly due to leverage. 65% of retail investor accounts lose money when trading CFDs with this provider. You should consider whether you understand how CFDs work and whether you can afford to take the high risk of losing your money.
Stratos Europe Ltd (tradu.com ):
CFDs are complex instruments and come with a high risk of losing money rapidly due to leverage. 66% of retail investor accounts lose money when trading CFDs with this provider. You should consider whether you understand how CFDs work and whether you can afford to take the high risk of losing your money.
Stratos Global LLC (tradu.com ):
Losses can exceed deposits.
Please be advised that the information presented on TradingView is provided to Tradu (‘Company’, ‘we’) by a third-party provider (‘TFA Global Pte Ltd’). Please be reminded that you are solely responsible for the trading decisions on your account. There is a very high degree of risk involved in trading. Any information and/or content is intended entirely for research, educational and informational purposes only and does not constitute investment or consultation advice or investment strategy. The information is not tailored to the investment needs of any specific person and therefore does not involve a consideration of any of the investment objectives, financial situation or needs of any viewer that may receive it. Kindly also note that past performance is not a reliable indicator of future results. Actual results may differ materially from those anticipated in forward-looking or past performance statements. We assume no liability as to the accuracy or completeness of any of the information and/or content provided herein and the Company cannot be held responsible for any omission, mistake nor for any loss or damage including without limitation to any loss of profit which may arise from reliance on any information supplied by TFA Global Pte Ltd.
The speaker(s) is neither an employee, agent nor representative of Tradu and is therefore acting independently. The opinions given are their own, constitute general market commentary, and do not constitute the opinion or advice of Tradu or any form of personal or investment advice. Tradu neither endorses nor guarantees offerings of third-party speakers, nor is Tradu responsible for the content, veracity or opinions of third-party speakers, presenters or participants.

SOLUSD H4 | Bearish dropSolana (SOL/USD) has rejected off the sell entry which is a pullback resistance and oculd potentially drop from this level to the downside.
Sell entry is at 217.255, which is a pullback resistance.
Stop loss is at 231.317, which is a pullback resistance.
Take profit is at 188.19, which acts as an overlap support.
High Risk Investment Warning
Trading Forex/CFDs on margin carries a high level of risk and may not be suitable for all investors. Leverage can work against you.
Stratos Markets Limited (tradu.com ):
CFDs are complex instruments and come with a high risk of losing money rapidly due to leverage. 65% of retail investor accounts lose money when trading CFDs with this provider. You should consider whether you understand how CFDs work and whether you can afford to take the high risk of losing your money.
Stratos Europe Ltd (tradu.com ):
CFDs are complex instruments and come with a high risk of losing money rapidly due to leverage. 66% of retail investor accounts lose money when trading CFDs with this provider. You should consider whether you understand how CFDs work and whether you can afford to take the high risk of losing your money.
Stratos Global LLC (tradu.com ):
Losses can exceed deposits.
Please be advised that the information presented on TradingView is provided to Tradu (‘Company’, ‘we’) by a third-party provider (‘TFA Global Pte Ltd’). Please be reminded that you are solely responsible for the trading decisions on your account. There is a very high degree of risk involved in trading. Any information and/or content is intended entirely for research, educational and informational purposes only and does not constitute investment or consultation advice or investment strategy. The information is not tailored to the investment needs of any specific person and therefore does not involve a consideration of any of the investment objectives, financial situation or needs of any viewer that may receive it. Kindly also note that past performance is not a reliable indicator of future results. Actual results may differ materially from those anticipated in forward-looking or past performance statements. We assume no liability as to the accuracy or completeness of any of the information and/or content provided herein and the Company cannot be held responsible for any omission, mistake nor for any loss or damage including without limitation to any loss of profit which may arise from reliance on any information supplied by TFA Global Pte Ltd.
The speaker(s) is neither an employee, agent nor representative of Tradu and is therefore acting independently. The opinions given are their own, constitute general market commentary, and do not constitute the opinion or advice of Tradu or any form of personal or investment advice. Tradu neither endorses nor guarantees offerings of third-party speakers, nor is Tradu responsible for the content, veracity or opinions of third-party speakers, presenters or participants.

BCHUSD H4 | Bearish drop offBCH/USD is rising towards the sell entry which is a pullback resistance and could drop from this level to the downside.
Sell entry is at 560.20, which is a pullback resistance.
Stop loss is at 576.77, which acts as a pullback resistance.
Take profit is at 526.72, which is a swing low support.
High Risk Investment Warning
Trading Forex/CFDs on margin carries a high level of risk and may not be suitable for all investors. Leverage can work against you.
Stratos Markets Limited (tradu.com ):
CFDs are complex instruments and come with a high risk of losing money rapidly due to leverage. 65% of retail investor accounts lose money when trading CFDs with this provider. You should consider whether you understand how CFDs work and whether you can afford to take the high risk of losing your money.
Stratos Europe Ltd (tradu.com ):
CFDs are complex instruments and come with a high risk of losing money rapidly due to leverage. 66% of retail investor accounts lose money when trading CFDs with this provider. You should consider whether you understand how CFDs work and whether you can afford to take the high risk of losing your money.
Stratos Global LLC (tradu.com ):
Losses can exceed deposits.
Please be advised that the information presented on TradingView is provided to Tradu (‘Company’, ‘we’) by a third-party provider (‘TFA Global Pte Ltd’). Please be reminded that you are solely responsible for the trading decisions on your account. There is a very high degree of risk involved in trading. Any information and/or content is intended entirely for research, educational and informational purposes only and does not constitute investment or consultation advice or investment strategy. The information is not tailored to the investment needs of any specific person and therefore does not involve a consideration of any of the investment objectives, financial situation or needs of any viewer that may receive it. Kindly also note that past performance is not a reliable indicator of future results. Actual results may differ materially from those anticipated in forward-looking or past performance statements. We assume no liability as to the accuracy or completeness of any of the information and/or content provided herein and the Company cannot be held responsible for any omission, mistake nor for any loss or damage including without limitation to any loss of profit which may arise from reliance on any information supplied by TFA Global Pte Ltd.
The speaker(s) is neither an employee, agent nor representative of Tradu and is therefore acting independently. The opinions given are their own, constitute general market commentary, and do not constitute the opinion or advice of Tradu or any form of personal or investment advice. Tradu neither endorses nor guarantees offerings of third-party speakers, nor is Tradu responsible for the content, veracity or opinions of third-party speakers, presenters or participants.

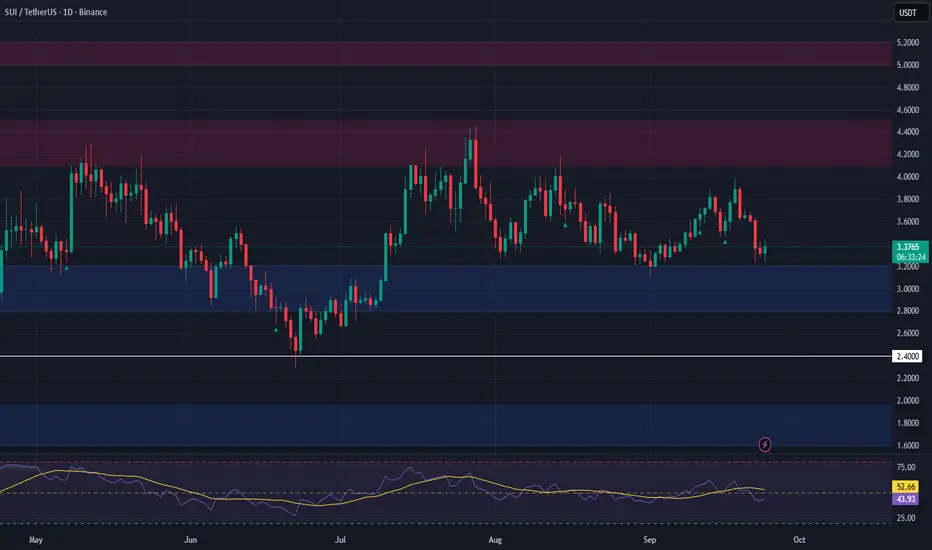
SUI Swing Trade Setup – Accumulation at Key SupportSUI has retraced to a major support zone, presenting a potential long swing setup. Price action is showing signs of a possible base, with another dip into early September likely before a reversal.
The strategy here is to ladder into long positions between $2.80–$3.20, aiming for a bounce toward previous resistance zones. Risk is managed with a tight invalidation below the last major support.
• Entry Zone: $2.80–$3.20
• Targets: $4.10–$4.50, $5.00–$5.20
• Stop Loss: Below $2.40
MNT Market Update📊 TSX:MNT Market Update
TSX:MNT is testing the blue support level 🔵
If it breaks out to the downside with confirmation, there’s potential for a short setup with the target at the green line level 🎯📉

BNB Fuel Bullish MomentumBNBUSD took support near 55- 4H EMA and showed a nice pullback on positive developments. It hits an intraday high of $1034.90 and is currently trading around $1034.20.
Significant expansion for BNB Chain is possible thanks to corporate treasury adoption, real-world asset (RWA) tokenization, and infrastructure improvements. Planned improvements hope to cut transaction costs in half and increase performance tenfold by 2026; recent Maxwell and Lorentz hard forks are already lowering block times to 0.75 seconds and gas fees to $0.001. Its position as a top Layer-1 with $369.2 billion in 30-day DEX trading volume and more than 5,000 is further enhanced. Corporations like Nano Labs and Windtree, along with institutional interest from groups like B Strategy, are adopting dApps that help to create a supply-demand mismatch by lowering the liquid supply on exchanges. With alliances including Securitize, VanEck, and Ondo Finance, and a $14 billion TVL top, BNB Chain's foray into RWA tokenization is also broadening use, maybe driving BNB prices toward analyst targets of $1,500–$2,000 as these triggers combine to boost institutional demand, real-world applications, and developer activity.
Short-term trend remains bullish as long as support $867 (365 4H EMA) holds. It trades above the 55,200 and 365 EMA on the 4-hour chart. Near-term support is around $989; any close below targets $960/$940/$928/$900/$865/$845/$810/$780/$755/$740. If the pair closes below $500, it potentially leads to further declines towards $400.
Immediate Resistance is at $1035.Any breakout above this resistance confirms bullish momentum and a jump towards $1050/$1100/$1150.
Indicators ( 4-Hour Chart)
Directional Movement Index: Bullish
CCI (50): Bullish
Trading Strategy
It is good to buy on dips around $1000 with a stop-loss set at $960 and a target price of $1150.

$BTC beautiful range to play i will looking for short!lower time frame rejection call lead us for more downside ! keep eye on it..

TradeCityPro | Bitcoin Daily Analysis #179👋 Welcome to TradeCity Pro!
Let’s move on to Bitcoin analysis. After a few days, it’s time to resume our updates.
⌛️ 4-Hour Timeframe
After breaking the 116,960 zone, Bitcoin failed to hold above it and the upward move turned out to be a fake breakout.
⚡️ Following that, a corrective move began. After consolidating below 114,819, the price continued its correction down to 111,524.
✔️ So far, the reaction to this level has been positive, with several green candles forming off this support.
🔑 However, the key point is that volume hasn’t increased, which is not a good sign for buyers.
🔍 If 111,524 breaks, the downtrend could extend toward the main support floor below.
💥 On the other hand, if price manages to create higher highs and higher lows above 111,524 and volume starts to pick up, a confirmed close above 114,819 could offer a long entry setup.
📈 A breakout of 116,960 will remain the primary long trigger. A clean break above that level will confirm the start of a new bullish leg.
❌ Disclaimer ❌
Trading futures is highly risky and dangerous. If you're not an expert, these triggers may not be suitable for you. You should first learn risk and capital management. You can also use the educational content from this channel.
Finally, these triggers reflect my personal opinions on price action, and the market may move completely against this analysis. So, do your own research before opening any position.
