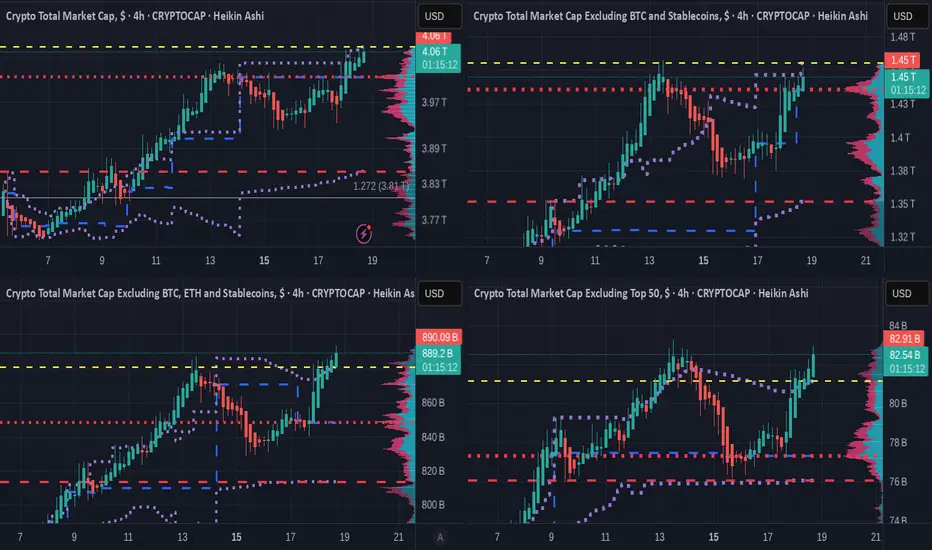
4 X Crypto TOTAL charts showing who is leading the packTHESE ARE THE SHORTER TERM 4 HOUR CHARTS
Top line - TOTAL Crypto Market Cap - TOTAL 2 (Excluding BTC )
Bottom Line - TOTAL 3 ( Excluding BTC & ETH ) - OTHERS ( Top 125 coins minus Top 50 by market cap )
TOTAL 3 is ALL ALT coins
OTHERS is Mid to Lower Cap ALT coins
These 4 Charts use the VRVP
the Volume Profile Visible Range (VPVR), is a technical analysis indicator on TradingView that displays the distribution of trading volume at different price levels within the currently visible range of a chart.
The Colour Key is below
Value Area High ( VAH ) - Yellow Dashed Line
Value Area Low ( VAL ) - Red Dashed line
Point of Control ( POC ) - Red Dotted line
Developing POC - Blue Dashed line
Developing Value Area - Purple Dotted line
The first thing to see is simply that OTHERS has a higher gain than any..
ALT SEASON is here but be VERY Cautious about how long this may last...
IT MAY NOT LAST long.....we MUST watch daily to see what is happening.
Because BTC is poised and ready able to move at any time and when it happens, usually Stops ALTS in their tracks.
Watch the Bitcoin Dominance chart
As you can see, we are in the Zone for a Bitcoin ATH in the next few months.
Be Cautious
So, currently, we have the TOTAL chart just coming up to the VAH. This may prove to be resistance in which Case ALTS may run longer. However, the POC just below could prove to be enough support to push PA above that VAH on a 2nd attempt, IF that is required.
TOTAL 2 is below but rising and the same may apply to the POC just below.
However, the TOTAL 3 and OTHERS are already above the VAH line and so have a clear road ahead but when this fails, the POC sipport is a LONG way below.
This is early days of reaction to the FED 25 point Drp [ and so we need to remain cautious as to the Trend that has yet to prove itself..
But things do look good.....
Cryptomarket
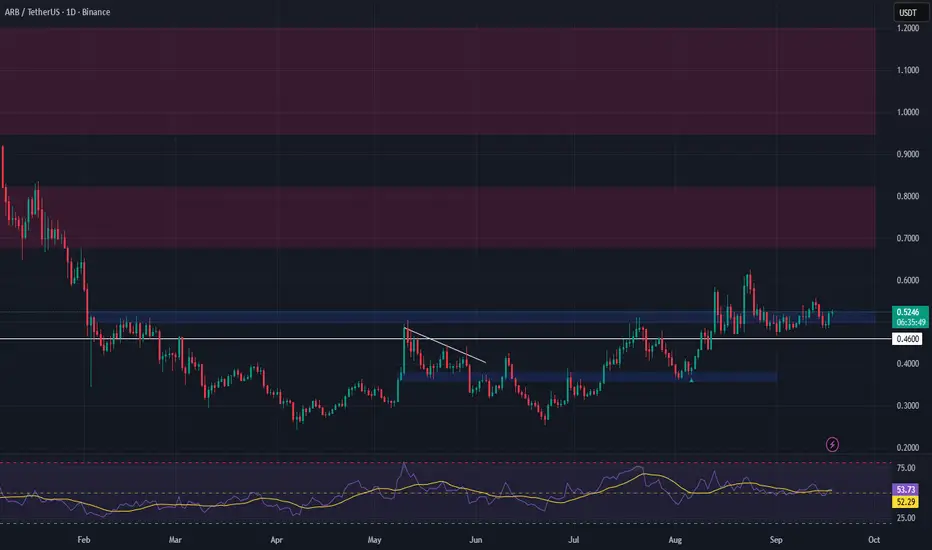
ARB Swing Trade Setup – Retest of Major Support ZoneArbitrum (ARB) recently posted a 64%+ rally, but has now pulled back into a key support zone between $0.50 and $0.5250. This area marks previous breakout levels and could serve as a strong base for the next bullish leg.
Despite the short-term retracement, ARB maintains a bullish structure. If this support holds, the current dip could offer an attractive risk-reward setup for swing traders. A bounce here aligns with the broader market sentiment and prior accumulation zones.
🔹 Trade Setup:
• Entry Zone: $0.50 – $0.5250
• Take Profit Targets:
🥇 $0.68 – $0.82
🥈 $0.95 – $1.20
• Stop Loss: Daily close below $0.46
MOODENG / USDT : Showing strength after successful retestAfter a successful retest, MOODENG is showing strong momentum and moving forward. A rally towards $0.30 – $0.35 is now expected.
Always manage risk and wait for confirmation on the next moves.

Crypto Charts & Levels (Live Breakdown)All Charts & Levels From Today’s Live Breakdown 🎯📈
Here’s the complete walkthrough from today’s live session — a jam-packed review of everything on the radar. From majors like ETH to niche plays like KEETA, we’re covering support, resistance, and directional bias one by one 👇
🔹 ETHEREUM (ETH)
Support: 4,551
Target: 4,881 short-term — with potential to hit 5,500 later this month.
I’m bullish. ATH is back on the table.
🔹 BITCOIN DOMINANCE (BTC.D)
Levels: 54 and 56
Still looking good — dominance rotation in play.
🔹 ETHEREUM DOMINANCE (ETH.D)
Under resistance — watch smaller alts.
ETH remains bullish vs BTC — target: 0.06
🔹 XRP
Support: 0.32
Bias: Bullish — looking ready to move again.
🔹 ARBITRUM (ARB)
Resistance: 0.55–0.56
Break that, and 0.76 → 1.31 opens up.
🔹 GRT & STX
Slow. Uninspiring. Out for now.
🔹 WLD
Support: 1.49
Target: 2.52 — In this one. Clean chart.
🔹 TRX
Missed entry at 0.30
Potential: 0.38 → 0.46–0.47
Too volatile. Not chasing.
🔹 ICP & UNI
Breakout failures — I’m staying out.
🔹 AVAX
Support: 30
Resistance: 35
Target: 43 → 46
Already took profit. Caution on late entries.
🔹 SHIBA INU (SHIB)
Support: 13.05
Target: 16.16
Waiting for breakout over resistance. Still holding.
🔹 LITECOIN (LTC)
Support: 104
Target: 131 → 188
Watching. Not yet confirmed breakout.
🔹 DOGECOIN (DOGE)
Resistance: 0.30–0.309
We traded this channel well. No entry now — but staying alert.
🔹 TONCOIN (TON)
Support: 2.90
Resistance: 3.74
Breakout = target 6.00
Might wake up soon, but not entering yet.
🔹 INJECTIVE (INJ)
Support: 12
Resistance: 14.95 → 15.71
Middle of the range. I’ll pass.
🔹 OPTIMISM (OP)
Resistance: 0.88
Alert set — will enter on breakout only.
🔹 SNX
Resistance: 0.78
Same as OP — needs breakout before entry.
🔹 PYTH
Entry triggered live: Over 0.1739
Target: 0.2130
Stop loss at 0.172 — already long on this one.
🔹 H-BAR
Resistance-heavy around 0.26–0.28
Not touching it. Possible short setup only.
🔹 SUI
Resistance: 3.97
Buying either over resistance or deep at support. No trade now.
🔹 SEI
Targets on breakout: 0.603 → 0.75 → 1.10
Potential setup — needs patience.
🔹 PUMP
Big resistance: 0.0084
No trade right now. Staying out.
🔹 MYX
Possible short: Down to 11.81
We nailed previous shorts. Not chasing this one although tempted to shortagain..i am bulish today so no.
🔹 ENA (Amazing chart)
Support: 0.67
Targets: 0.91 → 1.05
Strong chart. I like this setup.
🔹 KEETA
Support: 0.77
Target 1: 1.18
Target 2: 1.54
Target 3: 1.82
Moon Target: 2.17
Below 0.77 → run. Below 0.49 = out completely.
Fundamentals unknown, but chart is clean. If traction comes, levels are clear.
🔁 Perspective Shift 🔄
“Even with a full board of setups, the best trades are the ones you don’t take. Clarity beats quantity — always wait for the right level, not the right feeling.”
Disclaimer: My posts reflect personal observations, not instructions to buy or sell. I am not a financial advisor. Trading carries risk, and only you are responsible for your results.
One Love,
The FXPROFESSOR 💙

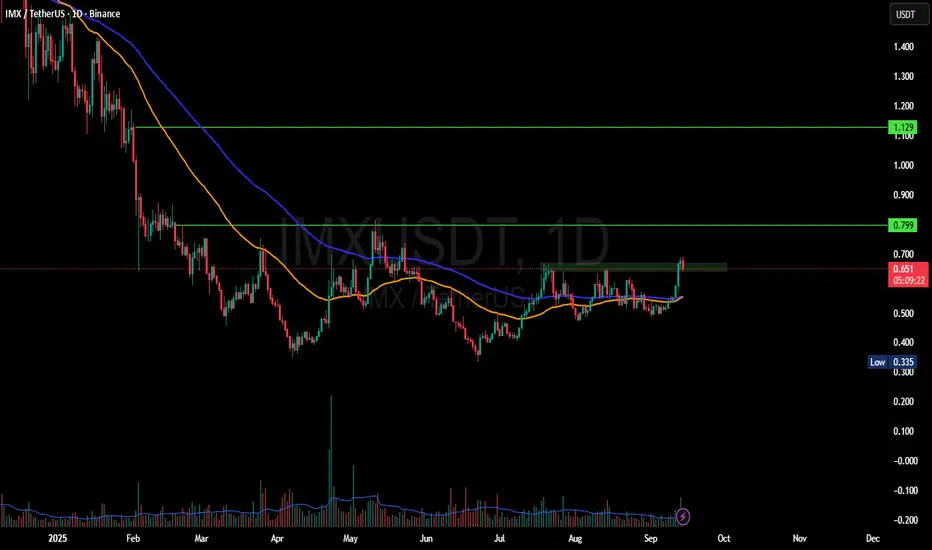
IMX 1 Day AnalysisHere is an analysis for IMX on daily timeframe. It has broke resistance and now testing the same. Bounce from here and we can the expected targets achieved.
TIA Swing Long OpportunityTIA Swing Long Opportunity
📊 Market Sentiment
Market sentiment is bullish, fueled by the FED restarting rate cuts. We’ve seen a 0.25 BPS cut in September, with expectations for two more consecutive 0.25 cuts in the coming months. In addition, institutional liquidity flow into crypto has increased as the US officially adopted crypto as part of its international reserves. While inflation remains elevated, a weakening labor market is forcing the FED to ease policy, pushing liquid capital into risk-on markets.
📈 Technical Analysis
Price created a Daily Demand Zone at $1.70 and bounced, confirming its validity.
Price also broke the bearish trendline and closed multiple candles above, signaling further upside potential toward higher liquidity targets.
📌 Game Plan
I already entered the position after rejection at $1.70 and will manage it as a swing setup, targeting highs around $3 — a potential 70% expansion.
🎯 Setup Trigger
Validation came from the rejection at $1.70.
📋 Trade Management
Stoploss: Daily close below $1.30
Target: $3 (Potential 70% expansion)
💬 Like, follow, and comment if you find this setup valuable!
⚠️ Disclaimer: This content is for informational and educational purposes only and does not constitute financial, investment, or trading advice. Always DYOR before making any financial decisions.

ETH ANALYSIS🔴 #ETH Analysis : ❓❓
🔮There is a formation of "Bullish Pennant Pattern" in #ETH in 4HR time frame. We can expect around $4850 bullish move if the price break the pattern.📈
⚡️What to do ?
👀Keep an eye on #ETH price action. We can trade according to the chart and make some profits. ⚡️⚡️
#ETH #Cryptocurrency #Breakout #DYOR

BRETT / USDT : Breaking out from symmetrical triangleBRETT / USDT is breaking out from the symmetrical triangle. If this breakout holds, we could see a strong rally towards $0.085 – $0.095 in the short term.
Always wait for confirmation and manage risk properly.

TradeCityPro | Bitcoin Daily Analysis #178👋 Welcome to TradeCity Pro!
Let’s move on to Bitcoin analysis. Yesterday the interest rate decision was released and Powell gave a speech. Let’s see how this affected the market.
⌛️ 4-Hour Timeframe
After breaking the 113,222 zone on the 4-hour chart, Bitcoin started a new upward trend and rallied up to 116,960.
✔️ Yesterday’s interest rate announcement was dovish (a cut) and supportive for Bitcoin, helping it break above the 116,960 high.
📊 Currently, the price has pulled back to this zone and is preparing to start its next main move. If that plays out, the next targets will be around 121,881 and 124,494.
📈 The market has built strong bullish momentum, and the trend can continue. This means we can look for long setups on lower timeframes as soon as triggers activate.
⚡️ As long as price holds above 113,222, I continue to view Bitcoin as being in an uptrend. Therefore, while the price remains above this zone, I won’t be opening any short positions.
❌ Disclaimer ❌
Trading futures is highly risky and dangerous. If you're not an expert, these triggers may not be suitable for you. You should first learn risk and capital management. You can also use the educational content from this channel.
Finally, these triggers reflect my personal opinions on price action, and the market may move completely against this analysis. So, do your own research before opening any position.

LINK / USDT : Showing strong momentum LINK/USDT is showing strong momentum and preparing to break out of a symmetrical triangle.
📌 Entry: $23.60 – $24.38
🎯 Targets: $26 – $28 – $30
⛔ Stop Loss: $22.30
Always manage risk properly and DYOR ✅

TradersCity Pro | LINK Eyes Fresh Rally From Critical Support👋 Welcome to TradeCity Pro!
In this analysis, I’m going to review LINK, one of the RWA coins with a market cap of $16.41 billion, currently ranked 12th.
📅 Daily Timeframe
On the daily chart, after getting support around 11.55, LINK started an upward move and in its first wave rallied up to 26.73.
✔️ After reaching this zone, volume began to decline and a short correction formed down to the 0.236 Fibonacci level.
⭐ This area is also an important support zone that overlaps with a PRZ (Potential Reversal Zone) at the Fibonacci level, meaning the price could start its next bullish wave if it holds this floor.
🔍 If a deeper correction occurs, price could extend down to the 0.382 or 0.5 Fibonacci levels. Naturally, the deeper the correction, the weaker buyers’ strength becomes.
🎲 For long positions, if the price holds these key zones or breaks above 26.73, we can look for entries. The main confirmation of a bullish continuation will be a clean breakout of 26.73.
📝 Final Thoughts
Stay calm, trade wisely, and let's capture the market's best opportunities!
This analysis reflects our opinions and is not financial advice.
Share your thoughts in the comments, and don’t forget to share this analysis with your friends! ❤️

Bitcoin Cycle Analysis – The Fourth TurningThe dominant cycle identified here is ~292 bars, which has consistently marked major pivots in Bitcoin’s price action. Each cycle builds in intensity, and according to fractal theory, the fourth turning often delivers the most severe correction.
At present, BTC is pressing against the upper bounds of this dominant cycle. If the cycle roadmap continues to hold, we are now in the early stages of the declining phase, with downside risk extending into the mid-to-lower support zones.
Key Insight:
In fractal cycle analysis, the fourth turning is often the most devastating one. If this pattern repeats, the coming downswing could be sharper and deeper than previous declines, preparing the ground for the next major cycle low.
Caution is warranted as both fractal and cycle models are flashing warnings that this market may be in the process of topping out.

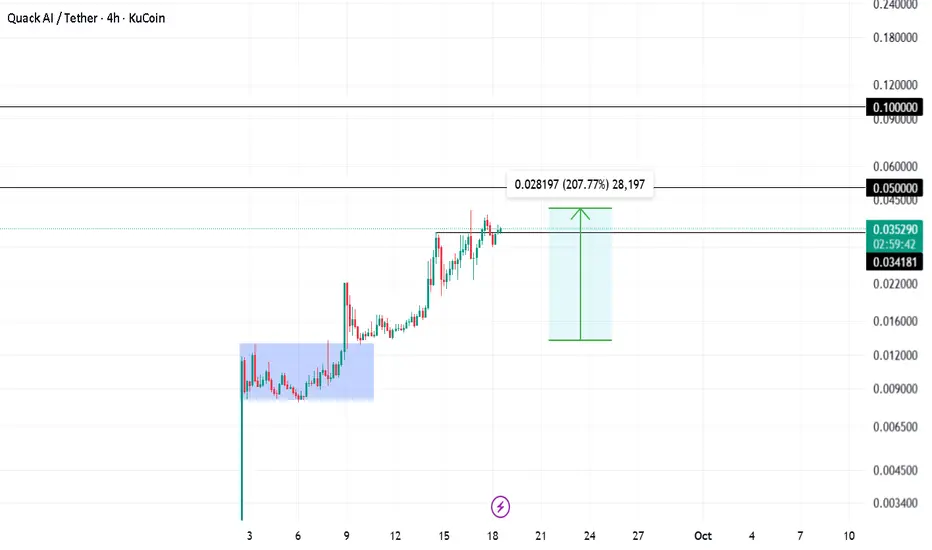
Q Pumped 207% Shared insights on Q trade a while ago. Been holding the trade for a while now and made easy 2x till now.
Hodling for 0.05 and 0.1 targets
Stop loss trailed!
BTCUSD H1 | Bearish reversal at key resistanceBitcoin (BTC/USD) has rejected off the sell entry at 117,876.74, which is an overlap resistance and could drop from this level to the downside.
Stop loss is at 119,057.60, which is an overlap reistance that aligns withthe 161.8% Fibonacci extension.
Take profit is at 115,962.51, which is a pullback support that aligns with the 61.8% Fibonacci retracement.
High Risk Investment Warning
Trading Forex/CFDs on margin carries a high level of risk and may not be suitable for all investors. Leverage can work against you.
Stratos Markets Limited (tradu.com ):
CFDs are complex instruments and come with a high risk of losing money rapidly due to leverage. 65% of retail investor accounts lose money when trading CFDs with this provider. You should consider whether you understand how CFDs work and whether you can afford to take the high risk of losing your money.
Stratos Europe Ltd (tradu.com ):
CFDs are complex instruments and come with a high risk of losing money rapidly due to leverage. 66% of retail investor accounts lose money when trading CFDs with this provider. You should consider whether you understand how CFDs work and whether you can afford to take the high risk of losing your money.
Stratos Global LLC (tradu.com ):
Losses can exceed deposits.
Please be advised that the information presented on TradingView is provided to Tradu (‘Company’, ‘we’) by a third-party provider (‘TFA Global Pte Ltd’). Please be reminded that you are solely responsible for the trading decisions on your account. There is a very high degree of risk involved in trading. Any information and/or content is intended entirely for research, educational and informational purposes only and does not constitute investment or consultation advice or investment strategy. The information is not tailored to the investment needs of any specific person and therefore does not involve a consideration of any of the investment objectives, financial situation or needs of any viewer that may receive it. Kindly also note that past performance is not a reliable indicator of future results. Actual results may differ materially from those anticipated in forward-looking or past performance statements. We assume no liability as to the accuracy or completeness of any of the information and/or content provided herein and the Company cannot be held responsible for any omission, mistake nor for any loss or damage including without limitation to any loss of profit which may arise from reliance on any information supplied by TFA Global Pte Ltd.
The speaker(s) is neither an employee, agent nor representative of Tradu and is therefore acting independently. The opinions given are their own, constitute general market commentary, and do not constitute the opinion or advice of Tradu or any form of personal or investment advice. Tradu neither endorses nor guarantees offerings of third-party speakers, nor is Tradu responsible for the content, veracity or opinions of third-party speakers, presenters or participants.

LTCUSD H4 | Bullish momentum to extendLitecoin (LTC/USD) has bounced off the buy entry which is an overlap support and could potentially rise from this level to the upside.
Buy entry is at 114.09, which is an overlap support level.
Stop loss is at 109.77, which is a pullback support level.
Take profit is at 123.04, which is a swing high resistance.
High Risk Investment Warning
Trading Forex/CFDs on margin carries a high level of risk and may not be suitable for all investors. Leverage can work against you.
Stratos Markets Limited (tradu.com ):
CFDs are complex instruments and come with a high risk of losing money rapidly due to leverage. 65% of retail investor accounts lose money when trading CFDs with this provider. You should consider whether you understand how CFDs work and whether you can afford to take the high risk of losing your money.
Stratos Europe Ltd (tradu.com ):
CFDs are complex instruments and come with a high risk of losing money rapidly due to leverage. 66% of retail investor accounts lose money when trading CFDs with this provider. You should consider whether you understand how CFDs work and whether you can afford to take the high risk of losing your money.
Stratos Global LLC (tradu.com ):
Losses can exceed deposits.
Please be advised that the information presented on TradingView is provided to Tradu (‘Company’, ‘we’) by a third-party provider (‘TFA Global Pte Ltd’). Please be reminded that you are solely responsible for the trading decisions on your account. There is a very high degree of risk involved in trading. Any information and/or content is intended entirely for research, educational and informational purposes only and does not constitute investment or consultation advice or investment strategy. The information is not tailored to the investment needs of any specific person and therefore does not involve a consideration of any of the investment objectives, financial situation or needs of any viewer that may receive it. Kindly also note that past performance is not a reliable indicator of future results. Actual results may differ materially from those anticipated in forward-looking or past performance statements. We assume no liability as to the accuracy or completeness of any of the information and/or content provided herein and the Company cannot be held responsible for any omission, mistake nor for any loss or damage including without limitation to any loss of profit which may arise from reliance on any information supplied by TFA Global Pte Ltd.
The speaker(s) is neither an employee, agent nor representative of Tradu and is therefore acting independently. The opinions given are their own, constitute general market commentary, and do not constitute the opinion or advice of Tradu or any form of personal or investment advice. Tradu neither endorses nor guarantees offerings of third-party speakers, nor is Tradu responsible for the content, veracity or opinions of third-party speakers, presenters or participants.

DOTUSD H4 | Heading into major into major resistanceDOT/USD is rising towards the sell entry which is a pullback resistance that is slightly above the 61.8% Fibonacci projection and the 161.8% Fibonacci extension and could reverse from this level to he downside.
Sell entry is at 4.496, which is a pullback resistance that is slightly above the 61.8% Fibonacci projection and the 161.8% Fibonacci extension.
Stop loss is at 4.794, which is a pullback resistance that is slightly above the 100% Fibonacci projection.
Take profit is at 4.004, whichis an overlap support.
High Risk Investment Warning
Trading Forex/CFDs on margin carries a high level of risk and may not be suitable for all investors. Leverage can work against you.
Stratos Markets Limited (tradu.com/uk ):
CFDs are complex instruments and come with a high risk of losing money rapidly due to leverage. 65% of retail investor accounts lose money when trading CFDs with this provider. You should consider whether you understand how CFDs work and whether you can afford to take the high risk of losing your money.
Stratos Europe Ltd (tradu.com/eu ):
CFDs are complex instruments and come with a high risk of losing money rapidly due to leverage. 66% of retail investor accounts lose money when trading CFDs with this provider. You should consider whether you understand how CFDs work and whether you can afford to take the high risk of losing your money.
Stratos Global LLC (tradu.com/en ):
Losses can exceed deposits.
Please be advised that the information presented on TradingView is provided to Tradu (‘Company’, ‘we’) by a third-party provider (‘TFA Global Pte Ltd’). Please be reminded that you are solely responsible for the trading decisions on your account. There is a very high degree of risk involved in trading. Any information and/or content is intended entirely for research, educational and informational purposes only and does not constitute investment or consultation advice or investment strategy. The information is not tailored to the investment needs of any specific person and therefore does not involve a consideration of any of the investment objectives, financial situation or needs of any viewer that may receive it. Kindly also note that past performance is not a reliable indicator of future results. Actual results may differ materially from those anticipated in forward-looking or past performance statements. We assume no liability as to the accuracy or completeness of any of the information and/or content provided herein and the Company cannot be held responsible for any omission, mistake nor for any loss or damage including without limitation to any loss of profit which may arise from reliance on any information supplied by TFA Global Pte Ltd.
The speaker(s) is neither an employee, agent nor representative of Tradu and is therefore acting independently. The opinions given are their own, constitute general market commentary, and do not constitute the opinion or advice of Tradu or any form of personal or investment advice. Tradu neither endorses nor guarantees offerings of third-party speakers, nor is Tradu responsible for the content, veracity or opinions of third-party speakers, presenters or participants.

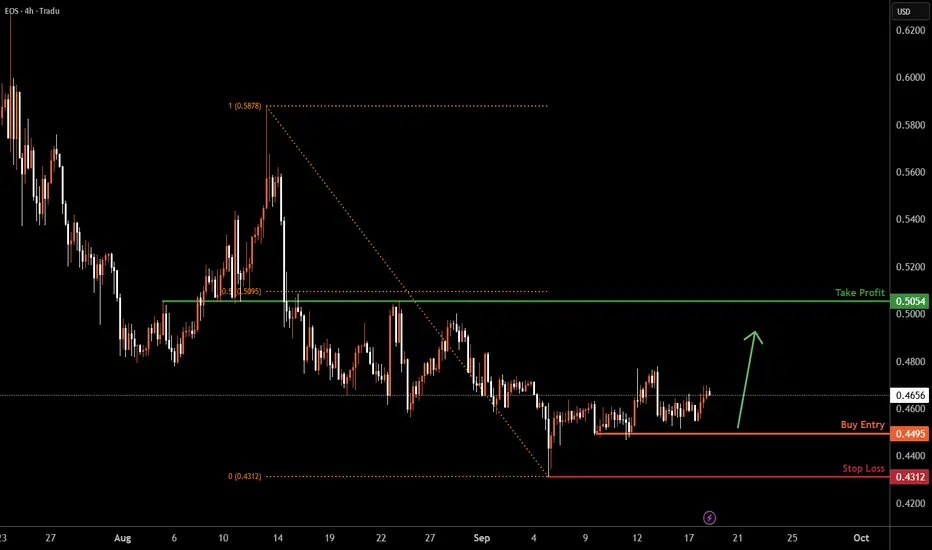
EOSUSD H4 | Bullish reversal at key supportEOS/USD has bounced off the buy entry which is a pullback support and could potentially rise from this level to the upside.
Buy entry is at 0.4495, which is a pullback support.
Stop loss is at 0.4312, which is a pullback support.
Take profit is at 0.5054, which is an overlap resistance that is slightly below the 50% Fibonacci retracement.
High Risk Investment Warning
Trading Forex/CFDs on margin carries a high level of risk and may not be suitable for all investors. Leverage can work against you.
Stratos Markets Limited (tradu.com ):
CFDs are complex instruments and come with a high risk of losing money rapidly due to leverage. 65% of retail investor accounts lose money when trading CFDs with this provider. You should consider whether you understand how CFDs work and whether you can afford to take the high risk of losing your money.
Stratos Europe Ltd (tradu.com ):
CFDs are complex instruments and come with a high risk of losing money rapidly due to leverage. 66% of retail investor accounts lose money when trading CFDs with this provider. You should consider whether you understand how CFDs work and whether you can afford to take the high risk of losing your money.
Stratos Global LLC (tradu.com ):
Losses can exceed deposits.
Please be advised that the information presented on TradingView is provided to Tradu (‘Company’, ‘we’) by a third-party provider (‘TFA Global Pte Ltd’). Please be reminded that you are solely responsible for the trading decisions on your account. There is a very high degree of risk involved in trading. Any information and/or content is intended entirely for research, educational and informational purposes only and does not constitute investment or consultation advice or investment strategy. The information is not tailored to the investment needs of any specific person and therefore does not involve a consideration of any of the investment objectives, financial situation or needs of any viewer that may receive it. Kindly also note that past performance is not a reliable indicator of future results. Actual results may differ materially from those anticipated in forward-looking or past performance statements. We assume no liability as to the accuracy or completeness of any of the information and/or content provided herein and the Company cannot be held responsible for any omission, mistake nor for any loss or damage including without limitation to any loss of profit which may arise from reliance on any information supplied by TFA Global Pte Ltd.
The speaker(s) is neither an employee, agent nor representative of Tradu and is therefore acting independently. The opinions given are their own, constitute general market commentary, and do not constitute the opinion or advice of Tradu or any form of personal or investment advice. Tradu neither endorses nor guarantees offerings of third-party speakers, nor is Tradu responsible for the content, veracity or opinions of third-party speakers, presenters or participants.
SBR/USDI have been building a position in this asset since early 2025. Patience has been necessary but the promise remains. I have been watching this chart closely and we now have a fully formed head and shoulder pattern on the Stochastic RSI on the daily timeframe. The daily candle still needs too close to confirm a breakout above the neckline but things are looking promising. We are also trading below a trend line that acted as support in the past. I believe this move if confirmed would push us above that resistance. Further evaluation would be needed after that. Larger timeframes SBR is beyond ready to run (potentially an inverse head and shoulders forming on weekly stoch rsi). I'm just looking for that spark. Best wishes in your life and ambitions (only the righteous ones).

ATOM to $16With breaking the resistance at 6.20, I think Atom can go to the very strong resistance area between $14 and $18, with the 61% Fibonacci level from top to bottom at $16.60

Bitcoin Under Pressure, Correction or Breakout Ahead ?Regarding the overall trend, BTC is currently in a corrective phase after a strong rally from March to July, and is now facing a key resistance zone between 114,500 – 117,500 USDT.
🔸 The price failed to break the recent high at 117,500.
🔸 A clear supply order block is visible between 116,500 – 117,300 USDT, acting as strong selling pressure.
🔸 There’s also a partial Fair Value Gap (FVG) between 111,000 – 113,000 USDT, which may get retested.
📈 If BTC breaks above 117,500, the likely scenario is a rally toward the major resistance at 124,000 USDT, where a potential Double Top formation may occur with a possible failed second high.
📉 On the other hand, if support at 114,500 is broken, the price could head toward the strong support zone around 110,000 – 107,000 USDT.
💡 Trade Idea (Short-Term):
Entry: Sell from price ~117,500
🎯 TP1: 114,600 (Consider closing 50% here)
🎯 TP2: If 114,600 breaks, hold the remaining position for a move toward 110,000
SL: Daily close above 117,500 (If this happens, trend flips bullish and a long trade toward 124,000 can be considered).
Please note:
This is not financial advice – I’m only sharing my personal trades.
Always do your own research before taking action.
👍 Don’t forget to like if you found this useful, and feel free to follow me for more analysis of this kind.
Best of luck 🌹

ANFIBO | BTCUSD in my view todayHello guys! It's me, Anfibo.
Here is my Strategic and Market Sentiment Perspective :
I agree with the view that BITSTAMP:BTCUSD is currently in a compression phase. The market seems to be waiting for a catalyst (potentially economic data or macro news) to break out of this consolidation zone.
>>> Key observations:
Trading volume has shown signs of decline over the past few sessions, reflecting investor sentiment of waiting on the sidelines rather than taking strong action.
Funding rates and overall market sentiment remain positive but not overly euphoric, which is a healthy signal supporting the case for a sustainable upward move.
On the Daily timeframe, the primary trend remains bullish, and the current sideways movement appears to be a technical correction within the broader uptrend.
>>> Strategic approach for today:
> For short-term traders: consider accumulating small positions around the support levels of 115,200 – 114,400, with stop-loss orders set below 114,000 to manage downside risk.
> For medium-term investors: it is more prudent to wait for a confirmed breakout above the 117,000 – 118,000 resistance zone before scaling into larger positions, targeting the 120,000 – 123,000 levels.
Have a beautiful day!

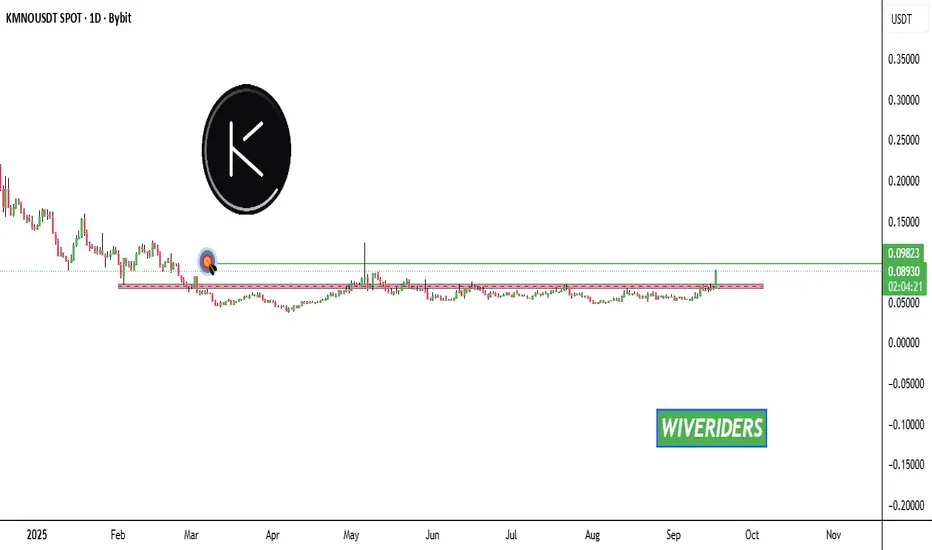
KMNO Market Update (Daily Timeframe)📊 CRYPTOCAP:KMNO Market Update (Daily Timeframe)
CRYPTOCAP:KMNO has finally broken out of the red resistance zone 🔴✅
👉 First target now set at the green line level 🎯
EGLD has formed a bullish double bottom📊 CRYPTOCAP:EGLD Market Update
CRYPTOCAP:EGLD has formed a bullish double bottom 📈
👉 If it breaks out the red resistance zone 🔴, the first target will be the green line level 🎯
