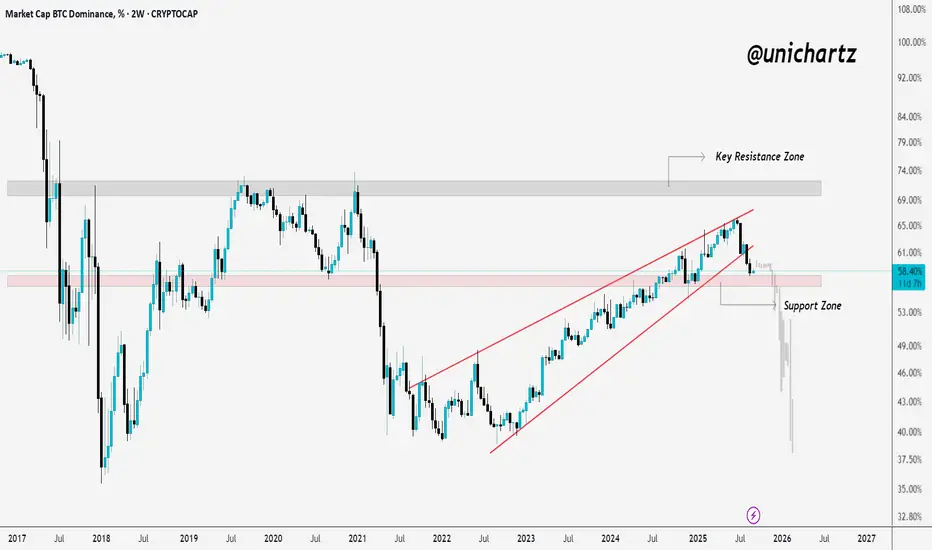
Altcoin Momentum Building as BTC.D SlipsBTC.D is hovering around 58.3% after breaking down from the rising wedge structure, rejecting sharply from the 66% resistance zone.
Price is now retesting the 57%–58% support zone. A breakdown could drive dominance into the mid-50% range, signaling stronger altcoin momentum.
If support holds, expect a short-term bounce before the next move.
DYOR, NFA
#PEACE
Cryptomarket
Ethereum - Eyes 5,600–5,800 After Holding Strong Near HighsEthereum (ETHUSD) remains in a clear uptrend, consolidating just beneath its all-time highs. After printing a record high in recent weeks, ETH has shown strength by holding its gains—a typical behavior in a trending market.
🔍 Technical Breakdown:
Trend: Bullish structure intact with higher-highs and higher-lows.
Price Action: ETH is coiling within a key resistance zone (4800–5000)—often a precursor to a breakout.
Momentum: One of the top-performing assets since the April 7 market low.
📈 Targets:
Short-term: 5,600–5,800 zone is the next potential target if the breakout materializes.
Medium-term: Eyes on 7,000, with an extended move to 8,000 still on the table if momentum accelerates.
⚠️ Macro Perspective:
As price moves higher, sentiment and targets naturally expand, fueling further speculative momentum. Caution is warranted—bull markets can persist longer than expected, but parabolic moves often end abruptly.

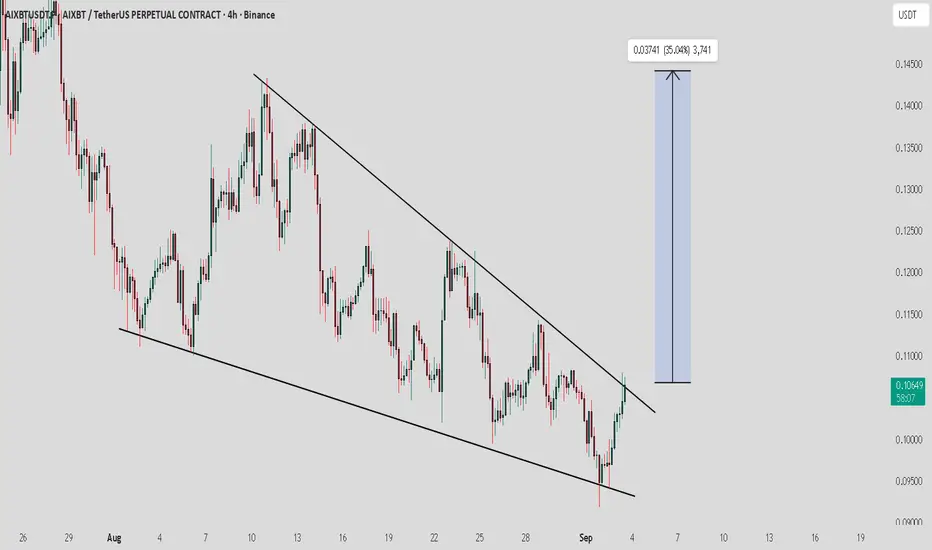
AIXBT / USDT : Attempting breakoutAIXBT/USDT is testing its trendline resistance and attempting a breakout. If this breakout confirms with strong momentum, we could see a rally toward $0.13 – $0.15 soon.
Best approach: Always wait for clear confirmation before entering. Manage risk properly and trade smart.
SNX ; BEARISH!!!Hello friends
Given the growth we had, you can now see that the price ended the trend at the ceiling of a large candle and the sellers covered it with another large candle.
Now we have a resistance area in the middle of this candle from which the price is expected to correct and move to the specified targets.
*Trade safely with us*

TradeCityPro | TON Testing Wedge Breakout Amid Key Support🙏 Welcome to TradeCity Pro!
In this analysis I want to review the TON coin for you. One of the popular crypto coins that with a market cap of 8.09 billion dollars is ranked 22 on CoinMarketCap.
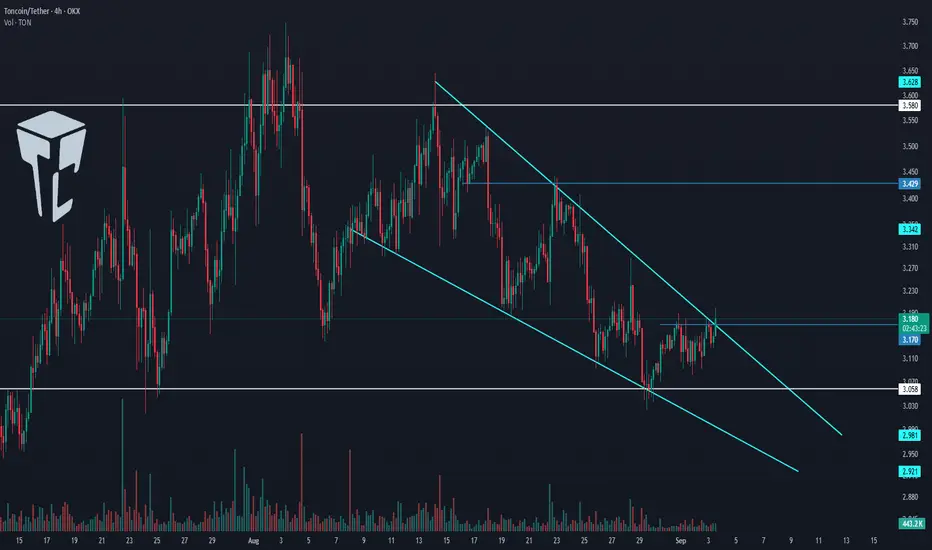
⏳ 4-Hour Timeframe
In the 4-hour timeframe this coin has formed a descending wedge and has reached the support of 3.058.
📊 Currently the price has reached the top of the wedge and if 3.170 is broken its upward movement can begin.
🧩 Considering that the price has reached the end of this wedge the reduction in volume is logical and with the breakout of the wedge whether from above or below a lot of volume will enter the market.
📈 If the wedge is broken from above and the 3.17 trigger is activated I will try to open a long position. Breaking this level can start a new upward leg in higher cycles.
🔔 In case of rejection from the top of the wedge and moving towards the 3.058 support if this level breaks the price can start a downward leg and even break the wedge from below.
📝 Final Thoughts
Stay calm, trade wisely, and let's capture the market's best opportunities!
This analysis reflects our opinions and is not financial advice.
Share your thoughts in the comments, and don’t forget to share this analysis with your friends! ❤️
BCHUSD Surges Past $580 Resistance, Eyes $715 BCHUSD has broken the significant trend line resistance $580 and holds above that level. The pair surged more than 15% in the past three days. It hit a high of $604.75 and is currently trading around $602.33.The overall trend is bullish as long as the support $440 holds.
The pair holds above the short-term (34 and 55-day EMA) and above the long-term moving average (200-day EMA).
The near-term resistance is around $625; any indicative breach above will take the pair to $640/$715. On the lower side, immediate support is $559, and any violation below targets $514/$490.
Indicators (4-hour chart)
CCI(50)- Bullish
Directional movement index - Bullish
It is good to buy on dips around $559 with SL around $500 for TP of $715.

$AIXBT Performing falling wedge pattern Trading strategy
Identify and Confirm: Look for the two converging, downward-sloping trendlines with at least two touches on each. Volume should ideally decrease as the pattern develops.
Wait for Breakout: A bullish signal occurs when the price breaks above the upper trendline.
Confirm Breakout: Confirm the breakout with an increase in trading volume.
Manage Risk: Set a stop-loss order below the lower trendline and a take-profit target by projecting the wedge's widest point upward from the breakout.
Reliability
The falling wedge is considered a reliable bullish pattern with a reported success rate of 74% in bull markets. Its reliability is strengthened by increasing volume upon breakout.

Ethereum bullish in SeptemberEthereum is holding above September's pivot at 4,230 and may reach the second resistance at 5,800 in the coming weeks.

Bearish continuation?Ethereum (ETH/USD) is rising towards the pivot which has been identified as a pullback resistance and could reverse to the 1st support.
Pivot: 4,410.37
1st Support: 4,212.04
1st Resistance: 4,502.93
Risk Warning:
Trading Forex and CFDs carries a high level of risk to your capital and you should only trade with money you can afford to lose. Trading Forex and CFDs may not be suitable for all investors, so please ensure that you fully understand the risks involved and seek independent advice if necessary.
Disclaimer:
The above opinions given constitute general market commentary, and do not constitute the opinion or advice of IC Markets or any form of personal or investment advice.
Any opinions, news, research, analyses, prices, other information, or links to third-party sites contained on this website are provided on an "as-is" basis, are intended only to be informative, is not an advice nor a recommendation, nor research, or a record of our trading prices, or an offer of, or solicitation for a transaction in any financial instrument and thus should not be treated as such. The information provided does not involve any specific investment objectives, financial situation and needs of any specific person who may receive it. Please be aware, that past performance is not a reliable indicator of future performance and/or results. Past Performance or Forward-looking scenarios based upon the reasonable beliefs of the third-party provider are not a guarantee of future performance. Actual results may differ materially from those anticipated in forward-looking or past performance statements. IC Markets makes no representation or warranty and assumes no liability as to the accuracy or completeness of the information provided, nor any loss arising from any investment based on a recommendation, forecast or any information supplied by any third-party.


Current outlook of Bitcoin and future projections!BTCUSD which has been bearish atleast some few days ago, seems to be formulating a sell setup. watch closely.

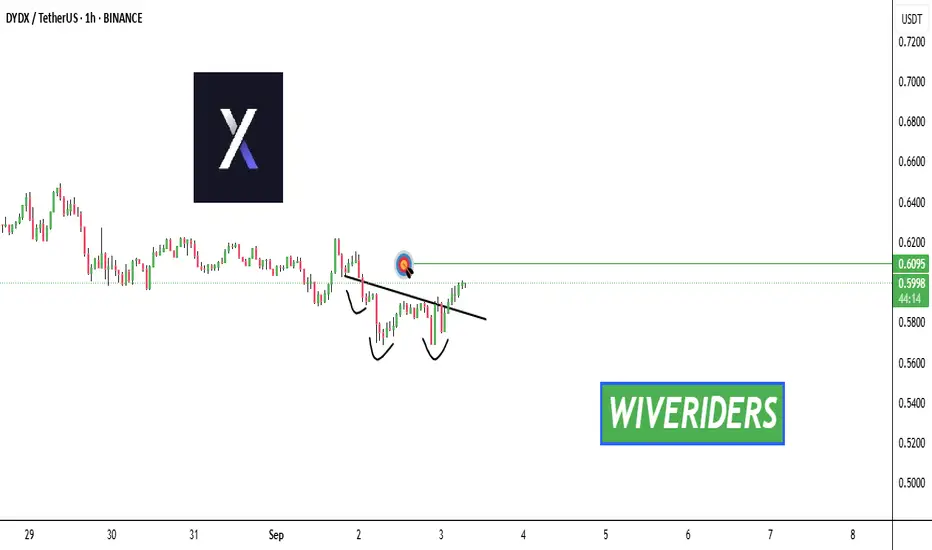
inverted Head & Shoulders pattern🚨 $DYDX Breakout Alert! 🚨
$DYDX has already broken out above the neckline of its inverted Head & Shoulders pattern ✅
👉 The first target is now the green line level 🎯
⚠️ Key point: Watch for retests of the neckline to confirm strength.
👉 This breakout signals bullish continuation with buyers firmly in control 📈
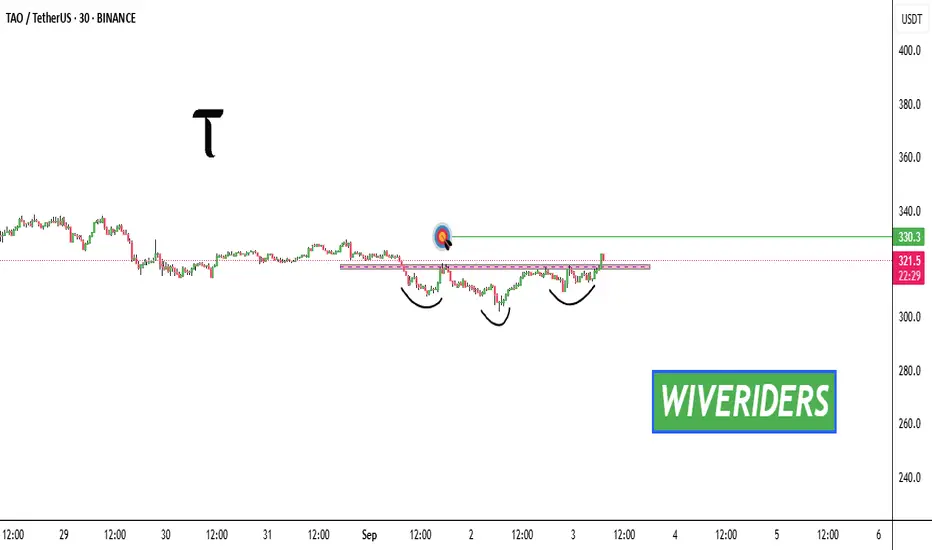
TAO Bullish Pattern Alert!🚨 GETTEX:TAO Bullish Pattern Alert! 🚨
GETTEX:TAO has formed an inverted Head & Shoulders pattern 🟢
👉 If it plays out, the first target will be the green line level 🎯
⚠️ Key point: Pattern confirmation is crucial — wait for breakout above the neckline.
👉 A confirmed move signals strong bullish continuation with buyers taking control ✅
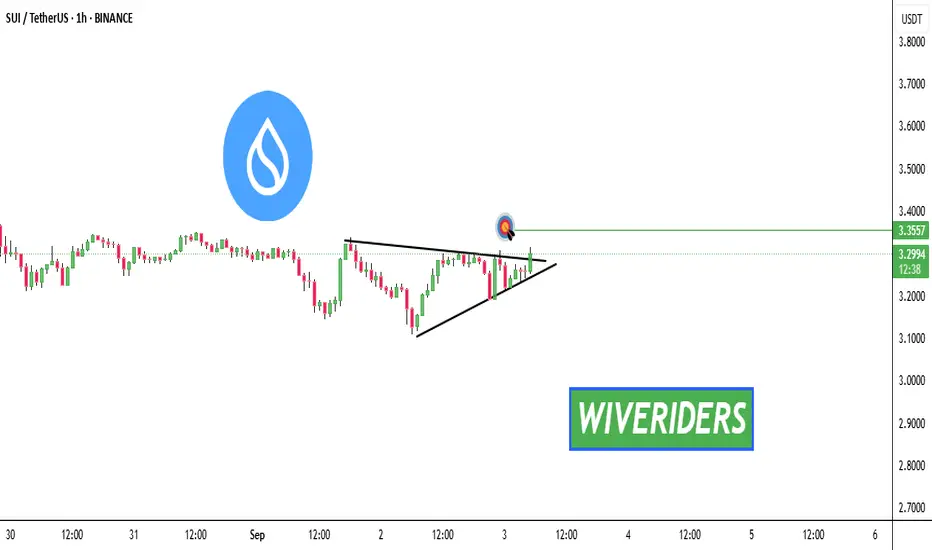
SUI Breakout Alert!🚨 CRYPTOCAP:SUI Breakout Alert! 🚨
CRYPTOCAP:SUI has developed a bullish ascending setup 📈
👉 Price action is pressing against resistance, showing breakout potential.
⚠️ Key point: Stay cautious of fakeouts — confirmation is needed before entry.
👉 If the breakout holds, the first target aligns with the green level 🎯
This move would indicate strong bullish continuation with buyers taking control ✅
96K --- 152K --- 76K
In a bull market Fibonacci extensions usually target the 2.618 level which is around 152,000$.
The target of the 4th internal wave of the 5th wave, which is the last upward wave, is 96,000$.
When the 5th and last upward wave ends, I expect this rising parallel channel to break down and head towards the lower Fibonacci channels.
I think Bitcoin will enter a long-term uptrend again, especially after 70,000$ levels.
* The purpose of my graphic drawings is purely educational.
* What i write here is not an investment advice. Please do your own research before investing in any asset.
* Never take my personal opinions as investment advice, you may lose your money.

Btc looks bearish Bitcoin bears were successful in forming a new lower high during this small time frame down trend. If we do not close above 110k bitcoin will remain bearish.
Next support :- 105k and 100k
