CCUSDT.P: long setup from daily resistance at 0.18270BINANCE:CCUSDT.P has been in a prolonged accumulation phase. Notably, it did not crash to the lows after listing, indicating the asset is liquid and supported.
Yesterday's daily candle closed right at its High, near the resistance level. This is a very strong signal that the trend is likely to continue. Today, we have been consolidating below the level all day, and right now, the price is hugging it closely. The 4H timeframe also closed at its highs.
The probability of a breakout is extremely high.
Cryptomarket

AXSUSDT.P: short setup from 4h support at 2.043BINANCE:AXSUSDT.P has entered a consolidation phase following a strong rally. This range is wide enough to allow for trading inside the structure.
I have identified a local level, relying primarily on the 4H timeframe. The asset has been trading just above this support for an extended period. Recently, there was a tap on the level, and now we are seeing a close retest developing — this is a strong bearish (Short) signal.
Since this is an intra-range trade and not a breakout from the major consolidation channel, we might not see a massive move. However, securing a solid 5R (5 to 1) risk-to-reward ratio is highly feasible.

ENSOUSDT.P: long setup from daily resistance at 1.6399BINANCE:ENSOUSDT.P is in a bullish trend. After a strong rally, it consolidated for a few days. Now, a solid pre-breakout base is forming right under the 1.6399 resistance, which acts as the upper boundary of the trading channel.
I have mixed feelings about the Daily timeframe because the asset has already extended significantly today. However, on the 4H timeframe, we see clear price compression towards the level with decreasing volatility. On the 5m chart, the price tested the level multiple times without a deep rejection or correction, which would be the normal reaction here.
The logic: When we don't see the expected reaction (a pullback), that catches my attention. If an asset rallies hard and still has the strength to hold highs and consolidate right under resistance, it signals a strong buyer.
Conditions: Volatility must not increase before the breakout. The entry must strictly follow the system rules. Given the overextended Daily chart (which is the primary one), I will be extremely cautious with this trade, or might skip it entirely if the setup isn't perfect.

ENSOUSDT: short setup from daily support at 1.2632BINANCE:ENSOUSDT.P is correcting as expected following the pump.
The initial decline halted at the 1.2632 level. The following day, we witnessed a False Breakout relative to this price, which confirms the level's validity (as a False Breakout can only occur relative to a significant level). Essentially, a False Breakout represents the asset's inability to sustain a price below or above a certain point.
What do we see next? weakness. The asset failed to take out yesterday's High. Since we cannot go up, we are now seeing a gradual approach — a slow bleed — back toward our established support at 1.2632.
This gradual approach is clearly visible on the 4H timeframe and signals a strong bearish intent. This is not a panic dump; it is a methodical move where every limit buy order standing in the way is being slowly and confidently absorbed. Such clarity and precision in price action suggest that strong capital is driving this move.
Therefore, the breakdown of this level is simply a matter of time. Disclaimer: This is the crypto market. Anything can happen at any moment, and even the most professional analysis can be invalidated instantly. Always remember this.

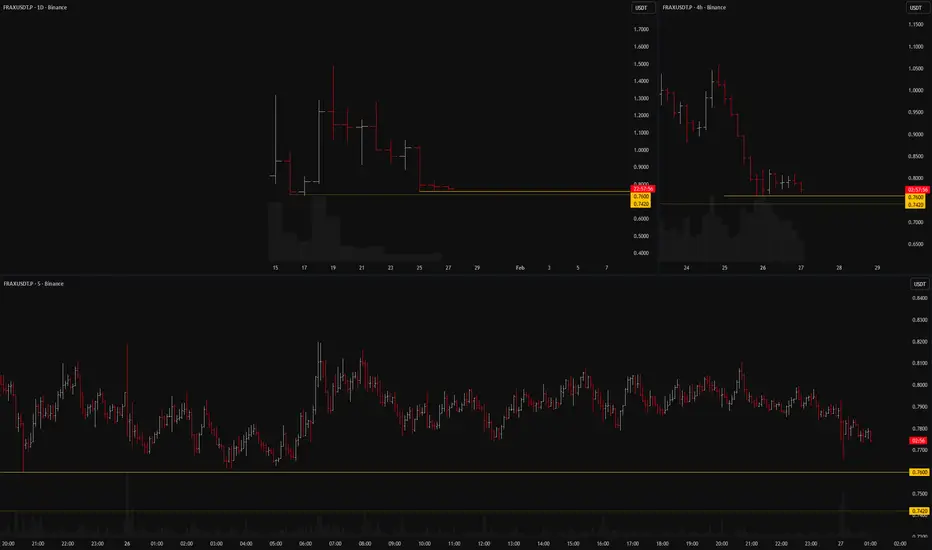
FRAXUSDT: short setup from daily support at 0.76BINANCE:FRAXUSDT.P is confidently approaching its all-time lows.
Right now, the price is consolidating above the 0.76 level, positioning itself, in my view, for further downside. What caught my attention is the massive drop on Jan 25, followed by the asset simply "hanging" just above the support with minimal volatility. Normally, volatility decreases gradually. Here, we saw a ~25% crash, and the very next day, volatility dropped by a factor of 3.5. This is abnormal.
Two negative factors:
High volatility on the working timeframe (5m).
Immediately below 0.76 lies the historical low (ATL) of 0.742, which could act as an obstacle to a free fall.
My Plan:
Given these factors, I am waiting for the character of the movement to change. Before the breakout, a clean entry point must form on low volatility. I need to see abnormal calmness for this asset — no large, erratic bars.
Looking at the 4H timeframe, observing how cleanly the asset is consolidating and how many times it has hit the 0.76 support, I would still look to initiate a Short from this level.
DEXT has some bullishInverted Head & Shoulders forming on the daily/weekly chart — textbook reversal pattern after months of accumulation.
Left shoulder: Early 2025 lows
Head: Mid-2025 bottom
Right shoulder: Recent retest with higher low
Neckline: ~$0.20–$0.22 resistance (recent highs and Fib 0.236 level)
Breakout above neckline on strong volume confirms the pattern → measured move targets $0.60–$0.80 initially (projecting from head to neckline height).
Bull flag/continuation patterns spotted on lower timeframes post-recent bounce from $0.13 support.
RSI oversold bounce + bullish divergence on weekly → momentum shifting hard.

Bitcoin and Ethereum Likely To Move Up Before More DownTrading Fam,
Both BTC and ETH have broken major support levels to the downside. We are likely to see price move up to retest this previous support (now resistance) before further price movement to the downside resumes.
Take care.
✌️Stew

Bitcoin's next pathBitcoin dropped four months in a row. Therefore it is in bear market and will test the trendline in coming months after some upwards correction. While testing the trendline it can do false breakout to between $40 000 and $50 000 level.

ZEC USDT Spot trade | 2000% or ATH Potential in 2025 Bull MarketZEC/USDT is showing potential for a 2000% rally or reaching its ATH in the 2025 bull market. Zcash, known for its strong privacy features, could see a boost in demand as market conditions turn bullish. Technically, watch for ZEC breaking key resistance levels and holding above long-term support zones for confirmation of the trend reversal. 📈 #ZEC #Crypto #ATH"
Buy in dip and hold in spot

Bitcoin (CME) - GAP that needs to be filledWe just got a gap on the CME. Making it very likely we will go up from here and form a bottom on Bitcoin.

Bitcoin/Gold RatioBitcoin looks strong here with a weekly candle close above the resistance line making it a new support level on weekly timeframe. Expecting Bitcoin to grab some of Gold marketshare from here.

DXY (USD Basket) - Breakdown (Confirmation candle in progress)Expecting DXY to confirm the downtrend. We need a weekly candle close below the white trendline, which would mark a break of the trend that’s been intact since 2008. I expect this to be bullish for Bitcoin. Gold and silver have too much downside risk from here, in my opinion, while BTC/XAU looks more promising from a Risk/Reward perspective.

Bitcoin pull backBitcoin is on a very strong and important support about 72k and IMO we are going to see a strong bounce to 100k area one more time

XAUUSD Liquidity Grab Before Major Drop?Gold (XAUUSD) on the 30-min chart shows a clear liquidity sweep above recent highs followed by strong rejection. Price tapped into a supply zone, created a fake bullish move, and now shows signs of bearish structure forming.
The marked zone highlights institutional supply where smart money likely distributed positions. After the stop hunt, price is expected to rotate lower toward the imbalance / demand area below.
🔹 Liquidity taken above highs
🔹 Rejection from supply zone
🔹 Bearish market structure shift
🔹 Targeting lower imbalance zone
If price fails to hold above the zone, this could trigger a strong bearish continuation move.
Plan:
Sell from the supply zone after confirmation.
Target the lower imbalance area.
Maintain proper risk management.

Bitcoin Is in the Wave 3 of the Bear CycleBitcoin Bear Market Comparison (2021–2022 vs 2025–2026)
Based on structural similarity with the 2021–2022 bear market, Bitcoin in 2026 is most likely positioned in Wave 3-3 of the Elliott Wave bear cycle.
After the cycle top, Bitcoin completed:
• Wave 1: Initial breakdown
• Wave 2: Bear market rally within a rising corrective channel
That channel has now failed, marking the start of Wave 3, the main bear market leg.
Wave 3-3 is typically the most aggressive phase:
• Fast downside acceleration
• Rising volatility and volume
• Rapid failure of support levels
This suggests the market is not at the bottom. Historically, the true bear market low forms only after Wave 5, not during Wave 3.
Any near-term rebound should be viewed as a counter-trend bounce, not a trend reversal.

TRBUSDT at support? Focus on 15-16 #TRBUSDT well guys market just reached at current supporting region around 15-16
Keep close and sustain above means that is our current bottom ..
NOTE: we will go for cut n reverse below 15 on confirmation .
Good luck
Trade wisely

Crypto Not Dead Yet- The crypto market is facing strong suppression. It’s still young and relatively small. I’m not a market maker or an insider, but the direction they’re pushing toward is hard to ignore and they’ll keep pressing this market down until you give up, and this time they make it harder.
- Anyone who witnessed 2018 and 2021 bullruns understands how quickly sentiment can flip. In crypto, x50 or x100 moves can unfold in a matter of few months. This market has never failed to see another sunrise.
- Forget all the noise. Only one thing matters on this chart : MACD is on the verge of a bullish cross ( see the green circle). Also note that altcoin dominance didn’t fall, it actually rose during the BTC crash.
- As a trader, my focus has always been long-term guidance to help peoples. Sometimes i was right and sometimes i was wrong, that’s the nature of trading.
Remember Opportunities are forged in blood, not chased in Euphoria.
No matter the choice you make, I wish you the best of luck !
Happy Tr4Ding !

XAUUSD (Gold) – Bearish Continuation After Channel BreakdownGold previously respected a well-defined ascending channel, showing a strong bullish trend. However, price broke decisively below the channel, signaling a trend shift from bullish to bearish. The breakdown was followed by strong bearish momentum, confirming seller dominance.
Key Technical Zones
Broken Support → Resistance:
The marked red zones are former support areas that have now turned into supply / resistance.
Rejection Confirmation:
Price retested these zones and faced strong bearish rejection, validating them as sell areas.
Trade Idea
Bias: Bearish
Entry Zone: Sell on pullback into resistance (around 4,980 – 5,100)
Target 1: Previous demand zone (Target 1)
Target 2: Lower support / continuation target (Target 2)
Stop Loss: Below the invalidation level (around 4,726)
Confluence Factors
Ascending channel breakdown
Lower highs and lower lows forming
Strong bearish impulse after retest
Clear risk-to-reward structure
Conclusion
As long as price remains below the broken channel and resistance zones, the bearish scenario remains valid. Any retracement into resistance may offer high-probability sell opportunities targeting lower liquidity zones.

BTC at a Key HTF Decision Zone — Continuation vs ReclaimBitcoin is currently trading right at the major daily breakdown level around 78,000–79,000 after the sharp sell-off from the 84k–88k region.
This area represents a make-or-break zone where the market is likely to resolve the next directional move.
From a higher-timeframe perspective, the structure still leans bearish, but price is now sitting at a level where both continuation and a counter-trend recovery remain possible, depending on acceptance.
Scenario 1 – Bearish Continuation (currently favored by structure)
The breakdown from the larger descending structure is treated as valid and accepted.
Price fails to reclaim the 78–79k zone and continues to trade below it.
What would confirm this path:
Daily closes below 78,000–78,500
Weak bounces with declining volume
No strong bullish reversal candle on the daily timeframe
Failure to reclaim 79,500–80,000 on retests
Downside levels to watch:
74,460 – 74,400 → first major support (prior daily low / HTF reaction zone)
58,800 – 58,900 → key historical demand & psychological level
52,500 – 52,700 → extended downside target if broader risk-off continues
In this scenario, any bounce into resistance is treated as corrective, not trend-changing.
Scenario 2 – Reclaim & Relief Recovery (counter-trend, conditional)
Price successfully reclaims the 78–79k breakdown level and shows acceptance above it.
This would invalidate immediate downside momentum and open the door for a short-term recovery.
What needs to happen for this scenario:
Strong daily reclaim and close above 79,500–80,000
Follow-through buying volume
Formation of a clear higher low at current levels
Momentum stabilizing or showing bullish divergence
Upside levels in case of a reclaim:
84,000 – 88,000 → prior resistance / recovery target
92,000 – 96,000 → higher-timeframe consolidation zone
100k+ → only relevant if structure fully flips (not the base case)
A single wick or brief reclaim is not enough — price must accept and hold above resistance to shift the bias.
Final Thoughts
At the moment, the bearish continuation toward 74.4k remains the more probable path based on structure and momentum.
However, 78–79k is the line in the sand. A high-volume reclaim of this zone would quickly change the short-term outlook and force a reassessment.
Until then, patience and confirmation remain key.

Bitcoin Monthly Candle Color Closes since 2014 I have had to rewrite this post this morning after the Bears closed in yesterday and destroyed any hope of a Green January close.
January closed RED and Bear Market confirmed.
I think we should consider the only other occasions where we had 4 or more Red months in a Row.
Only 3 times and each was in a deep Bear, after an ATH, early in Bitcoin history.
These are marked with Arrows and all are different from each other and this one is also a unique set. however, if we look at some other Charts, we can see that we maybe repeating the post 2021 Nov ATH. That was 3 Red and then a Green and we did nealry get this.
As a result, I am still watching the 236 cycle Fib Retrace line. which PA bounced off last night.
CHART
We hit that line in a similar time period in eaely 2022. On that Occasion we fell right through it and on this occasion, the bounce has signalled a potential Green Feb, if the Bulls are ready to step in.
But as we fully understand, this bounce may not hold...we will have to wait and see.
We have a high probability of a Green Feb. Previously, 10 Green to 4 Red Monthly closes.
Of the previous 3 occasions of 4 Red Monthly closes in a Row, 2 had a Green Candle as the 5th.
And in the post Nov 2021 ATH draw down, Feb 2022 also closed Green
The Febuary Candle will let us know nore.
Should Febuary close Green
We would then , if we Follow previous cycles and patterns, have a High probability of a RED March, But also remember that March 2022 was also Green.
And looking back at previous Multi Red candles and then a Green, the Green is a Pause in the Down trend.
Should Febuary Close RED
EVERY RED Feb close has been followed by a RED March.
Simple as that.
The ONLY occasion we had a long run of Red candles was in Q3 and Q4 of 2018 and Jan 2019. the 3rd Arrow.
I think the only way we can repaet that is to see Stratagy or similar Large Corporations begin to Capitulate their holdings or to see a similar Collapse in Finance as we saw in 2008....and this IS possible.
So, we wait to see what Frbuary brings....I am Buying the Dip with the understanding we may go lower but I doubt is will be a lot lowerl
Foe me, we are past the Half way line of the Drop now....Bearer the Floor than the last ATH.
But we are in uncertain times and CAUTION is upmost priority

BULLA Update📊 BULLA Update
After the green accumulation zone,
price moved strongly to the upside 📈.
We then had a red resistance zone 🔴,
which has now been broken out ✅.
If you’re still in $BULLA,
it’s a good time to take some profit 💰
and move 50% stop loss to the new higher low to lock gains.
Trade management phase,
protect profits.

USDT.D at HTF Resistance — 4H Execution, Daily Bias in ContextContext
This analysis is based on the 4H chart shown. The Daily chart is not displayed, but the higher-timeframe bias is inferred from structure and location. USDT Dominance (USDT.D) is currently trading at a key HTF resistance zone, acting as a major decision point for overall crypto risk.
Higher-Timeframe Bias (Daily – Not Shown)
From a Daily perspective, USDT.D is extended into a historically sensitive resistance area.
This zone typically represents peaks in risk-off behavior rather than continuation points.
Unless Daily acceptance occurs above this zone, my macro bias remains for a pullback in dominance.
A Daily pullback in USDT.D supports sustained risk-on conditions across BTC and Altcoins.
Execution Timeframe (4H – Chart Shown)
Key HTF resistance / supply zone: 7.16% – 7.23% .
This area is treated as a rejection-or-acceptance zone, not an entry by itself.
First downside reaction / demand zone: 6.70% – 6.76% .
If this zone fails with acceptance, lower HTF magnets come into play.
Primary Scenario — Rejection from HTF Supply (Risk-On)
4H rejection from the 7.16–7.23% supply zone.
Bearish displacement away from the zone, ideally leaving imbalance / FVG.
Price should not immediately reclaim the supply; acceptance back inside invalidates weakness.
Expectation: continuation toward the green demand zone first, then potentially lower HTF levels.
Market implication: declining USDT.D = capital rotating from stables into crypto (bullish for BTC/ALTS).
Invalidation / Alternative Scenario — Acceptance Above Supply (Risk-Off)
4H candle closes and holds above 7.23% .
Successful retest of the zone as support confirms acceptance.
This opens the path for further dominance expansion.
Market implication: sustained risk-off conditions; crypto upside becomes limited or corrective.
Notes
USDT.D is used strictly as a macro risk filter, not a standalone trade signal.
Best conditions occur when BTC and Altcoin structures confirm the same directional bias.
As always, acceptance vs rejection is more important than wicks or single candles.

Bitcoin - Weekly OutlookHistory equals wisdom and knowledge right? This chart shows every cycle top is the next cycles bottom. We are very close to that bottom as we speak. There is no longer any profits to make by selling and hoping for it to go lower. I believe this is THE moment to be a buyer for the medium to longterm. It is possible we will go sideways for a while but I think the upside is a more likely outcome after this weekly candle close IF it succeeds in closing above the 64 k.
