“BTC/USD: Structure Shift From Accumulation to Expansion”Market Structure
Overall structure:
After a sharp sell-off from the prior highs (left side), Bitcoin has transitioned into a range / accumulation phase, then recently broke upward from consolidation.
The series of higher lows marked by the black arrows suggests bullish structure building since late December.
2. Key Zones
🔴 Resistance Zone (≈ 100k – 104k)
This is a major supply zone where price was aggressively rejected before.
Strong selling pressure previously entered here → expect:
First test = rejection likely
Multiple tests = higher chance of breakout
The dotted mid-line inside the zone is a reaction level, not a clean breakout area.
🟡 Support Zone (≈ 88k – 90k)
Former resistance → now acting as support (role reversal).
Price recently:
Broke above it
Pulled back
Held → bullish confirmation
This zone is critical for maintaining the bullish bias.
3. Current Price Action
Price pushed impulsively to ~96–97k (strong bullish momentum).
The purple path suggests a healthy pullback:
This would likely be a bullish retracement, not weakness.
As long as price holds above the support zone, the trend remains intact.
4. Likely Scenarios
✅ Bullish Continuation (Higher Probability)
Pullback into 90k–92k
Buyers step in (bullish candle / volume)
Push toward 100k+
Possible:
First rejection
Then consolidation
Break into resistance zone
📈 Target: 100k – 104k
⚠️ Bearish / Invalid Scenario
Clean 4H close below ~88k
Would indicate:
Failed breakout
Return to range
That could open downside toward 85k–82k
5. Momentum & Volatility Insight
The smooth blue curves indicate volatility compression → expansion.
Expansion happened upward → bias remains bullish until structure breaks.
Sharp moves followed by shallow pullbacks = trend strength, not exhaustion (yet).
6. Trading Takeaway (Not Financial Advice)
Bias: Bullish while above support
Best risk area: Support retest (90k zone)
Worst place to enter: Mid-range (95k–97k)
Key decision point: Reaction at 100k resistance
Cryptomarketcap

MARKETS week ahead: January 11 – 17Last week in the news
U.S. jobs market data was in the spotlight of markets during the previous week. A mixed data pushed the US equity market toward the higher grounds, where the S & P 500 reached the first all time highest level at the start of the year, at 6.978. The price of gold also reacted to a possibility that the Fed might cut interest rates after relatively weak jobs data, where the price tested once again the $4,5K level. U.S. 10Y Treasury yields are still holding ground around the 4,2%. The crypto market had a short liquidity inflow, however, modestly retraced at the end of the week. BTC is finishing the week around $90K.
Last week, U.S. market attention centred on labour data. November JOLTS job openings came in at 7.146 million, below the expected 7.6 million. December Non-farm payrolls rose by 50K, slightly under the 60K forecast, while the unemployment rate declined to 4.4%, down 0.1 percentage point from November’s 4.5%. Average hourly earnings increased 0.3% m/m and 3.8% y/y. The preliminary University of Michigan consumer sentiment for January was 54.0, modestly above the estimate of 53.5, with inflation expectations unchanged at 4.2%. The relatively weak jobs data increased market expectations that the Fed might further cut interest rates.
The arrest of the Venezuelan president Maduro by the U.S. was one of the main topics in the news during the previous week. Oil companies were the ones which significantly gained on the market. President Trump hosted top U.S. oil industry leaders at the White House to press for large-scale private investment in Venezuela's struggling oil sector. He urged companies to commit up to $100B to rebuild the country's dilapidated energy infrastructure. Chevron, which already operates in Venezuela, indicated plans to expand production, but other major companies like ExxonMobil and ConocoPhillips expressed interest without marks of specific commitments.
News is reporting that soaring demand from AI data centres for high-bandwidth memory and related advanced chips is stretching industry capacity, leading to shortages and driving higher prices across DRAM and HBM segments as manufacturers prioritize AI-oriented production. This shift is affecting traditional memory supply for consumer and enterprise devices. Memory makers like Micron, Samsung and SK Hynix are reallocating production toward lucrative AI memory, with Micron's stock showing volatility amid the tightening supply backdrop.
President Trump has called for a temporary cap on U.S. credit card interest rates at 10% for one year, beginning January 20th, framing it as a measure to protect consumers from high borrowing costs. He made the announcement on social media, but gave no details on how the cap would be implemented or enforced, and the plan would likely require congressional approval to take effect. The proposal has drawn pushback from banks and financial industry grounds, who warn it could limit access to credit, while critics argue it cannot be enforced without legislation.
SoftBank Group and OpenAI are jointly investing a total of $1B in SB Energy to accelerate the build-out of AI data centres and power infrastructure in the US. As part of the deal, OpenAI has also selected SB Energy to construct and operate a 1,2 gigawatt data centre in Milam County, Texas, a key site in the broader drive to meet surging AI compute and energy demand.
CRYPTO MARKET
During the previous week the crypto market was in a liquidity-on - liquidity-off mode. Although the first half of the week was positive, still the second half brought some withdrawal of funds from this market. Although general sentiment for crypto coins remains positive from the start of this year, still some setbacks are possible, until investors decide to move part of their funds into risky assets. BTC continues to hold the $90K grounds, driving the market cap to the higher grounds. Total crypto market capitalization during the week was increased by 0,5%, where only $16B was added. Daily trading volumes were only modestly increased to the level of $139B on a daily basis, from $120B traded the week before.
Although BTC had a modest weekly push toward the $95K, still the coin is ending the week relatively flat compared to the previous week, where only $8B was added to market cap. Relatively the same could be noted for the performance of ETH, who lost some modest 0,6% for the week. The best weekly performer in relative terms was POL (previous MATIC) with a weekly increase in value of incredible 60,5%. It is still not officially published what stands behind such a strong move, however, Polygon CEO announced that he will share the major development on Tuesday, January 13th. On the opposite side were ZCASH and DASH, where ZEC dropped by 26% for the week, while DASH lost 13,3%. BNB and Solana were modest gainers with an increase in value of more than 3%. Other altcoins were also traded in a mixed manner.
Increased activity with circulating coins continues. This week, IOTA increased its number of coins on the market by 0,5%, while Uniswaps coins surged by 0,8%. Solana increased its number of coins by 0,2%, the same as Filecoin. The majority of other altcoins had an increase of circulating coins by 0,1%.
Crypto futures market
The crypto futures market showed mixed performance over the week, with Bitcoin futures edging slightly higher while Ether futures moved lower across the curve. The divergence reflects a more selective market environment, as participants reassessed positioning following last week’s rebound.
Bitcoin futures posted modest gains of 0.13% to 0.43% w/w. The advance was more pronounced in the longer-dated maturities, with futures from September 2026 through December 2027 rising around 0.42%–0.43%. Front-end maturities saw only marginal increases, indicating limited short-term conviction. Overall, the curve maintained its upward slope, suggesting stable longer-term expectations despite subdued near-term momentum.
Ether futures declined across all maturities, posting losses between –1.61% and –2.06%. Weakness was concentrated in the front and mid sections of the curve, while longer-dated maturities showed slightly smaller declines. The pullback followed last week’s strong gains and points to a period of consolidation, with ETH futures giving back part of their recent advance.
Overall, futures markets continue to reflect cautious positioning, as participants await clearer catalysts before committing to more decisive trades.

Altcoins Market ETA- So this graphic show only Cryptos and when i speak only Cryptos, it means " No BTC, No ETH, Not Stablecoins ", Only Altcoins !
- This post is not a price prediction, not a FUD, and not a FOMO, it's just my own opinion based on facts.
- Without BTC/ETH and Stables, the crypto market barely reaches $580B MC, a nutshell in the ocean of global finance. Cryptos have already been rejected four times around the $900B MC.
----------------------------------------------------------
- In 2021 we had DeFi.
- In 2022 we had L1/L2 wars.
- In 2023 we had AI.
- In 2024 we had memecoins.
But 2025 has no new narrative.
----------------------------------------------------------
Cycles always go like :
BTC → ETH → Large caps → Mid caps → Micro caps
but this time :
- There's too many new tokens, too many VCs and early insiders droping on retails.
- Altcoins are falling due to a lack of liquidity, no compelling narrative, and absent buyers, while market makers focus on protecting themselves with BTC and stablecoins. ( Dyor on what happened on 10th October 2025 ).
- Right now, most people are holding their breath, waiting for the Fed to launch the next round of QE and another rate cut.
- Money makes Money, the world is working like that.
- My advice for now: be patient. If you already hold crypto and believe in your projects, just HODL. If you’re new to crypto, stay on the sidelines and wait until the market surpasses $1 trillion.
- Comments are welcome but stay sharp and thoughtful.
Be Safe!
Happy Tr4Ding !

ATOM - +21% Weekly Rally at $1.16B | Tokenomics Redesign
Executive Summary
Cosmos (ATOM) market cap trading at $1.16B after a massive +21.17% weekly rally on the 4H timeframe. Price surged from $880M support to test $1.18B resistance. Major catalysts ahead: tokenomics redesign (Q1 2026), Solana/Ethereum L2 IBC integrations, and THORChain cross-chain swaps live. Strong momentum but approaching resistance.
BIAS: BULLISH - Strong Momentum, Watch Resistance
Current Market Data
Current: $1.16B (+0.33%)
Day's Range: $1.14B - $1.16B
52-Week: $803.29M - $2.8B
Volume: 63.52M (above 30D avg of 53.47M)
Performance:
1W: +21.17% | 1M: +7.14% | 3M: -39.69%
6M: -31.52% | YTD: +23.37% | 1Y: -59.76%
Key Catalysts
Tokenomics Redesign (Q1 2026) - Lower inflation, fee capture from appchains
IBC Integrations - Solana and Ethereum L2s connectivity coming
THORChain Cross-Chain Swaps - Native ATOM swaps live (no bridges)
CometBFT Upgrades - Targeting 10k+ TPS for enterprise
Enterprise Blockchain Fleet Manager - SWIFT, SMBC adoption potential
Stablecoin Surge - Cosmos Labs predicts new issuers in 2026
Technical Structure - 4H
Strong Uptrend:
Clean rally from $880M to $1.16B
Higher highs and higher lows
Now testing upper resistance at $1.18B
Volume above average - confirms momentum
Key Levels (Market Cap):
Resistance:
$1.16B - $1.18B - Current resistance zone
$1.20B - Psychological resistance
$1.40B+ - Extended bullish target
Support:
$1.10B - Immediate support
$1.00B - Psychological support
$880M - Major support (red line at bottom)
SCENARIO ANALYSIS
BULLISH: Breakout Above $1.18B
Trigger: Close above $1.18B with volume
Targets: $1.20B → $1.40B → $1.60B
Catalyst: Tokenomics redesign approval, IBC integrations
BEARISH: Rejection at Resistance
Rejection at $1.18B resistance
Pullback to $1.00B-$1.10B support
Healthy consolidation before next leg
My Assessment
Strong +21% weekly rally with volume confirmation. Approaching resistance at $1.18B. Major catalysts ahead: tokenomics redesign to lower inflation and capture fees, IBC integrations with Solana/ETH L2s, and enterprise adoption push. Bullish structure intact - watch for breakout or pullback to support.
Strategy:
Long on breakout above $1.18B → Target $1.20B, $1.40B
Or buy pullback to $1.00B-$1.10B support
Stop below $880M major support
Tell me your thoughts below!

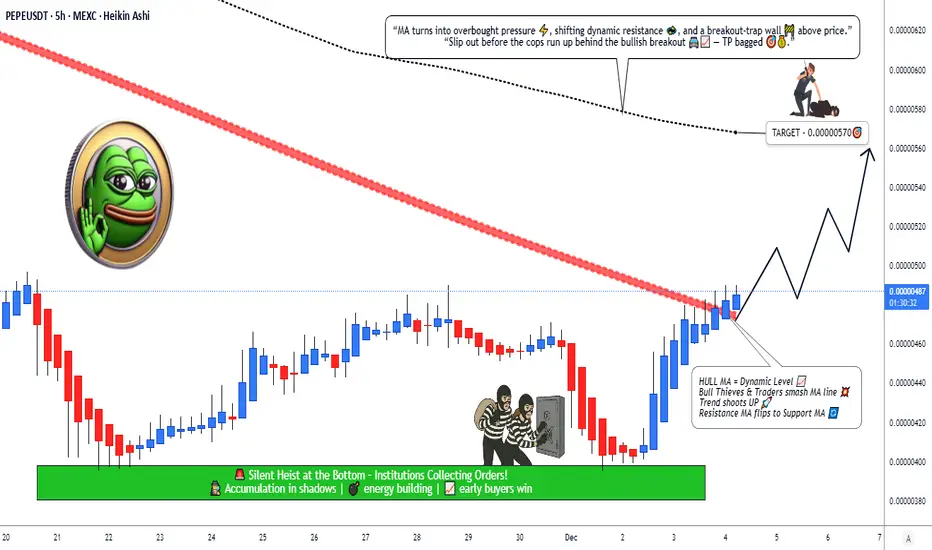
PEPE/USDT Trend Shift? Hull MA Break Signals Possible Upside🔥 PEPE/USDT – Hull Breakout Bullish Blueprint | Swing Trade Masterplan 🐸🚀
Asset: PEPE/USDT — “PEPE vs Tether”
Crypto Market Opportunity Blueprint (Swing Trade)
📈 PLAN — Bullish Plan confirmed with Hull Moving Average Breakout 💚⚡
Entry: YOU CAN ENTRY ANY PRICE LEVEL
Stop Loss: This is thief SL @ 0.00000440
Dear Ladies & Gentleman (Thief OG's) Adjust your SL based on your startergy & own risk.
PLACE SL AFTER THE BREAKOUT CONFIRMATION ONLY.
Note: Dear Ladies & Gentleman (Thief OG's) iam not recommended to set only my SL. its your own choice you can make money then take money at your own risk.
🎯 TARGET — Following SMA Resistance + Overbought Zone + Trap Alert ⚠️🔰
Simple Moving Average act as a strong resistance + overbought + trap is there
→ OUR target @ 0.00000570
Note: Dear Ladies & Gentleman (Thief OG's) iam not recommended to set only my TP. its your own choice you can make money then take money at your own risk.
📡 Related Pairs to Watch (Correlation + Key Points) 🔍📊
1️⃣ BINANCE:SHIBUSDT 🐕🔥
High correlation with meme-coin liquidity flows.
When SHIB pumps aggressively, PEPE usually follows due to risk-on behavior in the meme sector.
Watch for SHIB breakout above local resistance → signals strong liquidity returning to meme coins.
2️⃣ BINANCE:DOGEUSDT 🐶⚡
DOGE is the macro driver of meme-coin sentiment.
If DOGE shows HMA / SMA breakout, PEPE often mirrors with delayed volatility.
Large spikes in DOGE funding rates = PEPE momentum probability increases.
3️⃣ BINANCE:FLOKIUSDT 🐺💥
FLOKI often leads mid-cap meme rotation cycles.
When FLOKI rallies, PEPE tends to follow after short consolidation → swing traders use this correlation.
4️⃣ CRYPTO:WIFUSD (Solana Meme Leader) 🐕🦺🚀
A strong SOL ecosystem rally pulls meme funds from multiple exchanges.
PEPE benefits from cross-chain meme rotation once WIF volatility cools off.
5️⃣ BINANCE:BTCUSDT & BINANCE:ETHUSDT (Macro Drivers) 🧠📉📈
If BTC ranges & ETH strengthens → altcoins, esp. memes, get liquidity boost.
PEPE breakout success rate increases when:
BTC volatility is low
ETH shows positive funding rates
🧩 Summary for Traders (High Engagement Style)
PEPE preparing bullish continuation with Hull MA breakout 🔥
SMA resistance near target = take profits wisely
SL only after confirmation—Thief OG style 🕶️💼
Watch correlated meme-pairs for early signals
Liquidity rotation across SHIB → FLOKI → PEPE remains strong
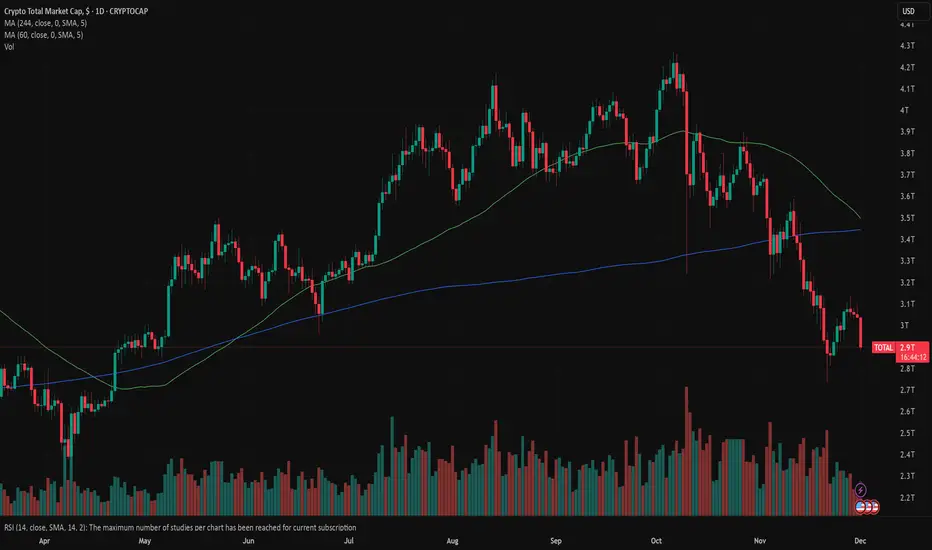
The most essential chart in the crypto market. OVERVIEW!Today I'd like to talk the most essential chart in the crypto market to get a whole sense about altcoins. Currently BTC.D has been in the flat during breaking of a bullish trend for already 130 days, almost the same like in the previous cycle, and after that there was a tremendous liquidity flow from BTC and ETH to altcoins. So I'm expecting the beginning of BTC.D decline and liquidity flow to altcoins for 3-4 months at the end of January. The shift can happen a difference of 20-30 days.
Total 3 (the altcoin index) has also been at in essential weekly trend level for 3 months, which is the strongest support zone in the entire history of the chart. If you open a week timeframe, you can see how many times the chart was bouncing back from this weekly trend level and from EMA 100 level. As a rule of thumb, when the price reaches EMA 100, that alone signals about a reversal trend and the market reached the bottom. So I don't believe that altcoins will fall much lower, we're already in the bottom with 95%. There were around 1 billions of dollars liquidations almost every day in October and November, a lot of bulls were wiped out from the market, overleveraged traders lost all their deposits. There is liquidity below of this level and it's time to punish short traders who used to short every bounce and it's just the matter of the time when they'll be wiped out too. To put it simply, I think the market will do better in January, even the beginning of hype and euphoria that can reached its peak in April because if we take a look at the last bullish pumps by 300-500%, we can see that the process of pumping tokens usually takes around 3-4 months. Most assets have fallen even too lower than I expected and there is no one buying anything which means the market has become more pure and only real traders with real money stayed afloat there. Looking at the fear and apathy index that has been in the lowest levels since COVID-19 era tells us that market participants are afraid of buying the dip. At this point, according to history, the market can make a reversal trend from current levels. I'm still holding most my altcoins and never sold them yet. I'm not going to sell my portfolio until I see a $7000 price on ETH. Let's see how this is gonna turn out eventually! #FORECAST 2026 ALTCOINS

MARKETS week ahead: December 29 – January 4Last week in the news
The Christmas week brought one non-working day, but no significant changes on the market. Gold and silver are for sure assets which won the year 2025. Gold reached another fresh all time highest level at $4.550, surging by more than 66% during this year. US equity markets used the last trading week in the year to reach some higher levels and book a profitable year. The S&P 500 reached another all time highest level at 6.944. The 10Y US yields are still searching for some catalyst among macro data, testing the level of 4,2% for the last time this year. Still, they are closing the week at 4,13%. The crypto market is certainly one of the assets with the highest correction in value. BTC is still trying to break the $90K, however, the lack of liquidity is keeping the coin in the range between $87K-$88K.
During the Christmas week and related holidays, the release of major U.S. macroeconomic data was limited. Durable Goods Orders declined by 2.2% month over month in October. Meanwhile, third-quarter GDP growth surprised markets, coming in at 4.3% q/q versus expectations of 3.3%. Industrial production rose by 0.2% month over month in November, outperforming forecasts of no change, and increased by 2.5% on a year-over-year basis.
Nvidia is making a landmark deal valued at around $20 billion to license technology and acquire key assets from AI chip start-up Groq, marking the company’s largest strategic move to date. The agreement gives Nvidia access to Groq’s advanced inference chip designs and brings Groq’s leadership team, including its CEO, into Nvidia’s ranks, while Groq itself will continue operating independently. This move strengthens Nvidia’s position in the rapidly growing AI inference market, complementing its dominance in AI training hardware. The deal also reflects broader tech industry trends of licensing IP and hiring talent rather than traditional acquisitions, potentially easing regulatory concerns. Nvidia’s decision underscores intensifying competition in AI hardware innovation and real-time model processing.
Oracle’s share price has slumped about 30% this quarter, putting the stock on track for its worst quarterly performance since 2001 as investor confidence wanes. The drop reflects deepening concerns over the company’s ability to execute its ambitious AI infrastructure build-out, including major capital expenditures and heavy debt to support cloud and data centre expansion tied to deals like the one with OpenAI. Recent quarterly results also showed weaker-than-expected revenue and free cash flow, adding to scepticism about near-term profitability. Wall Street is questioning whether Oracle can deliver on commitments quickly enough to justify the massive spending and maintain its investment-grade credit standing. Analysts and investors are now weighing the long-term potential of Oracle’s AI strategy against the financial risks of its aggressive pivot into cloud infrastructure.
China’s cyberspace regulator has released draft rules to tighten oversight of AI services that mimic human personalities and emotionally engage users, opening them for public comment. The proposed regulations would require AI providers to warn users about excessive use, intervene if signs of addiction occur, and implement robust safety, data protection, and algorithm review systems. They also impose content restrictions banning anything that threatens national security, spreads misinformation, or promotes violence or obscenity. The move reflects Beijing’s effort to strengthen safety and ethical standards for consumer-facing AI technologies.
CRYPTO MARKET
The year 2025 was indeed a highly challenging one for the crypto market. A lot of insecurities regarding geopolitics, government measures, trading challenges and unstable macroeconomic outlook, all made investors turn toward metals this year. The liquidity from the crypto market was turned toward gold and silver, both assets that surged substantially, especially during the Q4 this year. Total crypto market capitalization was additionally decreased by 0,9% during the previous week, with a weekly outflow of $28B. Daily trading volumes were additionally decreased to the level of $122B on a daily basis, from $160B traded a week before. Total crypto market capitalization increase from the beginning of this year currently stands in a negative territory of -9%, with a total funds outflow of $303B.
Although this was a negative week for the crypto market, still, not all coins finished the week in red. BTC lost -0,7% in value, while ETH dropped by -1,7%. Among other weekly losers are XRP with a drop of -3,8%, DOGE lost -6,8% in value, ADA was traded down by -5,3% and market favourite Solana dropped by -2,4% w/w. At the same time, DASH and ZCash are still holding market attention. ZCash managed to gain 15% in value during this week, while DASH surged by 14,5%. Algorand had a modest increase of 3,5% while Avalanche added 2,3% to its value.
Considering coins in circulation, IOTA had the highest increase of coins on the market of 0,5%. Majority of other altcoins had an increase of 0,1%, including ZCash, Solana, DOGE, Filecoin.
Crypto futures market
The crypto futures market traded modestly lower over the week, with both Bitcoin and Ether futures extending their gradual consolidation phase. Price movements were measured and orderly across the curve, indicating continued caution among market participants rather than renewed downside momentum.
Bitcoin futures declined between –0.60% and –1.29% w/w. The December 2025 maturity closed at $86,925, while futures through March 2027 settled at $94,610. Losses were slightly more pronounced at the front end of the curve, with longer-dated maturities showing greater stability. Notably, new long-dated Bitcoin futures maturities for June 2027 and December 2027 were listed for the first time, closing at $96,240 and $99,065, respectively. The introduction of these maturities extends the futures curve further into the future and reflects growing demand for longer-term exposure and hedging opportunities.
Ether futures underperformed Bitcoin, declining between –2.26% and –2.84% across maturities. The December 2025 futures closed at $2,913, while March 2027 ended the week at $3,220.
Despite the broader weakness, price action remained smooth across the curve, with no signs of dislocation or stress. As with Bitcoin, new Ether futures maturities for June 2027 and December 2027 were listed this week, closing at $3,287 and $3,410, respectively. The extension of the ETH futures curve mirrors that of BTC and suggests sustained institutional interest in managing long-term ETH exposure.
Overall, this week’s performance reflects a continued consolidation phase in crypto futures markets. The relatively small magnitude of weekly declines, combined with the successful extension of the curve to later maturities, points to a market that remains cautious in the near term but structurally intact in its longer-term outlook. The stable curve structure and orderly trading across both BTC and ETH futures suggest that investors are maintaining strategic positions while awaiting clearer directional catalysts.

MARKETS week ahead: December 22 – 28Last week in the news
Volatility on financial markets continues to be high, despite the forthcoming holiday season and a year-end. The S&P 500 passed through significant correction, however, weaker inflation data from expected draw the index back toward the 6.834 level. The price of gold is still struggling to reach the newest ATH, but the sentiment remains bullish, closing the week at $4.338. US 10Y Treasury yields are mingling on inflation data between 4,1% and 4,2%, still closing the week at 4,15%. This week BTC went through some strong volatility, but still managed to sustain $90K to the upside and $85K to the downside, with a weekly-close level above the $88K.
Key U.S. data last week included the November labour market and inflation releases. Nonfarm payrolls rose by 64K, slightly above expectations of 50K, while the unemployment rate unexpectedly increased to 4.6% from 4.4%. October retail sales were flat, missing expectations for a 0.1% gain. Average hourly earnings rose 0.1% m/m and 3.5% y/y in November. Inflation came in below forecasts, with headline CPI at 2.7% y/y and core inflation at 2.6% y/y. The University of Michigan’s final December consumer sentiment index slipped to 52.9 from an expected 53.4, while five-year inflation expectations eased to 3.2% from 3.4%.
The ECB meeting was held during the previous week, with no change in interest rates, as expected. With the last ECB rate cut in June, more than six months of unchanged rates signal that only a sharp deterioration in inflation or growth would trigger further cuts. The ECB’s “good place” effectively reflects a neutral policy stance. Moving from neutrality to easing still faces a high bar, as confirmed by President Christine Lagarde. While acknowledging a broadly stable outlook amid uncertainty, she emphasized policy optionality, suggesting that cuts, hikes, or holding rates are all possible—softening earlier suggestions that the next move would necessarily be a hike. As per latest ECB economic projections, the GDP growth rate for 2026 is estimated at 1,4%, with headline inflation of 1,9%.
The Bank of Japan increased reference interest rates by 25 basis points, to 0,75%. The BoJ statement reflects rising confidence in sustained inflation, highlighting steady wage growth, limited risk of disruption to wage-setting, and continued moderate increases in wages and prices. At the same time, the BoJ stressed that real rates will remain significantly negative and financial conditions accommodative, supporting growth. While the statement signals further hikes if the outlook holds, their timing and size remain uncertain. The emphasis on deeply negative real rates suggests the BoJ now sees the lower end of the neutral rate above 1%.
Oracle drew strong market attention during the week, with shares surging on reports that TikTok and parent ByteDance plan to form a new U.S. entity led by a consortium including Oracle, Silver Lake, and MGX. The group would hold a majority stake in the proposed “TikTok USDS” joint venture, a move viewed as a strategic win that secures Oracle a high-profile cloud and data security client and reinforces its position in enterprise technology services.
CRYPTO MARKET
The crypto market experienced significant volatility last week, with Bitcoin swinging sharply between $85K and $90K. Traders cited leveraged positions and position liquidations as key drivers of the intraday swings, rather than pure manipulation. Overall, market moves were driven by profit-taking, leveraged position liquidations, and key support/resistance tests, while broader sentiment remains neutral-to-cautious. Total crypto market capitalization decreased by 3% or $90B within the week. Daily trading volumes also decreased to $160B on a daily basis, from $224B traded during the previous week. Total crypto market capitalization increase from the beginning of this year currently stands in a negative territory of -9%, with a total funds outflow of $275B.
Weekly trading on the crypto market was in a pretty volatile manner. Not all coins finished the week in red, however, big names were driving total market cap to the downside. BTC finished the week 2,2% lower, with an outflow of $40B. ETH was also traded to the downside, closing the week lower by 4,3%. Solana, DOGE, OMG Network and XRP dropped by more than 5%, while Cardano was traded lower by 8,5%. This week Uniswap had one of the best performances with an increase in value of 12%. Monero added 9,6% while ZCash closed the week by almost 6% higher.
On the side of circulating coins, LINK had the highest increase of 1,6%. IOTA had an increase of 0,5%, while Filecoin added 0,3% of new coins to the market. XRP should also be mentioned as it increased the number of coins in circulation by 0,4%.
Crypto futures market
The crypto futures market moved lower over the week, with both Bitcoin and Ether futures retreating across all maturities. The decline followed the prior week’s modest recovery and reflects a renewed period of consolidation, as market participants remain cautious amid an uncertain near-term outlook.
Bitcoin futures declined between –2.61% and –2.77% w/w. Losses were evenly distributed along the curve, with the December 2025 maturity closing at $88,060 and March 2027 settling at $95,180. The broadly parallel shift lower suggests measured risk reduction rather than aggressive selling pressure. Despite the pullback, the curve retained its upward slope, indicating that longer-term expectations remain relatively stable.
Ether futures also moved lower, posting weekly declines ranging from –2.85% to –3.03%. The December 2025 maturity closed at $2,998, while the March 2027 maturity ended the week at $3,296. ETH futures underperformed BTC slightly on a relative basis, reflecting continued sensitivity to short-term sentiment. Nonetheless, price action remained orderly, with no signs of stress along the curve.

$APE is EXTREMELY underpriced for being a meme coinWhen it got added to the canadian market Wealthsimple it, like every other new crypto added to Wealthsimple(not anymore there's too many), It Shot to the moon in a week tripling in value! A back of the mind crypto once worth nearly 8 BILLION is finding a floor at 100m+. A psychological target of $1 from 20 cents will easily 5x with such little market cap!

ETHUSDT – Small Update. ETHUSDT – Small Update
ETH is squeezing near the trendline support.
A breakout above 3.0–3.1K can trigger a bullish move, while a breakdown may push the price toward 2.5K.
DYOR | NFA.

MARKETS week ahead: December 15 – 21Last week in the news
The Fed cut interest rates by 25 basis points, aligning with market expectations. US equity markets reacted positively, however, concerns regarding AI-valuation made Friday a red-day, where S&P 500 closed the week at 6.827. Weakening US Dollar supported the price of gold which headed higher, modestly below its ATH, closing the week at $4.299. Notes from some Fed officials over uncertainty whether interest rates should be further lowered, pushed the 10Y US yields higher on Friday, closing the week modestly below the 4,2%. The crypto market aligned with general market volatility, however, BTC managed to hold ground at $90K.
As it was highly expected, the Fed decreased interest rates by 25 basis points. The balance of risks and a focus on Fed's dual mandate continues to be at the core of Fed's decisions. As per Fed Chair Powell, the economy is perceived to be expanding at a moderate pace, with evident slowing in the labour market, and an unemployment rate edging up. Inflation continues to be “somewhat elevated”, with risks to the upside. It has been also announced that the Fed will initiate purchases of short-term Treasury securities as needed to maintain an ample supply of reserve balances. According to the Summary of Economic Projections, the GDP forecasts were modestly upgraded for 2026, with inflation projections still above the 2% target. The course of monetary actions in 2026 for the moment remains unclear, and would depend on data.
U.S. markets and crypto investors are watching as the Bank of Japan (BOJ) prepares to raise interest rates to the highest level in about 30 years, signalling a shift away from decades of ultra-low monetary policy. Rising Japanese rates and a stronger yen are seen as potential headwinds for risk assets, including Bitcoin, because they threaten to unwind the long-standing yen carry trade that has supported liquidity for speculative investments. This tightening could put downward pressure on Bitcoin prices even as other central banks, like the Fed, maintain easier policy. Crypto markets are reacting with increased volatility as traders reassess macro risks tied to global rate shifts.
There has been a lot of discussion in the news regarding the potential new Fed Chair, after the mandate of current Chair Powell expires in May 2026. JPMorgan CEO Jamie Dimon publicly endorsed former Federal Reserve governor Kevin Warsh as a strong candidate to be the next Fed chair. His comments come as President Donald Trump is reportedly considering Warsh along with White House economic adviser Kevin Hassett for the role. Dimon suggested Hassett may be more likely to push for near-term rate cuts, aligning with Trump’s preferences, but emphasized his support for Warsh’s qualifications.
Oracle (ORCL) posted its quarterly results on Wednesday, posting a total revenue increase of around 14% y/y, which was slightly below analysts’ expectation. Its revenue from cloud services grew strongly, around 34%, however, it was not enough to offset broader concerns. The company raised its fiscal 2026 capex forecast primarily for AI-focused cloud data centers and GPU capacity expansions. Regardless of relatively solid results, Oracle's stocks fell sharply, as a result of investors concerns whether the AI-facility milestones could be achieved.
U.S. regulators have given preliminary approval to several major cryptocurrency firms, including Ripple, Circle, BitGo, Paxos and Fidelity Digital Assets, to establish national trust banks under federal oversight. These conditional charters would allow the companies to manage and hold assets and settle payments nationwide, though they cannot yet accept deposits or make loans, and final approval is still required. The move represents a notable step toward integrating digital-asset businesses into the traditional banking framework.
CRYPTO MARKET
The crypto market faces pressure from weak liquidity, large leveraged liquidations, and ETF outflows, amid macro concerns. Regardless of the Fed rate cut by another 25 bps, the Bank of Japan is set to lift rates to a 30-year high, strengthening the yen and threatening the carry trade that fuels risk assets. Crypto markets are reacting with heightened volatility as traders reassess global monetary risks, as well as future economic outlook and monetary measures in the US. The crypto market was traded in a mixed manner during the previous week. Total crypto market capitalization was increased by less than 1%, where $21B has been added. Daily trading volumes also remained flat on a weekly level, trading around $224B on a daily basis. Total crypto market capitalization increase from the beginning of this year currently stands in a negative territory of -6%, with a total funds outflow of $185B.
During the week crypto coins had their both red and green days, leaving the total weekly change flat. BTC ended the week flat, while ETH managed to add less than 2% to its total value. ZCash continues to gain market attention, managing this week to increase its value by 27%, and was one of the extremely rare coins with such a strong performance. Monero added 5% w/w to its total value, while DOGE gained 3% w/w, same as Theta. Few coins which finished the week in red were Filecoin, with a drop of more than 10%, Polkadot was down by 5%, same as Tron. This week DASH closed in a red zone, with a drop of 6,2% in value.
Increasing activity among circulating coins continues. This week, BTC added new coins to the market by 0,1% w/w. It was also interesting that DOGE increased its number of circulating coins by 3,9%. Solana had an increase of 0,3%, while Avalance, DASH, ZCash and Algorand increased the number of coins by 0,1%. This week Filecoin added 0,3% of new coins.
Crypto futures market
The crypto futures market edged modestly higher over the week, as both Bitcoin and Ether futures posted small but consistent gains across the curve. The move reflects a period of stabilization following recent consolidation, with price action suggesting cautious re-engagement rather than a decisive shift in sentiment. Bitcoin futures advanced by 0.86% to 0.95% across maturities. Gains were evenly distributed along the curve, with December 2025 closing at $90,440 and longer-dated maturities such as March 2027 settling at $97,730. The parallel nature of the move indicates incremental buying interest rather than aggressive positioning, while the maintained upward slope of the curve continues to point to steady medium-term expectations.
Ether futures outperformed Bitcoin on a relative basis, rising between 1.83% and 1.95% w/w. The December 2025 maturity closed at $3,088, while March 2027 settled at $3,398.
The consistent gains across maturities suggest improved confidence in ETH, with buyers gradually returning after several weeks of subdued activity.
Overall, this week’s performance reflects a constructive but cautious tone in crypto futures markets. The limited magnitude of gains suggests that participants remain selective, awaiting clearer directional signals. Nonetheless, the stability of the curve structure and steady upward adjustments indicate that the market is building a foundation for potential further recovery.

BitcoinBTCUSD
- Bearish Channel as an corrective pattern in Long Time Frame
- Fair Value Gap
- Completed " 123 " Impulsive Waves
- Fibonacci Level - 38.20% / 50.00%
- Bullish Channel in Short Time Frame

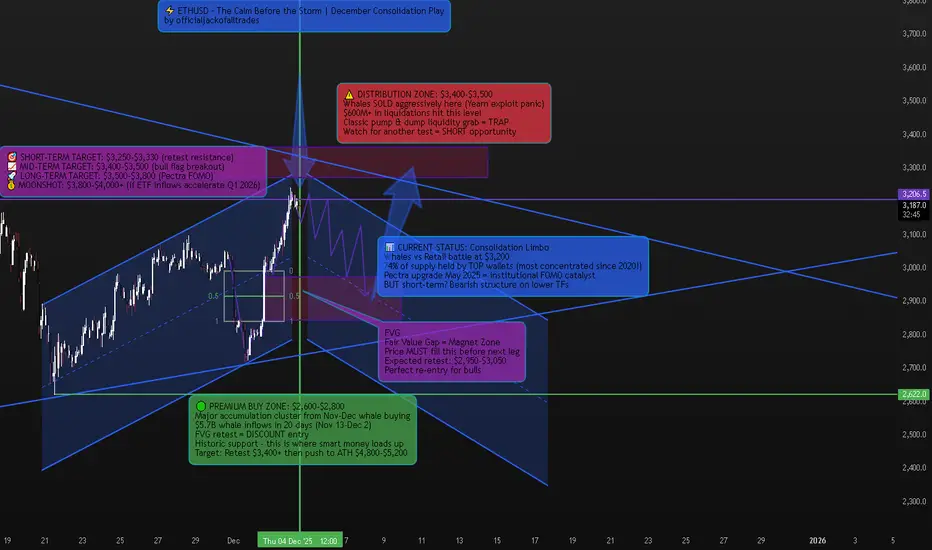
ETHUSD – The Calm Before the Storm | December's Most Misundersto📈 Market Context – Why Everyone's Wrong About ETH Right Now
Ethereum is sitting at one of the most deceptive price levels in crypto right now. Most traders see the recent dump from $3,762 on December 2 and think "it's over." Others see the consolidation around $3,208 and think "dead cat bounce."
They're both missing the bigger picture.
Here's what ACTUALLY happened: A 2015 Ethereum ICO wallet that had been inactive for a long time moved 40,000 ETH suddenly, worth around $120 million. Crypto Twitter panicked. But then Lookonchain verified that it was for internal transfer, and not a liquidation. Classic FUD.
What REALLY tanked ETH? A Yearn Finance exploit that happened at the worst possible time, when the market was stretched by leverage and rising speculative positioning. More than $600 million in crypto liquidations hit the market. This wasn't an organic selloff—this was a leveraged washout.
But here's the kicker: While retail was panic-selling, whales were accumulating like it's 2020 all over again.
🔎 Technical Framework – The Deceptive Calm
Current State:
Ascending broadening wedge inside rising channel—classic volatility compression before explosive move
Key Liquidity Zones:
🔴 Distribution Liquidity Zone (SHORT Opportunity):
$3,550 - $3,650 (recent spike high + whale distribution cluster)
This is where whales moved 40,000 ETH at $120 million valuation before the "transfer" narrative
Since December 2024, aggressive selling by whales has been evident in the rise of average market order sizes
🟢 Accumulation Liquidity Zone (BUY ORIGIN):
$2,900 - $3,000 (FVG retest + November-December whale buy zone)
From November 13 to December 2, whales acquired a total of 1,702,835.5 ETH at an average price of $5.7 billion
In early 2025, large holders acquired over 330,000 ETH, valued at approximately $1.08 billion
⚖️ Chop Zone (NO TRADE ZONE):
$3,100 - $3,400 (current consolidation limbo)
This struggle between institutional investors and retail traders could define Ethereum's price action in the coming weeks
🐋 WHALE ACTIVITY – The REAL Story Nobody's Talking About
While everyone's focused on the dump, let me show you what the ACTUAL data says:
The Accumulation Phase (That Everyone Missed):
Ethereum whale wallets have recorded positive netflows in each of the last 20 trading days, dating back to November 13
The highest single-day inflows of 2570 ETH came on November 14 when Gensler's exit was confirmed
Ethereum ETFs attracted $2.63 billion in inflows in December 2024, led by the Fidelity Ethereum Trust
The Concentration Effect (This is MASSIVE):
Over the past four months, Ethereum's Gini coefficient increased from 0.7563 in September to 0.7630 in December 2024—a clear sign of growing ownership concentration. Translation? Whales are consolidating control.
Even crazier: Addresses holding 10,000+ ETH now control 74.47% of Ethereum's circulating supply. Compare that to Bitcoin where large holders control only about 15%—ETH is FIVE TIMES more whale-controlled than BTC.
This is why ETH moves are so violent and why large transfers or sales by a tiny fraction of holders can rapidly sway Ethereum's price and sentiment.
The Distribution Signal:
But here's where it gets interesting: Since December 2024, there has been an increase in aggressive sell orders, particularly from whales, with rising average market order sizes suggesting they are offloading holdings.
So what gives? Are whales accumulating or distributing?
BOTH. They're accumulating at discount levels ($2,900-$3,050) and distributing at premium levels ($3,550-$3,650). This is classic smart money behavior—they're range-trading the volatility while retail gets chopped.
🚨 Recent Developments – The Catalyst Stack
Pectra Upgrade – May 7, 2025 (GAME CHANGER)
The Pectra upgrade went live in May 2025, introducing batch transactions, gas payment in any token, and doubling blob capacity for Layer 2s.
Key improvements:
Account Abstraction enables gas payments using multiple tokens like USDC and DAI, with third-party fee sponsorship
EIP-7691 doubles Ethereum's blob throughput from three blobs with a maximum of six to six with a maximum of nine
With the Pectra upgrade, Ethereum's data capacity significantly increases to about 420 TPS from 210 TPS
Translation: ETH just became TWICE as fast for Layer 2s. This is MASSIVE for scalability and will drive institutional adoption.
ETF Inflows – The Silent Accumulation
Ethereum ETFs attracted substantial institutional interest, with inflows reaching $2.63 billion in December 2024. This is institutional money positioning for the next leg up—they don't buy at tops, they buy at bottoms.
Gary Gensler Exit – Regulatory Tailwind
The impending exit of SEC chairman Gary Gensler enhanced investor confidence in the altcoin sector, putting Ethereum in prime position to deliver superior performance relative to BTC.
Staking Explosion
Staking activity reached near-all-time highs, with 36.19 million ETH locked in validators—a 4.5% increase since October 2024. That's $115+ BILLION locked away, reducing circulating supply.
DeFi TVL At $90 Billion
Total Value Locked in Ethereum protocols surged to $90 billion, driven by renewed interest in yield-bearing DeFi products. Institutional money is FLOODING into ETH DeFi.
🎯 Trade Plans – High-Probability Setups
🟢 BUY ETHUSD: $2,900 - $3,000 | SL $2,820
Thesis: FVG retest at proven whale accumulation zone + November-December $5.7B whale buying cluster = institutional re-entry point
Entry Rules (MUST WAIT FOR CONFIRMATION):
Price dips into $2,900-$3,000 FVG zone
Bullish CHoCH (Change of Character) + BOS (Break of Structure) on H1-H4
Strong bullish rejection wick with volume spike (100K+ ETH volume on 4H)
Ideally on Order Block retest after initial bounce
BONUS CONFIRMATION: Check whale netflow data on IntoTheBlock—if showing positive inflows, ADD to conviction
Targets:
$3,350 - $3,400 (mid-channel retest, quick 12-15% gain)
$3,600 - $3,750 (previous high retest + distribution zone, 23-28% gain)
$4,200 - $4,500 (bull flag breakout + Pectra FOMO begins, 42-50% gain)
$5,200 - $5,800 (ATH retest + full bull market confirmation, 75-95% gain)
Moonshot: $6,500+ (if ETF inflows accelerate post-Pectra like BTC did)
Risk Management:
Position size: 3-5% of portfolio (this is a HIGH-CONVICTION setup)
Scale in 40% at $3,000, 30% at $2,950, 30% at $2,900
Trail stop to breakeven after hitting Target 1
Take 30% profit at Target 2, let rest ride with trailing stop
🔴 SELL ETHUSD: $3,550 - $3,650 | SL $3,750
Thesis: Premium liquidity retest at proven whale distribution zone—classic "return to scene of crime" before deeper correction
Entry Rules (WAIT FOR CONFIRMATION):
Price pumps into $3,550-$3,650 zone (previous spike high)
Bearish CHoCH + MSS (Market Structure Shift) + BOS down on H1-H4
CRITICAL: Check CryptoQuant whale-to-exchange flow—if showing HIGH exchange inflows (whales moving ETH to exchanges to sell), this is your GO signal
Heavy volume spike on bearish candle (150K+ ETH on 4H)
Entry after FVG fill or Order Block retest post-initial rejection
Targets:
$3,200 - $3,250 (first support retest, quick 8-12% gain)
$3,050 - $3,100 (mid-channel support)
$2,900 - $3,000 (FVG zone—BUY setup reactivates here!)
Risk Management:
This is a COUNTER-TREND trade—use tighter stops
Position size: 2-3% max (smaller than long setup due to higher risk)
Take 50% profit at Target 1, move SL to breakeven
Exit FULLY at Target 3 and flip to LONG setup
⚠️ Risk Management & Critical Notes
The #1 Mistake: Trading inside the $3,100-$3,400 chop zone without confirmation. The struggle between institutional investors and retail traders in this range creates whipsaw conditions this is where retail accounts get DESTROYED.
Whale Flow Monitoring is NON-NEGOTIABLE: High leverage remains with funding rates indicating very high risk-taking activities and markets still inclined towards speculative long positions. Use Glassnode or IntoTheBlock to monitor whale exchange inflows BEFORE entering trades.
Volatility Warning: This concentrated ownership structure means large transfers or sales by a tiny fraction of holders can rapidly sway Ethereum's price. Set alerts for 10,000+ ETH whale movements on Whale Alert.
Macro Headwind: Japan has indicated tightening, and U.S. real interest rates remain high. Under low liquidity conditions, even minor shocks can trigger significant price changes. If SPX dumps 5%+, ETH follows—be ready to cut positions.
Position Sizing: Given the extreme whale concentration, never go all-in. Scale positions at key levels. This isn't a casino—it's warfare against billion-dollar players.
📊 The Bottom Line – Why This Time Is Different (Or Isn't)
Let me give it to you straight: ETH is at a crossroads.
The Bull Case (What I'm Leaning Toward):
✅ $5.7 billion in whale accumulation over 20 days since November 13
✅ $2.63 billion in ETF inflows in December 2024
✅ $90 billion TVL in DeFi protocols institutions are building
✅ Pectra upgrade doubled transaction throughput to 420 TPS
✅ 36.19 million ETH staked = reduced supply
✅ Gary Gensler gone = regulatory tailwind
✅ Technical structure: Rising channel still intact, FVG below = perfect retest setup
The Bear Case (What Keeps Me Up at Night):
⚠️ Aggressive whale selling since December with rising average market order sizes
⚠️ Even as Bitcoin and Solana hit all-time highs after Trump's election, Ether topped out at $4,000 in December, well short of its 2021 high of $4,800
⚠️ High leverage with funding rates indicating very high-risk speculative long positions
⚠️ Global liquidity tightening from Japan and high U.S. real interest rates
⚠️ 74.47% of supply controlled by whales = extreme manipulation risk
⚠️ Price underperforming BTC and SOL = capital rotation away from ETH
My Take:
The $5.7 billion whale accumulation since November 13 tells me smart money is positioning for a move. But the aggressive whale selling at premium levels tells me they're range-trading, not accumulating for a straight pump to $10K.
Here's the play:
Short-term (Dec-Jan): Expect consolidation with violent swings. Trade the range: buy $2,900-$3,000, sell $3,550-$3,650.
Medium-term (Feb-April): After Pectra hype builds + ETF inflows accelerate, we get the push to $4,200-$4,800.
Long-term (Mid-2025+): If ETH breaks $4,800 ATH with volume, we're going to $5,800-$7,000+.
BUT: If ETH breaks below $2,850 with volume, the bull case is dead and we're heading to $2,600-$2,400 to fill lower FVGs.
🔥 Strategy Summary – How I'm Trading This
Phase 1 (NOW - January):
Wait for dip to $2,900-$3,000 FVG zone
Scale in long position (3-5% of portfolio)
Target: $3,600-$3,750 for 25-30% gain
Take 30% profit, trail stop on rest
Phase 2 (If we hit $3,600+):
Watch whale exchange inflows
If HIGH inflows (distribution signal) → SHORT at $3,550-$3,650
If LOW inflows (holding) → add to longs, target $4,200-$4,500
Phase 3 (Post-Pectra Hype, March-May):
If ETH holds above $3,600 and Pectra adoption is strong → go HEAVY long
Target: ATH breakout to $5,200-$5,800
This is the "generational wealth" move IF it plays out
Invalidation:
Close ALL longs if ETH closes below $2,850 on daily
Flip bearish, target $2,600-$2,400
💡 Final Word – The Truth About ETH Right Now
ETH isn't "dead." But it's not "mooning tomorrow" either.
Critics have blasted developers' decision to focus on Layer 2 blockchains, arguing those chains siphon value from ETH. That's a real concern. ETH isn't pumping like BTC or SOL because value is flowing to L2s.
But here's the counterargument: With the Pectra upgrade, this will double L2 performance out of the gate, leading to lower costs and faster transaction times. If L2s explode in adoption, ETH benefits as the base layer. It's like owning the toll road, not the cars.
The Question: Will the $2.63 billion in ETF inflows and $5.7 billion in whale accumulation be enough to push ETH to new ATHs? Or will whale distribution at premium levels and high leverage markets cause another violent shakeout first?
My bet: One more shakeout to $2,900-$3,000 (FVG retest), THEN the real pump begins. But I'm not holding through a breakdown below $2,850. That's where I cut and flip bearish.
Trade the structure. Follow the whales. Protect your capital.
Drop a 🔥 if you're watching that $2,900-$3,000 FVG like a hawk. This is where fortunes are made or lost.
TESLA TO BTC & TOTALThis analysis compares NASDAQ:TSLA performance relative to BINANCE:BTCUSDT .
As you can see, Tesla’s stock is showing a bullish stance against Bitcoin and appears to be at the beginning of its Elliott Wave 3.
This chart delivers Four key messages:
1.Bitcoin is expected to decline while Tesla moves higher
2.Bitcoin is expected to drop while Tesla moves into a range
3.Both are expected to decline, but Tesla is likely to fall less than Bitcoin
4.Both rise, but Tesla gains more.
I’d be happy if you shared your thoughts.
NASDAQ:TSLA
BINANCE:BTCUSDT
CRYPTOCAP:TOTAL
BINANCE:BTCUSD

Perfect Execution - Waiting for Confirmation Saves AccounsKey levels attract attention, but attention alone rarely produces good trades. A level gains meaning only when price shows how it behaves around it. Many traders understand where important levels are, yet still lose money because they enter too early, assume a breakout will continue, or anticipate a reversal before the market confirms it.
Patience at these levels is what separates disciplined execution from unnecessary losses.
A key level acts like a pressure point. Liquidity gathers above highs, below lows, and around clear support or resistance.
When price approaches these zones, it does not move cleanly. It probes, sweeps, hesitates, or accelerates depending on who holds control. Entering at the first touch is often an emotional decision disguised as confidence. Entering after confirmation is a structured decision grounded in evidence.
Confirmation begins with a reaction. A legitimate bounce or rejection has intent behind it. You will see displacement, cleaner momentum, or a defined shift in micro-structure. A candle wick alone is not confirmation.
A single green or red candle is not confirmation. Confirmation comes when the market shows that a level is respected or rejected with conviction, as several conditions align.
One of the clearest signs of confirmation is the break of micro-structure after the level is touched. If price sweeps a low and then breaks a minor high, the narrative changes. The same applies to resistance: a sweep followed by a failed attempt to push lower is evidence of buyers stepping in.
This structural shift shows that the reaction is more than a random bounce.
Another layer of confirmation is the retest. Strong moves often return to the level they broke to validate participation.
Traders who enter before this retest expose themselves to unnecessary volatility. Traders who wait allow the market to prove that the move is real, not a trap.
The retest reduces risk naturally and improves the reward-to-risk ratio without changing the strategy itself.
Patience does not slow you down. It filters out trades that look attractive but lack substance. Key levels attract liquidity, manipulation, and emotional behaviour.
Waiting for confirmation keeps you grounded when the market is trying to provoke a reaction. It prevents you from turning strong levels into weak trades through premature entries.
The goal is not to catch the exact top or bottom of a move. The goal is to participate in moves that show clear strength and clear intent.
When you treat key levels as decision points rather than entry signals, your trading becomes structured, disciplined, and far more consistent. Patience is not passive. It is an active skill that protects your account and elevates your execution.

MARKETS week ahead: December 7 – 13Last week in the news
September's PCE data was in line with market expectations, which supported investors expectations that the Fed might cut interest rates at December meeting. US equities continued to gain, where the S&P 500 managed to close the week at 6.870. This week gold was not in the spotlight of investors, who are waiting for a correction in gold price in order to continue purchases. Gold closed the week at $4.197. The US Treasury yields reacted to inflation data on Friday, pushing the 10Y yields toward 4,14%. The crypto market continues to lag behind, with BTC struggling to sustain levels around the $90K, but dropping again on Saturday below this level.
The key U.S. economic release of the week arrived Friday with the publication of the September PCE data, a particularly important indicator given its timing just ahead of next week’s FOMC meeting. The PCE Price Index rose 0.3% m/m and 2.8% y/y, while core PCE increased 0.2% in September. Personal income climbed 0.4%, and personal spending advanced 0.3%, both broadly in line with expectations. Friday also delivered the University of Michigan’s preliminary December Consumer Sentiment reading of 53.3, slightly above the anticipated 52, while five-year inflation expectations eased to 3.2% from 3.4% previously. Eased inflation figures supported market expectations that the Fed might cut interest rates at December's meeting. Current odds as per CME FedWatch Tool stands at 87%.
Netflix has agreed to acquire Warner Bros. Discovery’s film and TV studios plus the streaming service HBO Max in a deal valuing the business at about $72 billion equity, giving Netflix control over a massive content library including hits and legacy franchises. The deal faces sharp opposition from unions, theatre-owners, and lawmakers, who argue it could reduce competition, hurt jobs, raise prices for consumers, and damage diversity of content. At the same time, according to reports, the White House officials view the merger with “heavy scepticism,” meaning that the administration may not be enthusiastic about its approval
Kraken and Deutsche Börse announced a strategic partnership aimed at bridging traditional finance and the digital-asset space by combining Deutsche Börse’s regulated infrastructure with Kraken’s crypto-native platform. In the first phase, Kraken will integrate with Deutsche Börse’s FX platform 360T, giving its clients access to bank-grade foreign-exchange liquidity and improving fiat on/off-ramp capability. Future plans (subject to regulation) include offering regulated crypto trading, tokenized assets, and derivatives (from Eurex) and potentially letting institutions trade spot crypto, tokenized stocks (via xStocks), and crypto derivatives under one roof.
News is reporting that OpenAI has declared a “code red,” refocusing the company’s resources solely on improving ChatGPT while pausing development of other projects like advertising, AI agents for health and shopping, and its planned assistant “Pulse.”. This comes as competition intensifies: rival models such as Gemini 3 from Google and offerings from Anthropic have closed the performance gap, threatening OpenAI’s dominance. Analysts warn the company faces three “code red” structural risks: slowing subscription growth despite growing user numbers, rising substitute products, and the burden of huge planned infrastructure investments.
CRYPTO MARKET
In a CNBC analysis of the BTC recent price moves, the analysts are noting that Bitcoin has dropped nearly 30 % from its record high of about $126,000 in early October, a decline that some analysts see as normal volatility given its historical patterns of large drawdown after big rallies. The sell-off is being driven by weak liquidity, massive liquidations of leveraged positions, and a broader risk-off mood among investors; this has been exacerbated by outflows from spot Bitcoin ETFs and concerns over macroeconomic factors like interest rates and tightening liquidity. As a result, price action has become choppy, with technical support around the mid-$80,000s being closely watched. A break below could open the door to further downside, while renewed institutional demand or improved liquidity could stabilize or push prices higher.
The crypto market is evidently lagging behind the optimism exposed on US equity markets. Total crypto market capitalization decreased by 1% during the previous week, with an outflow of $23B. Daily trading volumes remained relatively flat w/w, trading around $219B on a daily basis. Total crypto market capitalization increase from the beginning of this year currently stands in a negative territory of -6%, with a total funds outflow of $206B.
Although the total crypto market lost around 1% during the previous week, not all coins were traded in a negative territory. While BTC lost 1% in value with an outflow of $18,6B, ETH managed to close the week positively, with an increase of 2%, gaining $7,4B in its market cap. Some of the higher weekly losers were ZCash, with a drop in value of 26,6%, DASH was traded down by 15,8%. AVAX lost 6,7%, XRP was traded down by 7,5%, SOL lost around 2% w/w. Few coins which were traded in green were LINK, gaining almost 8% w/w, SUI was traded higher by 5,7%, BNB closed the week by 2,2% higher.
Increased activity with circulating coins continues. This week SUI gained 1,3% new coins on the market, Filecoin added 0,3% of coins, while DOGE made an incredible increase of circulating coins by 6,3%. Such a course of action is not frequently seen by DOGE. The majority of other altcoins had an increase of 0,1% of circulating coins.
Crypto futures market
Crypto futures markets softened this week, reflecting a period of consolidation following recent volatility. Both Bitcoin and Ether futures traded lower across the curve, though the magnitude of the pullback remained moderate compared to prior weeks.
Bitcoin futures declined between 1.6% and 2.1% across maturities. The front-end (Dec 2025–Apr 2026) posted slightly smaller weekly losses, ranging from –1.61% to –1.78%, while the mid- to long-dated maturities (June 2026–Mar 2027) saw steeper declines of around - 2.14%. Prices remain in a relatively tight structure, indicating that despite short-term weakness, the curve is not pricing significant long-term deterioration in sentiment.
Ether futures were more resilient this week, with changes clustering around the flat to slightly negative range. Front maturities declined modestly by –0.62% to –0.81%, while the mid-curve stabilized, and the longer maturities (Sep 2026–Mar 2027) remained flat on a weekly basis. The Ether curve’s relative stability suggests buyers are stepping in at lower levels, reflecting firmer structural support compared to Bitcoin.

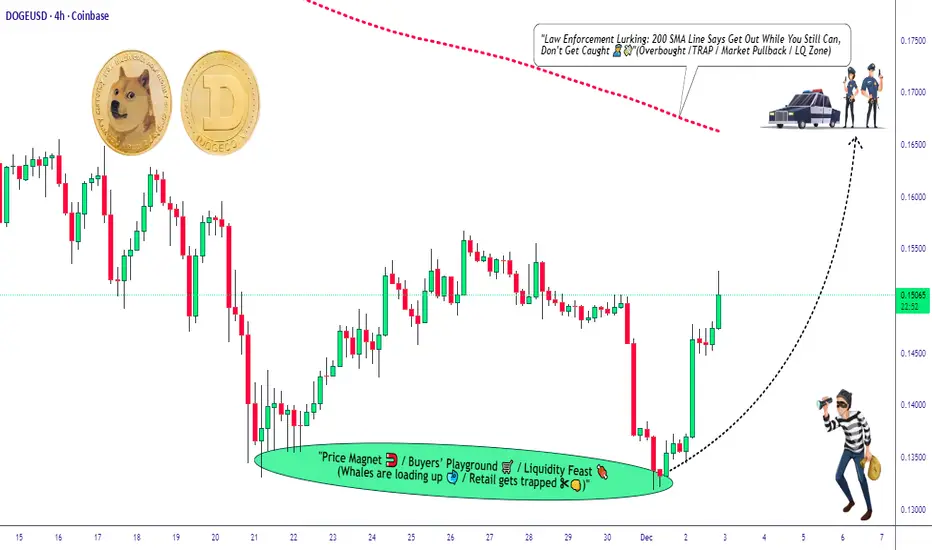
Is DOGE/USD Preparing for a Major Upside Move?🚀 DOGE/USD: ULTIMATE SWING TRADE BLUEPRINT 🚀
Catch the Rocket Before Liftoff!
🔥 WHY THIS SETUP IS FIRE
BULLISH MOMENTUM building on DOGE against the USD.
Key levels aligning for a potential SWING OPPORTUNITY.
Perfect for traders looking to RIDE THE VOLATILITY with a clear plan.
🎯 TRADE PLAN (BULLISH)
Entry: ANY PRICE – Flexibility is key! Scale in strategically.
Stop Loss: THIEF SL @ 0.14000 ⚠️
(Note: I’m not your financial advisor – adjust SL based on YOUR strategy & risk tolerance. Place SL ONLY after breakout confirmation!)
Take Profit: TP @ 0.16500 ✅
SMA acting as strong resistance + overbought signals = trap zone.
Escape with profits before the pullback!
(Reminder: TP is YOUR choice – take money at your own risk!)
📌 DEAR LADIES & GENTLEMEN (THIEF OG’s) 👑
This is a BLUEPRINT – not financial advice. Adapt it to YOUR style. Your money, your rules.
🔗 RELATED PAIRS TO WATCH
$BTC/USD – Crypto king moves, DOGE often follows sentiment.
$SHIB/USD – Meme coin sibling, correlation spikes during hype cycles.
$ETH/USD – Altcoin leader, influences broader crypto momentum.
SP:SPX (S&P 500) – Risk-on/risk-off cues can impact crypto flows.
💡 KEY CORRELATION INSIGHTS
DOGE often mirrors BTC’s direction with amplified volatility.
Meme coin rallies can be sector-wide – watch SHIB for confirmation.
USD strength (DXY) inversely affects crypto – a falling DXY = crypto bullish signal.
LIKE & FOLLOW if this resonates – boosts visibility for all!
COMMENT your entry & exit strategies – let’s build knowledge together.
SHARE to help fellow traders spot the opportunity.
📈 Stay smart, trade sharp, and manage your risk!
✅ Follow for more high-impact setups.
#DOGE #DOGEUSDT #Crypto #SwingTrade #TradingView #Memecoin #Bullish #TradingStrategy #Cryptocurrency #Bitcoin #Altcoins
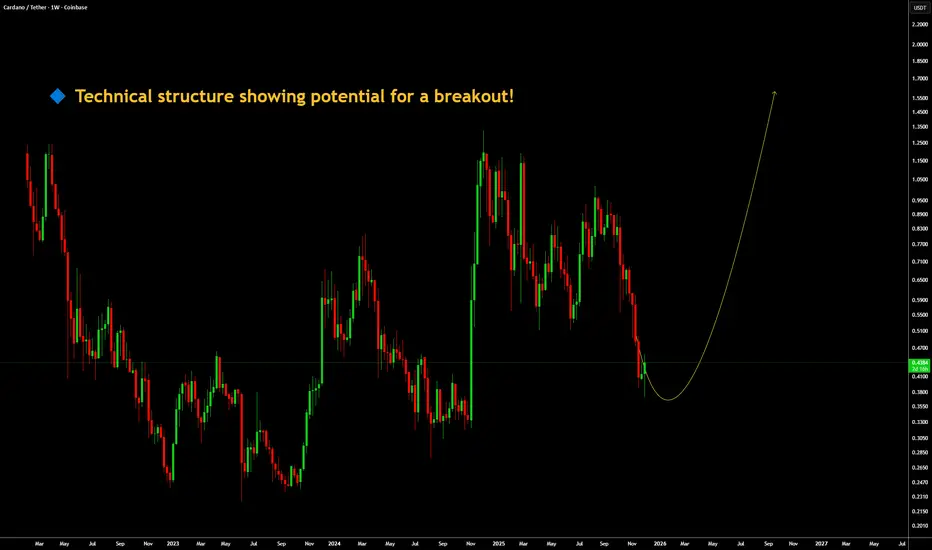
ADAUSDT - Technical structure showing potential for a breakoutWith COINBASE:BTCUSD and COINBASE:ETHUSD maintaining strong bullish structure and the broader crypto market showing renewed risk-on sentiment, COINBASE:ADAUSDT is positioned for a potential continuation to the upside from technical point of view and trend continuation setup.
Crypto markets historically perform well when liquidity conditions improve, and with the FED officially ending Quantitative Tightening (QT) and a rising probability of rate cuts, the macro environment is turning supportive for digital assets.
On top of that, ADA’s ecosystem growth, rising network activity, and strong technical structure suggest that ADAUSDT may be preparing for a high-probability move up.
Based on these combined factors, we expect ADAUSDT to push up and potentially target new short-term highs if momentum continues.
Always remember WTW 4 Golder Rules:
1) Do not jump in
2) Do not over risk/trade
3) Do not trade without Stop Loss
4) Never ever add to a losing position!
Trade with care
We Trade Waves
WTW Team
Disclosure: We are part of Trade Nation's Influencer program and receive a monthly fee for using their TradingView charts in our analysis.
EthereumETHUSD
- Falling Wedge as an corrective pattern in Long Time Frame
- Demand Zone
- Order Block
- Completed " 123 " Impulsive Waves
- Fibonacci Level - 38.20% / 50.00%

MARKETS week ahead: November 30 – December 6Last week in the news
As US macro data started to be released on a regular basis, investors turned their sentiment to a positive side in expectations that the Fed might cut interest rates by another 25 bps in December. The S&P 500 had its five-days positive streak, closing the week at 6.849. The same sentiment also pushed the price of gold toward the higher grounds, where the metal closed the week at $4.230. The 10Y US Treasury benchmark yields were holding around the 4,0% level. The crypto market is lagging behind the risk-off mode on traditional markets. BTC tried to move higher, reaching levels above the $92K, however, closed the week around the $90K.
Based on posted US data, the U.S. Producer Price Index (PPI) rose 0.3% in September, lifting the annual rate to 2.7%. Core PPI increased 0.1% m/m and 2.6% on a yearly basis. Retail sales edged up 0.1% in September, resulting in a 4.3% yearly increase, though the monthly figure came in slightly below the 0.3% forecast. Relatively weaker data increased investors' sentiment that the Fed might cut interest rates by another 25 basis points in December. Current odds, based on CME FedWatch Tool stands at 83%.
The price of gold continued to rise this week. A recent survey by Goldman Sachs of over 900 institutional investors found that more than 70% of them are expecting gold prices to rise over the next year. The expectations of 35% participants is that the gold price could surpass $5.000 per ounce by the end of 2026, while 33% expect a range between $4.500 and $5.000. The bullish outlook reflects strong demand from central banks and exchange-traded funds (ETFs), and growing investor interest amid macroeconomic uncertainty.
Although tech companies in the US were supported by the risk-off mode of investors, still Nvidia was lagging this run. As news is reporting, the Chinese company Baidu is emerging as a major competitor of the American company, after implementing export restrictions. Through its semiconductor unit in Kunlunxin, Baidu unveiled a multi-year roadmap that includes next-gen ships, designed for large scale AI training and inference. Baidu already sells chips to third-party data centre builders and powers its own AI services, which is perceived as a sign that it is positioning itself as a full-stack AI hardware and cloud provider in China.
News is reporting that the Peoples Bank of China (PBOC) reiterated its strict stance on cryptocurrencies, announcing a renewed crackdown on virtual currency activity, including stablecoins. The PBOC stated that virtual currencies “do not hold the same legal status as fiat currency” and banned their use as legal tender, calling any crypto-related business activity “illegal financial activity”.
The rating agency S&P Global downgraded Tethers stablecoin USDT from “constrained” to the lowest possible stability rating, “weak”. The downgrade stems from S&P’s concerns that USDT’s reserves now include a higher share of risky assets, including Bitcoin (about 5.6% of reserves), exceeding the over-collateralization buffer once considered sufficient. In addition, S&P flagged persistent “gaps in disclosure” around reserve valuation, custodians, and counterparty creditworthiness, raising doubts about the reliability of USDT’s backing.
CRYPTO MARKET
The US stocks reacted positively on an increased sentiment that the Fed might cut interest rates by 25 bps at December FOMC meeting. However, the crypto market is lagging behind the risk-off sentiment, while having only a modest upside correction. Investors are still in the wait-and-see mood, which might be changed in case that the Fed indeed cuts rates two weeks from now. Total crypto market capitalization was increased by 7% w/w, adding $196B to its total cap. The market was mostly driven by a surge in BTC value, but also other altcoins contributed. Daily trading volumes decreased this week to $203B on a daily basis, from $313B traded a week before. Total crypto market capitalization increase from the beginning of this year currently stands in a negative territory of -6%, with a total funds outflow of $183B.
BTC was the leading coin of the week, with a surge of more than 7% adding $122B to total market cap. ETH was following the lead, with an weekly increase of 8,7%, attracting $29B to its cap. XRP also had a good week, with a surge of 13,4%, and an increase in cap of $15,7B. From other leading coins, BNB increased its value by 5,4%, while Solana gained more than 6% w/w. Altcoin with a significant move was Maker, with a surge of 36% w/w, while Monero was traded by 14% higher from the end of the previous week. Stellar also had a good performance with a surge of 11%. On the opposite side was ZCash, with a drop in value of 11,3%, and only a few other altcoins which finished the week in red.
Increased activity with circulating coins continues. This week ZCash and Polkadot had a surge in the number of coins on the market by 0,6% each. IOTA increased the number of coins by 0,5% w/w. Filecoin and Stellar had an increase of 0,2%, while the majority of other altcoins increased the number of circulating coins by 0,1% w/w.
Crypto futures market
After several weeks of persistent declines, the crypto market staged a strong rebound, with both Bitcoin and Ether futures posting broadly higher prices across the entire curve. Bitcoin futures advanced between 7.1%–7.9% w/w, marking a robust recovery following the previous sharp drawdown. The front end of the curve, December 2025 through May 2026, led the move higher, gaining 7.6%–7.9%, indicating renewed demand for short- to medium-term exposure.
Long-term maturities also firmed, with Mar 2027 finishing the week at $99,005, up 7.11%.
The upward shift in the curve suggests improving expectations for market stabilization and a potential return of directional positioning after recent deleveraging.
Ether futures outperformed Bitcoin on a relative basis, rising 10.1%–11.6% across maturities. The strongest gains appeared at the front end, with January 2026 futures climbing 11.60%, followed closely by February 2026 at 11.52%. Although gains moderated slightly beyond mid-2026, the entire curve moved solidly higher, with March 2027 settling at $3,334, up 10.18% w/w. This suggests a sustained recovery in ETH sentiment despite ongoing volatility.
Overall, the futures market shows early signs of restoring confidence, with both assets retracing a significant portion of recent losses.
SOLUSDT /// 30NOVSolana has consistently shown resilience across multiple market cycles, repeatedly demonstrating its ability to establish new price structures and reach fresh targets. Despite this long-term strength, the asset is currently under notable selling pressure. With Bitcoin experiencing a 30% decline, interest from investors and smart money toward Solana has also cooled off.
From a structural perspective, the $149 level remains a significant resistance zone, while the $127 support area appears increasingly vulnerable and may be tested or even broken in the near term.
This brings up a key question for many market participants:
Where could Solana become attractive from an investment standpoint?
In my view, the $100 region is where I would personally begin reassessing Solana for potential long-term positioning—depending, of course, on how price approaches that level and the quality of market momentum at that time.
As always, broader market conditions will play a major role in determining whether Solana can regain strength or continues to consolidate under seller dominance.


ETH/USD – Potential Bullish Reversal from Extreme POI.Analysis:
The chart suggests Ethereum is currently trading inside a strong Extreme Point of Interest (POI) after a series of Breaks of Structure (BOSS) to the downside. Price has entered a demand zone that may trigger a bullish reversal.
Key observations:
Downtrend Structure: Multiple BOSS confirmations show sustained bearish momentum leading into the Extreme POI.
Extreme POI (Demand Zone): Price is consolidating inside a deep demand area marked in red, indicating potential accumulation by buyers.
POI Reaction Expected: If price maintains support here, a bullish reversal is likely.
Fair Value Gaps (FVG):
Two major FVGs above act as logical bullish targets for price inefficiency fill.
Projected Price Path:
The drawn projection suggests:
Short-term bounce from POI
Breakout structure upward
Continuation toward higher FVG fills around $2,962, $3,130, and possibly $3,192 – $3,220.
Bias:
▶ Bullish, as long as price remains above the Extreme POI.
A breakdown below would invalidate the setup and continue the downtrend.
This is a strong smart-money style setup with a clean narrative:
Demand → Break of structure → FVG fill → Higher targets.
