Bitcoin Dominance Breakdown Ahead? Altseason Signals Emerging!Analysis:
BTC Dominance is showing strong signs of weakness.
After a failed breakout and rejection from the upper boundary of the descending channel, dominance is now testing the short-term ascending trendline (orange).
Losing this level (~59%) could trigger a deeper drop toward 57% and possibly 54.5%.
Main scenario (65% probability):
🔻 Breakdown below 59% → bearish continuation → capital rotation into altcoins.
Alternative scenario (25%):
⚖️ Sideways movement between 59–61% before decision.
Bullish invalidation (10%):
🟢 Daily close above 61.5% → short-term BTC strength continuation.
Momentum and structure both favor downside — altcoins may soon take the lead.
Cryptopilot

Bitcoin - BTCUSDT – Daily NeoWave AnalysisStructure: Contracting Triangle (ABCDE)
Current Price: $108,985 (+1.3%)
🧠 Wave Structure Overview
Bitcoin’s daily chart is forming a Contracting Triangle pattern under NeoWave principles (Glen Neely).
This triangle appears to be part of a wave (4) correction within a larger impulsive cycle, consisting of subwaves A–B–C–D–E with well-balanced price and time proportions.
🔹 Wave Details
Wave A: Decline from 126K → 104K
Type: Impulsive start, setting the corrective tone.
Wave B: Sharp recovery to 123K (≈78.6% retrace of A)
Type: Zigzag – strong bullish response typical for triangles.
Wave C: Pullback to 106K, forming a 3-wave Flat correction.
Wave D: Rally to 118–119K, reaching 70% of wave B — perfectly proportional for a contracting structure.
Wave E: Final leg down toward 106K–107K, with diminishing momentum and volume — a textbook NeoWave E-wave behavior signaling triangle completion.
🔍 Technical Observations
Strong bullish divergence between price and RSI/OBV at the E-wave low.
Decreasing volume during wave E → confirms a terminal corrective phase.
Price remains above the long-term rising trendline and key demand zone near 106K.
🟢 Primary Scenario (≈70% Probability)
Triangle completed at E-wave (106K) → beginning of wave (5) to the upside.
Targets:
1️⃣ 115K–118K – short-term breakout zone
2️⃣ 123K–126K – retest of triangle resistance
3️⃣ 138K–145K – extended target if wave (5) unfolds impulsively
🔴 Alternative Scenario (≈30% Probability)
If BTC breaks below 106K, wave E may extend deeper toward 102K–100K, forming a Running Triangle E before a strong bullish reversal.
⚙️ Summary
✅ Current pattern: Contracting Triangle (ABCDE)
✅ Position: End of wave E of (4)
📈 Expectation: Start of wave (5) impulsive advance
⚠️ Invalidation: Daily close below 102K
Conclusion:
BTC is likely completing a major corrective phase. Holding above 106K keeps the bullish breakout scenario valid — watch for a decisive move above 111K–112K to confirm the next impulsive leg.

USDT Dominance — Is the Market Ready for a Relief Rally?After several days of steady climb, USDT dominance has now broken below its ascending support line — a potential signal that risk appetite may return to the crypto market.
The chart shows a clear short-term shift in momentum:
• The dominance failed to sustain above 5.15%, forming a local top.
• A clean breakdown from the channel has opened the path toward key liquidity supports, highlighted by the yellow zones between 4.95% → 4.75%.
• These areas represent potential reversal zones, where stablecoin capital might start rotating back into altcoins.
If dominance continues to drop toward these supports, we could see altcoins begin a short-term recovery phase — especially those with strong structure and volume base.
⚠️ Invalidation:
A return and hold above 5.15% would invalidate this scenario and suggest further consolidation before any major move.
⸻
📊 Summary:
USDT.D heading toward key supports → Possible rotation into risk assets (alts).
Stay alert for bullish confirmation signals on ALTs as dominance approaches the yellow zones.

Is Altseason About to Begin?The market structure suggests we’re currently in wave C of the second corrective wave (2) — and it looks close to completion.
A potential ending diagonal and bullish divergence on momentum indicators signal exhaustion among sellers.
At the same time, Bitcoin dominance is testing a key resistance zone — a level where liquidity often starts rotating into altcoins.
📈 If the current low holds, we could be witnessing the early stages of wave 3 — the impulsive phase where altcoins usually outperform Bitcoin.
🟢 Base scenario: Correction ending → beginning of a new bullish phase
🔴 Alternative scenario: Breakdown of the current low → completion of a W–X–Y structure

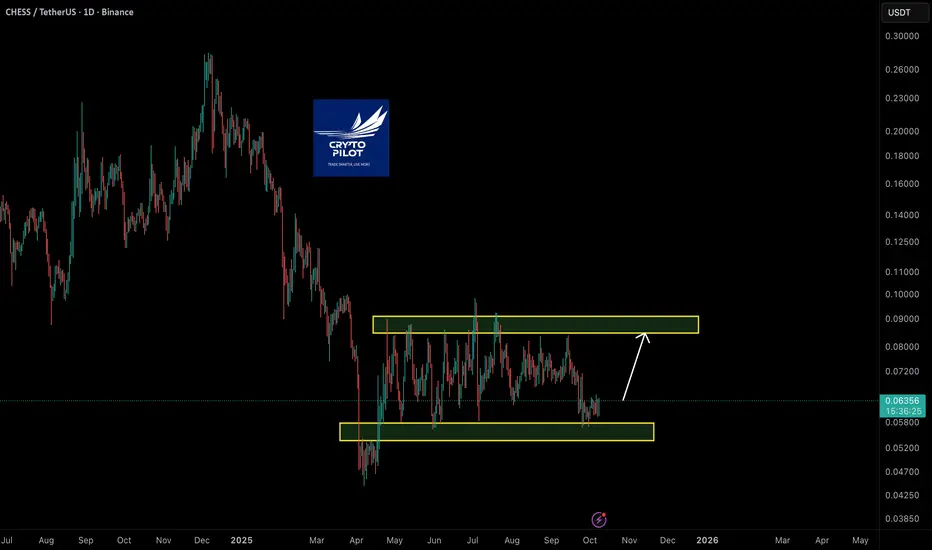
CHESS — Accumulation Range Before a Potential ReversalAfter months of sideways consolidation, CHESS continues to move within a well-defined accumulation range between $0.055 – $0.095.
Price recently tested the lower boundary and has shown a bullish reaction, suggesting that buyers are once again defending this key demand zone.
Key Levels:
• 🟢 Support: $0.055 – $0.060 (accumulation area)
• 🔶 Resistance: $0.085 – $0.095 (range top / potential breakout zone)
If the current bounce holds, CHESS may target the upper boundary of the range — and a confirmed breakout above $0.095 could open the path toward $0.12 and higher.
This structure still favors range trading until a clear breakout occurs, but the risk/reward from the lower zone remains attractive.
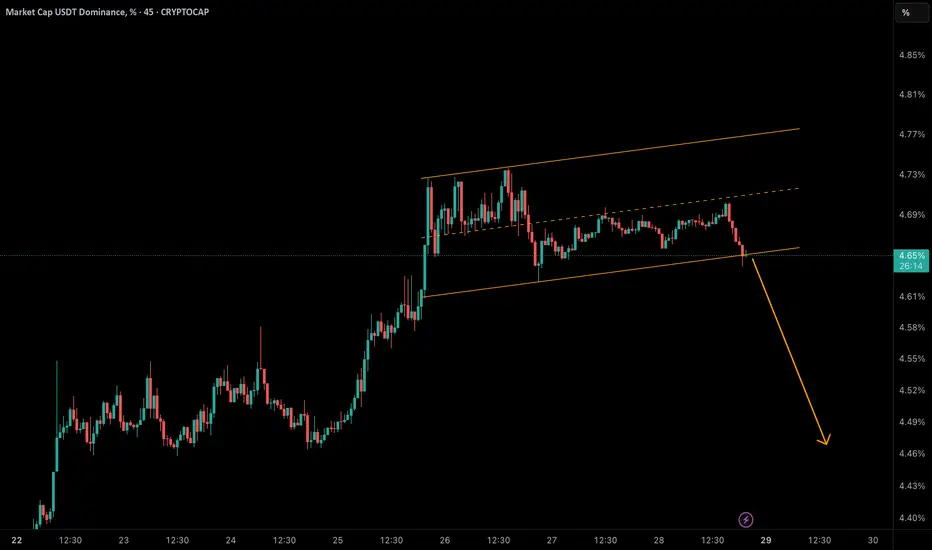
USDT Dominance at a Critical Breakout Point!USDT dominance has touched the bottom of its rising channel near 4.65%.
• 🔻 A breakdown below this support could trigger a correction toward 4.58% → 4.50% → 4.45%.
• 🟢 But if buyers defend this zone and reclaim 4.70%, we may see another push toward 4.75% – 4.77%.
📈 Why it matters: Falling USDT dominance often signals liquidity flowing back into crypto & altcoins, potentially sparking short-term rallies.
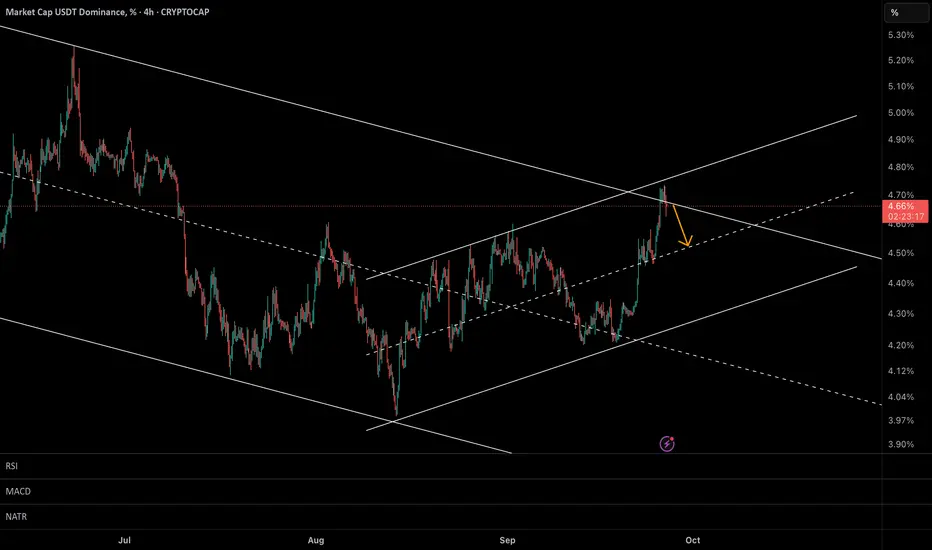
USDT Dominance at a Critical Turning Point–Will Correction BeginIn my previous analysis, I highlighted that USDT dominance had likely completed a 5-wave Elliott structure around 4.60%–4.65%, suggesting that a corrective ABC decline could follow.
That call played out accurately, with dominance stalling right at the projected resistance zone.
🔎 Current Update:
• Price has now hit the top of the larger descending channel as well as the upper boundary of the short-term rising channel → creating a confluence resistance near 4.70%.
• This level remains a high-probability reversal zone.
📊 Scenarios:
• 🔻 Bearish (More Likely):
Rejection from 4.65%–4.70% could confirm the corrective ABC pattern, targeting 4.30%–4.20% next.
👉 This would signal capital rotation back into crypto & altcoins.
• 🟢 Bullish (Alternative):
A confirmed breakout above 4.70% would open the door toward 4.90%, extending pressure on the crypto market.
⸻
📌 Conclusion:
Given the technical confluence, the odds still favor a pullback in USDT dominance, which could give altcoins some room to breathe in the coming sessions.
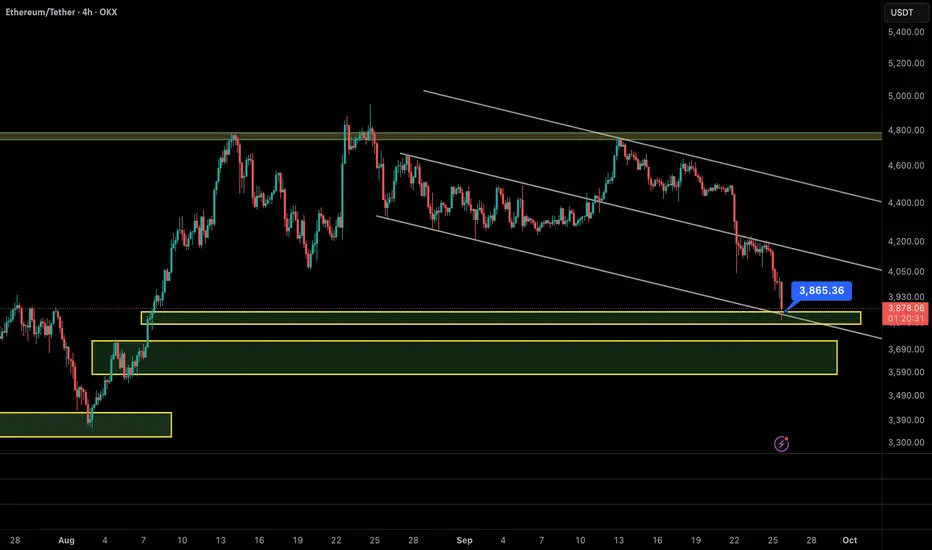
Ethereum (ETH/USDT, 4H) – Bounce Setup After Textbook Drop In my previous analysis, I highlighted the $4,700–$4,800 zone as a critical resistance cluster. ETH was rejected exactly from $4,720 and dropped sharply to $3,850, just as projected. ✅
⸻
🔎 Current Outlook:
• ETH has now reached the lower boundary of its descending channel.
• Price is sitting right on the $3,850 support zone, where buyers are showing early signs of activity.
• Momentum indicators suggest that the downside pressure may be exhausting, increasing the probability of a relief rally.
⸻
📊 Scenarios:
🔸 Bullish Reversal (more likely):
If $3,850 holds, ETH could rebound toward:
• First target: $4,100–$4,200
• Extended target: $4,400
🔸 Bearish Case (alternative):
A clean breakdown below $3,850 would expose the next demand zone at $3,600–$3,700.
⸻
📌 Conclusion:
After a sharp and accurate rejection from $4,720, Ethereum is now testing strong support at $3,850. Given the confluence of channel support and demand, the odds favor a bounce scenario over continued downside.
USDT Dominance Hits Channel Top – Correction Ahead?USDT dominance has reached the top of its channel, completing a potential 5-wave Elliott structure. This suggests that a corrective ABC pattern may follow.
• 🟢 Key Resistance: 4.60% – 4.65%
• 🔻 Expected Correction: toward 4.20% – 4.30%
• 📈 Market Impact: A decline in USDT dominance often means capital flowing back into crypto & altcoins.
If this scenario plays out, we could see altcoins breathing again in the short term.

Bitcoin Dominance at Channel Resistance – Reversal Ahead?Bitcoin dominance (BTC.D) has reached the top of its ascending channel around 58.5%, which is acting as a strong resistance.
🔹 Main Scenario (More Likely):
A rejection from this resistance zone could trigger a pullback toward 57.8% – 58%, giving some relief to altcoins in the short term.
🔹 Alternative Scenario:
If BTC.D manages to break and hold above 58.5%, the next upside target would be around 59%.
⚖️ Conclusion:
• Current levels are risky for further upside.
• Probability of a correction is higher.
• This setup may favor altcoin outperformance if dominance drops.

USDT Dominance Hits Major Resistance – What’s Next for Crypto?📊 On the 4H timeframe, USDT dominance (USDT.D) is approaching the 4.60% – 4.70% resistance zone, a level that has repeatedly triggered strong rejections in the past.
🔹 Primary Scenario
A rejection from this resistance is the more likely outcome. If confirmed, it could signal a bullish move for Bitcoin and altcoins as capital flows back into risk assets.
🔹 Alternative Scenario
If USDT.D manages to break and hold above 4.70%, this would indicate risk-off behavior in the market, potentially leading to increased selling pressure on crypto assets.
⚖️ Summary:
• 🔻 Rejection at resistance → Positive signal for crypto rally
• 🔺 Break & hold above 4.70% → Warning of further downside in crypto

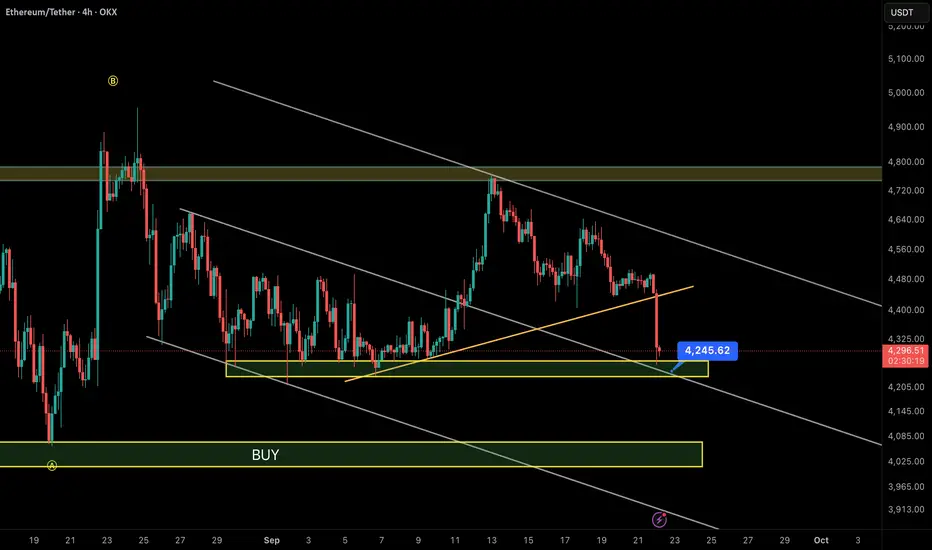
Ethereum at Critical Support – What’s Next?📊 ETH/USDT – 4H Chart Analysis
1️⃣ Descending Channel:
Ethereum is still moving inside a clear descending channel. Sellers remain in control as every rally to the channel top has been rejected.
2️⃣ Trendline Break:
The short-term ascending trendline (orange) has just been broken with strong selling pressure, dragging the price into the $4,200 – $4,250 support zone.
3️⃣ Key Support Zone:
The first major support lies at $4,200 – $4,250. If this level holds, ETH could see a short-term rebound toward $4,400 – $4,600.
4️⃣ Main Buy Zone:
If $4,200 fails, the next strong demand zone sits at $3,950 – $4,100, aligning with the lower boundary of the descending channel. This is where stronger buying interest is expected.
5️⃣ Resistance Levels:
• Near-term: $4,450 – $4,600
• Major: $4,750 – $4,800
⚖️ Summary:
• Bullish scenario: Holding $4,200 → bounce to $4,400 / $4,600.
• Bearish scenario: Losing $4,200 → drop to $4,000 – $3,950 (main BUY zone).
👉 At this stage, trading in the middle of the channel is risky. Safer entries come either near $4,000 – $4,100 or after a confirmed breakout above $4,600.
USDT Dominance (USDT.D) Analysis📊 Currently, USDT dominance has reacted negatively after testing the 4.33% – 4.35% resistance zone along with the descending trendline. This area is acting as a supply zone, strengthening the probability of further downside.
🔻 If the resistance holds, we expect USDT.D to enter a bearish leg, first targeting the 4.25% level, and then potentially extending toward the key support zone at 4.20% – 4.21%.
⚡ Alternative Scenario: If a strong candle closes above 4.35%, further upside toward the 4.45% region could be seen. However, as long as price remains below resistance, the bearish outlook remains more likely.
📌 Summary:
• Key Resistance: 4.33% – 4.35%
• Main Supports: 4.25% and 4.20%
• Primary Scenario: Continuation to the downside toward 4.20% if resistance holds

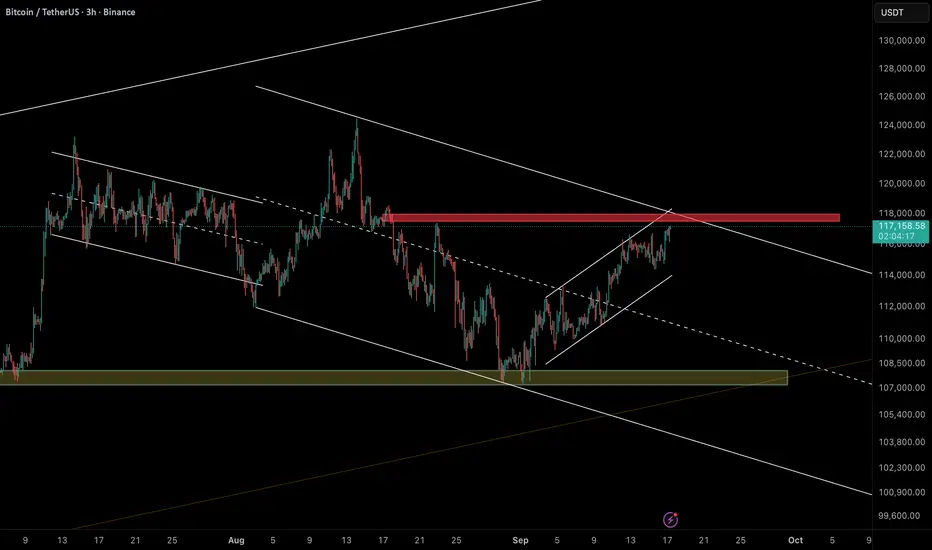
Bitcoin at Critical Resistance – Reversal or Breakout?Bitcoin (BTCUSDT – 3H) is testing the 117.5k – 118k resistance zone, which coincides with the upper boundary of the descending channel.
So far, this level has acted as a strong rejection zone several times.
🔎 Key Insights:
• Structure: Price has formed a rising channel/wedge, often seen as a corrective bearish pattern.
• Resistance: 117.5k – 118k (major supply zone + channel top).
• Supports:
• 114k (short-term channel support)
• 107k – 108k (major support zone + channel bottom).
📌 Scenarios:
• Bearish (more likely): Rejection from 118k → downside targets at 114k and 107k – 108k.
• Bullish (alternative): Break & close above 118k → potential rally toward 122k – 124k.
⚠️ As long as BTC stays below 118k, downside risks remain higher.
USDT Dominance on Thin Ice – Breakdown Likely AheadThe USDT dominance chart remains trapped inside a descending channel, with the key resistance sitting around 4.40%.
Despite short-term bounces, the structure still favors a bearish continuation.
The critical support zone lies at 3.85% – 3.70%, which is the most likely target if dominance fails to break above 4.40%.
🔑 Key Points:
• Main resistance: 4.40% – 4.60%
• Bearish target: 3.85% – 3.70%
• Overall structure still bearish unless 4.60% is reclaimed.
👉 A breakdown here would be bullish for altcoins, as money flows out of USDT.

Ethereum at a Critical Resistance Zone – Will $4,800 Hold or Bre📝 Analysis:
Ethereum (ETH/USDT, 4H) is testing a critical resistance zone at $4,700–$4,800, where several technical factors converge:
1. Descending Channel:
Price is touching the upper boundary of the long-term descending channel.
2. Fibonacci Extension:
The recent rally has reached the 1.618 Fibonacci extension (~$4,720), which often acts as a potential reversal zone.
3. Resistance Cluster:
The $4,700–$4,800 area combines both static resistance and the channel top, making it a high-risk region for buyers.
4. Wave Structure:
The strong rally from ~$4,050 could be part of a corrective wave (possibly Wave D). If ETH fails here, we may see a sharp pullback.
⸻
📊 Scenarios:
🔸 Bearish Case (more likely):
Rejection from $4,720–$4,800 could trigger a correction toward:
• First support: $4,580–$4,600
• Key support: $4,100–$4,200
🔸 Bullish Case (conditional):
A daily close above $4,800 would confirm a breakout from the channel, opening the door for targets at:
• $4,950–$5,000
⸻
📌 Conclusion:
ETH is at a make-or-break level. Failure to hold above $4,800 could bring a strong correction, but a confirmed breakout may fuel a run toward $5,000.

Critical Moment for Tether Dominance – Will Wave (D) Crash the MThe chart shows that Tether Dominance is moving inside a descending channel. Based on the wave count, it seems that wave (C) has just been completed, and now we may expect a sharp wave (D) rally. Such a move could trigger a fast market downturn, as rising USDT dominance usually pressures crypto assets.
⚠️ The key condition is whether the channel bottom, which also aligns with a major order block, holds.
• If it holds → wave (D) up, strong bearish pressure on crypto.
• If it breaks → continuation of the downtrend in dominance, allowing altcoins to recover.
📊 Summary:
• Wave (C) completed
• Potential strong wave (D) up → bearish for crypto
• Condition: channel bottom must hold

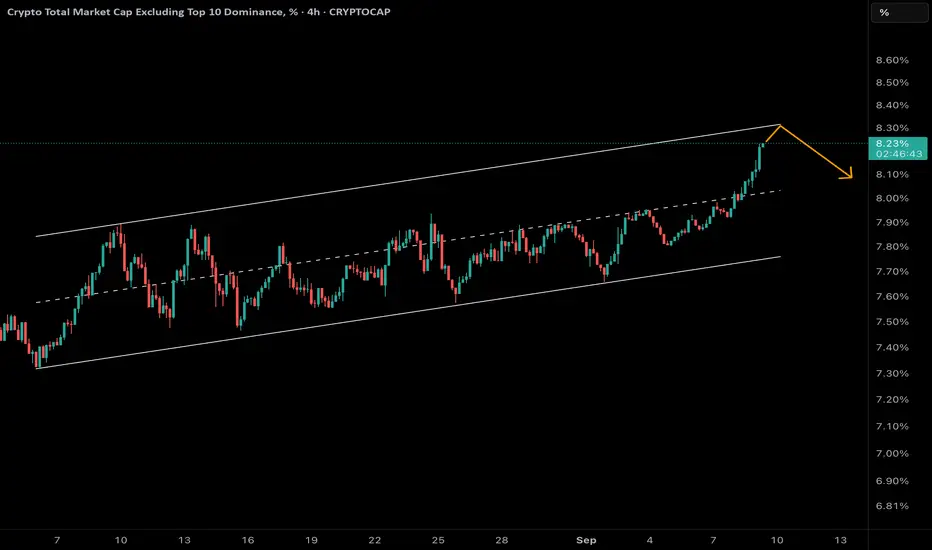
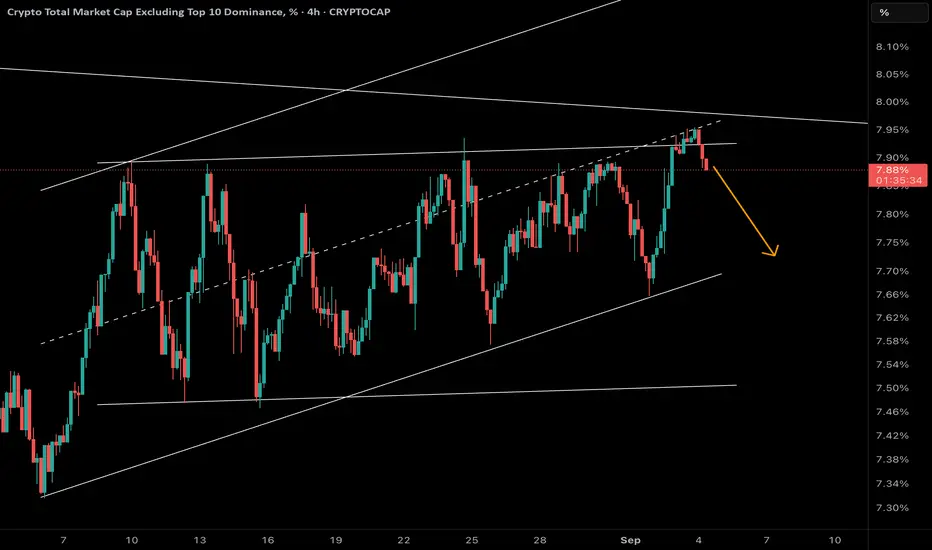
Altcoins on the Edge: Will “Others” Dominance Get Rejected?The Others Dominance chart is moving within an ascending channel and is now approaching the channel’s upper boundary.
The 8.31% level is acting as a key resistance near the top of the channel.
✅ A likely scenario is a rejection from this zone, which could trigger a downward correction in dominance.
📉 This would translate into negative volatility for altcoins, as the dominance of smaller-cap coins tends to drop after reaching such resistance levels.
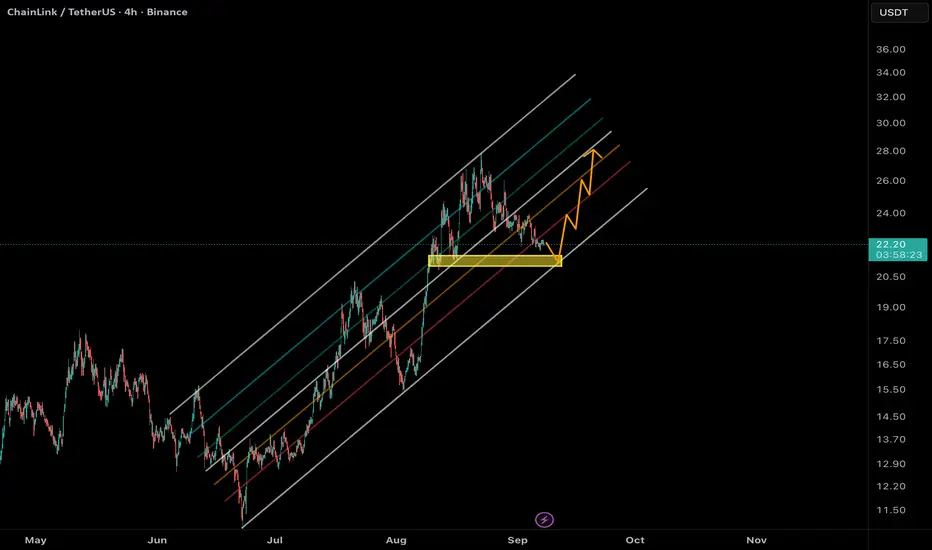
Chainlink (LINK/USDT) AnalysisLINK is currently trading around $22.2.
According to the ascending channel structure, if the price pulls back to the channel support near $21.4, we could expect a potential bullish reaction from this level.
🎯 Possible upside targets in case of a rebound:
• $23.8
• $26
• $28
⚠️ However, if the $21.4 support fails to hold, a deeper correction toward $20 may occur.
Ethereum (ETH/USDT) – Neowave UpdateEthereum continues to move inside a short-term descending channel. Based on the Neowave count, the current structure can be interpreted as wave G of a Diametric pattern.
🔑 Main Scenario:
• If ETH manages to hold above 4315, buyers could regain control.
• In that case, a move toward the channel’s upper boundary around 4410 is likely, completing wave G of the Diametric.
⚠️ Alternative Scenario:
• Failure to sustain above 4315 will keep the bearish tone intact.
• In this case, ETH may retest the lower boundary of the channel, with possible extensions toward 4200–4150.
📌 Conclusion:
Ethereum is at a decision point. A confirmed breakout above 4315 opens room for a rally to 4410, while rejection from this level could extend the corrective phase lower.

Altcoins Under Pressure–Others Dominance Rejected at Channel TOPOthers Dominance has just reacted negatively after touching the upper boundary of its rising channel and aligning with the midline of a larger channel. This confluence has triggered a bearish rejection.
📉 Likely Scenario:
If this rejection holds, Others Dominance could decline toward the channel bottom near 7.7%, signaling increased selling pressure on altcoins.
⚡ Conclusion:
As long as the resistance zone holds, the short-term outlook remains bearish. A clean breakout above resistance would be needed to shift this bias.
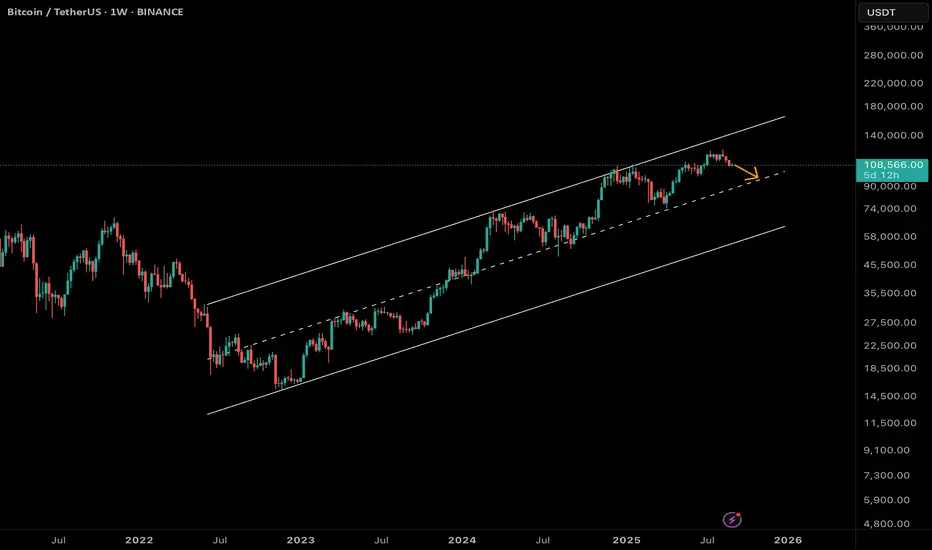
Bitcoin Weekly Outlook – Possible Pullback to $98K MidlineBitcoin is still moving inside its long-term ascending channel. After testing the upper boundary near $120K+, the price showed rejection and is now heading lower.
📊 Key Observations:
• BTC has respected this parallel channel since early 2023.
• The rejection from the upper boundary suggests a healthy correction inside the trend.
• The most logical target for this pullback is the channel’s midline (~$98K).
• As long as BTC holds above this level, the broader uptrend remains intact.
⚡ Conclusion: A controlled correction to ~$98K should not be seen as a bearish reversal, but rather as a structural retest within the bigger bullish channel. A weekly close below $98K, however, could open the way for a deeper correction toward $85K.
USDT Dominance Update – Market at a Turning PointUSDT Dominance got rejected from the 4.55% – 4.60% resistance zone and is now consolidating right on the dynamic yellow trendline and the white diagonal support.
📊 Key Points:
• This area is a critical decision zone.
• Holding above support could trigger another push toward 4.55–4.60%.
• But a clean breakdown below 4.44% may open the way to 4.35% – 4.30%, which would be very bullish for altcoins.
⚡ Conclusion: USDT dominance is at a major crossroad – the next move will likely define the short-term direction for both Bitcoin and altcoins.
