16,532% growth in just 37 days! A new star in the crypto world!MYX Finance: Understanding the Crypto Star that Soared Over 16,000%
BINANCE:MYXUSDT.P
In the fast-moving world of cryptocurrency, stories of incredible growth often capture our imagination. Recently, a new star has emerged, producing a truly breathtaking performance. In just 37 days, the MYX Finance token (MYX) experienced a massive price increase of over 16,532%. This kind of rocket launch makes everyone ask two simple questions: What is MYX Finance, and how did its price rise so fast?
This article is your guide to understanding this exciting story. We will explore what makes MYX Finance a special project in the crypto universe. Then, we will uncover the key reasons behind its recent, explosive growth. This is more than just a story about numbers; it’s a look into the innovation and energy that makes the world of digital finance so exciting.
Part 1: What is MYX Finance? A Simple Guide to a Powerful Platform
Before we understand why MYX grew so quickly, we first need to understand what it is. At its heart, MYX Finance is a new type of crypto trading platform designed to be powerful, fair, and easy for everyone to use.
The Best of Both Worlds - A New Kind of Crypto Market
In the crypto world, there are two main types of exchanges. Centralized Exchanges (CEXs) are like big, traditional banks. They are fast and easy to use, but you have to trust them to hold your money safely. Decentralized Exchanges (DEXs) are more like a community market. You always control your own money, but they can sometimes be slower and more complicated. MYX Finance combines the best features of both. It’s a DEX, so you always have control of your funds, but it’s designed to be as fast and easy to use as a CEX. It achieves this with a special system that lets trades happen instantly and with a feature they call “zero-slippage.”
The Magic of "Zero-Slippage"
Imagine you want to buy a crypto token for $100. On many platforms, by the time your order is processed, the price might have changed to $101. That $1 difference is called “slippage.” It can be very frustrating for traders. MYX Finance has built a system to eliminate this problem. Zero-slippage means the price you see when you click “buy” is the exact price you get. This makes trading fairer and more predictable, which is a huge advantage for traders of all levels.
More Than Just Trading - A Multi-Chain Universe
MYX isn't limited to just one blockchain. It operates across more than 20 different chains, including popular ones like Ethereum, BNB Chain, and Arbitrum. This means users can trade a huge variety of tokens without having to move their funds between different platforms, saving them time and money.
Part 2: The Perfect Storm: Four Key Catalysts for Explosive Growth
A 16,532% price increase doesn't happen by accident. It takes a “perfect storm” of technology, timing, and community excitement. For MYX, four main factors came together to create this incredible rally.
Excitement for the V2 Upgrade: Before the big price surge, there was a lot of positive talk in the MYX community about a major platform upgrade called V2. This upgrade promised to make the platform even better, faster, and more powerful, creating a strong foundation of positive sentiment.
Major Exchange Listings: The real explosion began when the MYX token was listed on popular crypto exchanges, especially Binance Alpha. This exposed the token to millions of new potential buyers. In one day, trading volume surged by 710%, reaching an incredible $354 million.
The "Short Squeeze": When the price started to rise, traders who had bet against the token (shorting) were forced to buy it back to cover their losses. This created a rapid buying frenzy called a “short squeeze.” In just 24 hours, over $14.6 million in these short positions were liquidated, adding even more fuel to the rally.
Industry Recognition and Awards: Finally, MYX Finance received a prestigious award from the BNB Chain, one of the biggest networks in crypto. They were named a “Volume Powerhouse,” which served as a powerful endorsement and gave new buyers more confidence in the project.
Part 3: The Big Picture - Why This Matters for Crypto
The story of MYX Finance is more than just one token's success; it shows us some important trends in the world of crypto.
Innovation Matters: MYX didn’t just grow because of hype; it grew because it offers a genuinely better trading experience with its zero-slippage feature. This shows that projects with strong technology can achieve incredible things.
The Power of Community: The excitement and support from the MYX community played a huge role in its success. In decentralized finance, a strong community is one of the most valuable assets a project can have.
Opportunity Still Exists: It reminds us that the crypto market is still young and full of opportunity. While there are always risks, stories like MYX show that there is still massive potential for growth.
Conclusion: Your Adventure in the World of Crypto Begins
The incredible 37-day journey of MYX Finance is a powerful reminder of how dynamic and exciting the world of digital assets can be. We’ve seen how a project with innovative technology, strong community support, and perfect timing can capture the attention of the entire market.
As the Founder of ForecastCity and the creator of the 4CastMachine AI software, my mission is to help traders navigate this exciting market with better tools and insights. The crypto world is full of opportunities like this one. To stay ahead of the curve and continue your learning journey, make sure to follow me! Let's explore the future of finance together.
Frequently Asked Questions (FAQs)
What is MYX Finance in one sentence?
MYX Finance is a next-generation decentralized exchange (DEX) that makes trading crypto fast, easy, and fair by offering zero-slippage trading across more than 20 different blockchains.
What does "zero-slippage" mean?
It means the price you see when you make a trade is the exact price you get, which prevents you from losing money to sudden price changes during your transaction.
Why did the MYX token price rise so fast?
It was a "perfect storm" of four main factors: excitement for a major platform upgrade (V2), listings on popular exchanges like Binance, a "short squeeze" that forced rapid buying, and a prestigious award from BNB Chain that boosted confidence.
Is MYX a good investment?
Like all cryptocurrencies, MYX is a high-risk, high-reward asset. Its recent performance has been incredible, but the market is very volatile. This article is for educational purposes, and you should always do your own research (DYOR) and assess your personal risk tolerance before investing.
For ongoing analysis and to discover more exciting projects in the crypto space, don't forget to follow me!
Trade Smart!
Navid Jafarian
Cryptos

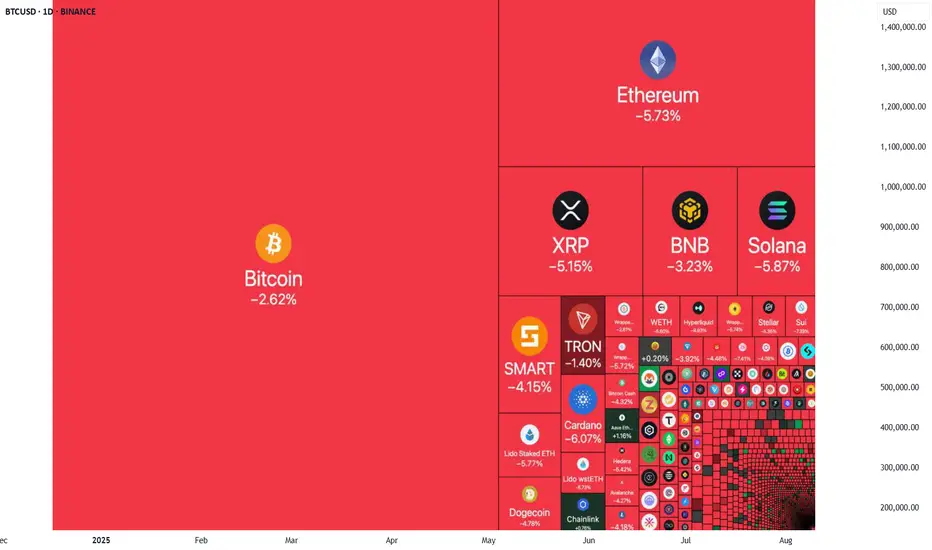
Why Is Crypto Tumbling? A Trader's Guide to the Recent Sell-OffWhy Is Crypto Tumbling? A Trader's Guide to the Recent Sell-Off 📉
🚨 If you're watching the markets today, you've seen the sea of red. Bitcoin, Ethereum, and major altcoins have experienced a significant pullback, leaving many to wonder about the cause.
While sharp drops can be unsettling, for the strategic trader, they are critical moments to analyze, not to panic. The current downturn isn't random; it's driven by a convergence of clear geopolitical, technical, and macroeconomic factors.
Here’s a breakdown of what’s happening behind the charts:
1. Geopolitical Uncertainty 🌐
High-stakes diplomatic meetings are underway involving the US, EU, and Ukrainian leaders to discuss the Russia-Ukraine peace deal. Markets inherently dislike uncertainty. As traders await a clear outcome, many are de-risking their portfolios, leading to selling pressure on assets like cryptocurrencies.
2. A Healthy Market Reset 📊
The crypto market just came off a powerful rally where many assets saw gains of 50-100%. This rapid rise led to a buildup of high-leverage positions. Today's dip is forcing a "leverage flush," liquidating over-extended traders. While painful for some, this is a standard market mechanism that washes out speculative excess and often creates a more stable foundation for future growth.
3. Shifting Macroeconomic Tides 📉
Just a week ago, a September interest rate cut was seen as a certainty. Now, recent economic data has slightly lowered those odds. Financial markets, including crypto, are incredibly sensitive to central bank policy. The market is now pricing in this small but significant shift in expectations, contributing to the downward pressure.
The Trader's Perspective: Opportunity in Volatility 💡
So, what does this all mean? It underscores a core principle of successful trading: volatility has a source.
For the prepared trader, this isn't a signal to abandon ship. It's a signal to consult your strategy. This is precisely the kind of environment where a clear, data-driven forecast becomes invaluable.
By understanding the root causes of the sell-off, you can better anticipate market structure, manage risk, and identify potential zones of support where "smart money" may begin to re-accumulate.
This is where the difference between a professional and a novice trader becomes clear. Experienced traders welcome every correction or pullback in the market, seeing it as an opportunity to re-enter and profit from the next upward wave. 📈
Therefore, instead of worry and stress, shift your focus to finding key reversal points and defining new entry zones (Watchboxes) for future trades at more attractive prices. View this price correction as a strategic opportunity, not a threat. 🚀
What are your thoughts on this pullback? Are you seeing it as a risk or an opportunity? Let's discuss in the comments. 👇
Trade Smart!
Navid Jafarian
Solvery IG Predicts Bitcoin to Reach $105,000 by May 10, 2025The cryptocurrency market continues to surprise even the most seasoned investors. Against this backdrop, the analytical firm Solvery IG has released an ambitious forecast: according to their calculations, Bitcoin's price could reach $105,000 by May 10, 2025.
Factors Supporting Bitcoin's Growth
In recent months, the market has shown strong positive momentum. Several key factors have contributed to this trend:
Institutional Investments: Major banks, funds, and corporations are increasingly incorporating Bitcoin into their portfolios as a hedge against risks.
Macroeconomic Instability: Inflationary pressures and weakening fiat currencies are driving investors to seek alternative assets.
According to Solvery IG experts, it is the combination of these factors that creates a "perfect storm" for the continued growth of the leading cryptocurrency.
Analysis and Potential Risks
Despite the optimistic forecast, potential threats should not be overlooked. The cryptocurrency market remains highly volatile. Possible tightening of regulations in the U.S. and Europe, as well as sudden shifts in Federal Reserve policies, could exert downward pressure on the market.
Nevertheless, Solvery IG highlights a crucial technical point: according to their data, Bitcoin has successfully held above key support levels between $60,000 and $65,000. This indicates strong buyer sentiment and supports expectations for a continued upward trend.
The impact of the halving event, which occurred in April 2024, should also be taken into account. Historically, Bitcoin has shown significant growth 12–18 months following a halving, and the current market behavior aligns closely with these cyclical patterns.
What This Means for Investors
If Solvery IG’s forecast comes true, Bitcoin would achieve more than a 50% increase compared to current levels. This presents significant opportunities for long-term investors. However, experts advise exercising caution, diversifying risks, and avoiding allocating all funds to a single asset.
Cryptocurrencies remain high-risk instruments, and successful investing requires a deep understanding of the market and a realistic assessment of all potential scenarios.
Conclusion
Solvery IG’s prediction of Bitcoin reaching $105,000 by May 10, 2025, sounds promising, especially given the positive momentum in recent months. However, investors should always remember: high returns come with high risks.

Divergence - asset price directionDivergence is the discrepancy between the direction of an asset's price and the readings of an indicator. There are three types of divergences: classical, extended, and hidden. The first two can be used to gauge market sentiment and to trade in the opposite direction. Hidden divergence, however, is more significant and can serve as a powerful supplementary factor in determining the price direction and opening positions.
The use of extended divergence is not necessary, as it rarely occurs and forms at equal highs or lows. In such cases, an indicator is not needed to gauge market sentiment; the chart itself will suffice.
Classical Divergence
Classical divergence indicates a potential trend reversal or the beginning of a correction. Bullish classical divergence is identified when a lower low (LL) forms on the chart while a higher low (HL) appears on the indicator.
The masses buy when classical bullish divergence appears, anticipating significant growth. An upward price movement may begin, but after short-term liquidity for buying is exhausted and the price rebalances, a reversal will occur, and the decline will continue. Long positions opened during the correction will become unprofitable. In a bear market, classical bullish divergence typically appears before the start of a correction.
Bearish classical divergence is identified when a higher high (HH) forms on the chart while a lower high (LH) appears on the indicator.
The masses sell when classical bearish divergence appears, expecting a significant decline. A downward price movement may begin, but after short-term liquidity for selling is exhausted and the price rebalances, a reversal will occur, and the growth will continue. Short positions opened during the correction will become unprofitable. In a bull market, classical bearish divergence typically appears before the start of a correction.
The formation of multiple divergences is common. The masses will seize every opportunity to open their positions, leading to unprofitable outcomes. The number of divergences before the start of a correction is not limited. It is recommended to wait for the price to react after reaching the resistance zone. In the example above, the correction began after partially filling the imbalance on the 1D timeframe within the imbalance on the 1W timeframe.
Hidden Divergence
Hidden divergence serves as a confirmation of trend continuation.
Bullish hidden divergence is identified when a higher low (HL) forms on the chart and a lower low (LL) appears on the indicator.
In an uptrend, hidden bullish divergence may form before the continuation of growth, acting as a strong supplementary factor in determining the future price direction and considering positions.
Bearish hidden divergence is identified when a lower high (LH) forms on the chart and a higher high (HH) appears on the indicator.
In a downtrend, hidden bearish divergence may form before the continuation of the decline, acting as a strong supplementary factor in determining the future price direction and considering positions.
Notes
- The RSI (Relative Strength Index) indicator is used to identify divergences.
- RSI is plotted without considering candle shadows.
- Divergence should be viewed as an additional factor to your analysis, not a standalone tool.
- Divergence below the chart will always be bullish, while divergence above the chart will always be bearish.

Trading Lesson 👨🏫#2 - Understanding Consolidations in CryptoIn today's lesson I will explain the difference in consolidations.
Some of you are new to the market and are probably wondering what's happening exactly when it's not moving in price and when it's moving down more than up but would later return to the last price it was.
Well to best answer that question.
It's called consolidation:
It's a thing that happens in the crypto market where waves of prices fluctuate up and down calculating the sells and buys of the market until it meets a point of exit - after consolidating the actual price of the market you're in, and only has two places it can go.
There are two types of consolidation.
The first is where it does a price correction where you have rapid 📉drops or rapid 📈rises.
An lastly is a repeated wave🏄🏼♀️ that can run in the same location for a few hours, sometimes days, give or take how many orders were made within the past few minutes - hours - days - weeks or months.
Consider it like a balloon🎈 being blown into until it 💥pops!💥
Now this is where the problem begins - we don't know where it may go once it's done, could go up or down and when that balloon has popped it's rapidly going there. We could see the 0.00002000 - range within a few hours or just see 0.00000900 range within a few minutes, depending on the orders made for shib and the rest of the market as a whole, this can last for days, weeks depending on the amount of buys or sells.
Also note these are when you get the same surprise jumps like we did in 2021. It started off from the 850's and jumped to the 0.00001300 within a day.
However; right behind it, is a price correction waiting for a peak in the returns to meet its end. Once that happens it'll just fall or rise back to where the price actually suppose to be and starting the process all over again.
You may not know it but there are all forms of consolidations on ever chart from 1 minute to 4 hours to 1 day to 12 months.
You're in a consolidation right now and you don't even know it. Like the ones that occur on a weekly chart, This is what I call "a Seasonal Trend" the day, week, or month, is in a seasonal consolidation and is trending high or low.
But note anything can stop a seasonal trend and disrupt the flow of it, but it will continue the process as long as the damage done was not to bad such as major crashes in a seasonal up trend due to outside interferences such as massive sell-offs, regardless it'll still attempt to rise back because it's in a wave that's trending up-word, if the wave was trending down then it would do way more damage than expected.
But the worst thing to do in a consolidation day - is to sell while it's consolidating, the price may not go no higher or no lower, and if you sell while at a low price in a consolidation you will likely lost position and will have to wait for it to finish to get more shares let alone the original shares, that's if it drops, so best to hold while in a consolidation day, at least until closing.
So I hope this answers anyone question as to why your crypto stock of choice is not moving anywhere, it may not move for hours or even days. you'll just have to wait for closing hour to see if it will pop - hopefully on a positive outcome.
So Happy Trading Everyone

You don't know how to manage your portfolioI had a talk with my mentor earlier today, and we talked about how we each calculate the signal for our allocation towards ETH compared to BTC.
It got me thinking that a lot of people actually aren't aware of why they allocate capital to different assets in the same class!
Case in an upwards trend
When the trend is up and you want to maximize your returns in crypto, with the least amount of risk... What do you do?
Well, you know that alts are higher beta (they move more than BTC), but you don't know when BTC will alts...
In the case for my conservative portfolio I only hold ETH and BTC, but how do I allocate between them?
What I first and foremost do is look at the dominance chart for BTC:
Here we see the dominance of BTC going down a lot, this is while the market is up (between 18th of jan 2021 and 19th of may 2021)
The TPI informed us about the entire trend for the dominance chart. What you do in this scenario is now determine how much ETH you hold relative to BTC in this period (in your conservative portfolio)
Open the ETH/BTC chart (I use binance personally)
In this period we see ETH outperforming BTC a lot!
When the TPI is bullish for the ETH/BTC pair, it means that ETH is likely to outperform BTC, how did that prediction go?
As BTC dominance falls, and we see strength in ETH compared to BTC, we have a higher allocation towards ETH.
But Omar, how do I quantize the amount of ETH compared to BTC?
No one asked, but I will answer still:
The TPI gives values between -1 and 1, I normalize these values between 0-1 for the ETH/BTC pair, where 0 is 0% allocation and 1 is 100% allocation towards ETH:
Equation for normalization:
minValue = 0
maxValue = 1
(TPI - minValue) / (maxValue - minValue) => (TPI - 0) / (1- 0)
Since the TPI had been bearish with a TPI value at -1 for ETH/BTC since the 13th of march, 100% of my conservative portfolio is in BTC!
Case in a downwards trend
The method is the same, but reversed!
When we look to maximize our returns on a short we want to short the asset that is underperforming!
ETH was underperforming BTC by a large portion during the LUNA drama:
This means most of the conservative portfolio was short ETH, rather than BTC
Quite simple, but very effective!
In conclusion
I want you to ask your self, why am I allocating x% of my capital towards this asset (long or short), and is my allocation optimal?
If you can't answer these two questions, then you probably need to look at your system
Numbers don't lie, this method works!
The TPI is truly the holy grail for a swing trader who wants to use statistics and data to maximize their returns and minimize their risk!
Kind regards
Omar
I've linked an idea below from a dear friend of mine (much bigger than on this platform) who has marked out crutial levels for the altcoin market based on what the FED will do, give it a watch!


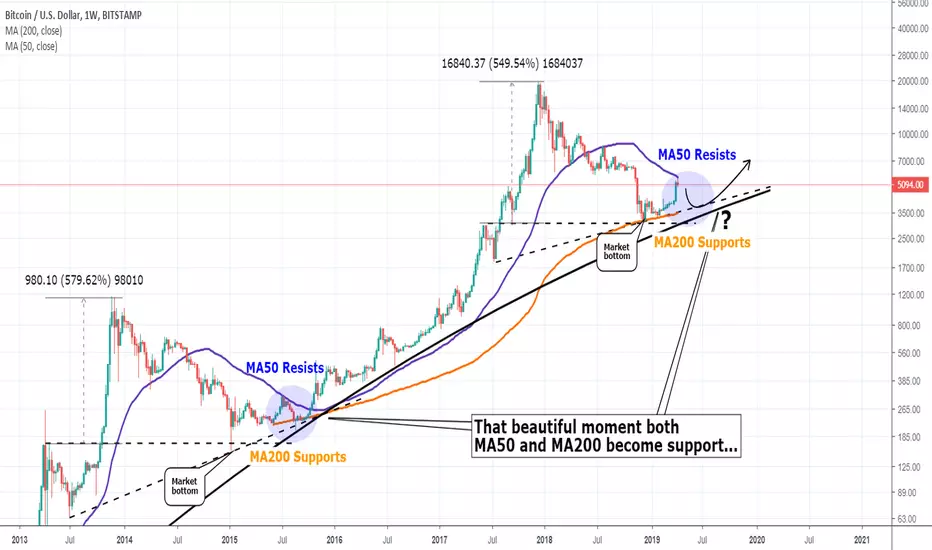
The party is just around the corner on BTC and you are not late!Ok apart from the humorous title, what I want to make clear on this chart is that Bitcoin has entered the final stage before the lift off. Before every low is higher than the previous. Before the new bull cycle essentially begins.
How that happens? Well for starters we can, with a high degree of certainty, say that the bottom is in (priced on December). The reason is clear on the chart particularly on the support offered by the parabola.
So where are we now? Well BTC sits on a tight squeeze within the weekly MA50 (applying Resistance) and the MA200 (applying Support). In the previous cycle the final test of the MA200 signaled the start of the new uptrend. Why? Because the MA50 was crossed emphatically and became a support ever since until the new All Time High. So when these two conditions are met, I expect a non-stop rally to take place.
I would consider the Halving also but I don't want to make the chart too complicated.
After all trading Bitcoin has been and still is pretty simple because every cycle is fairly similar to the previous one and follows a specific set of rules. If you are an investor, wait for that long term buy, forget your investment for 2-3 years, come back and profit. If you are a trader, buy on every pull back during the bull market and sell on every rise during the bear market.
Now why I say this? Because traders can wait for that pull back for the final test of the MA200 to reload longs, as I have been making quite clear on my last analyses (see below), while investors can feel pretty comfortable accumulating more coins on every pull back.
Are you waiting for that magical moment too and start the party??? Let me know in the comments section!!
Tortuga V.3 Update showcase - 2hr Timeframe with Mock PortfolioHey everyone, this is the Tortuga indicator being showcased on the 2hr timeframe, 20 signals back, along with a mock portfolio. The backtest on profits showed a 14% gain on a trading stack and a 3.5% gain on overall equity. For leverage, the profits increased dramatically. I will be better showcasing this in other videos, I just had to pee the whole time so if I am all over the place - my bad.
The Tortuga indicator is for sale, message me directly if you are interested. It has been backtested to be 75% successful in previous versions, for V.3 - it is 79% successful.
Profits increase on larger timeframes.
Thank you for watching,
James

4 Years of BTC and herd mentality in one chartHey guys, as you've seen on my previous forecasts on BTC and XRP, I've started to accumulate and increase my holdings. Besides the technicals, my bias is getting even more long biased due to the massive pessimism around inexperienced traders and overall media coverage. As you can see on the chart above, this is not the first time the world has witnessed such a huge drop on BTC. Back in 2014, when the total crypto market cap has dropped below 5 billion USD due to a massive sell off of -87%, the web was full of articles saying that Bitcoin is about to collapse. That it will end.During this phase, we've also witnessed the MtGox affair and the start of some regulatory talk. Some university professors and asset managers begun to throw out predictions that BTC will hit $10.
Once price has started to recover, you've suddenly heard nothing more from these people. The sentiment has been switched to "keep our mouths shut" till BTC slowly gained bullish momentum again. What happened then? The very same newspapers and magazines started to write articles that BTC is now "hip" again and it might become a big thing in the future. As soon as price started to really rocket, the very same procedure has started again. Jamie Dimon/CEO of JPMorgan, marketwatch.com, CNBC journalists and many others listed thousands of reasons why Bitcoin is bad, risky, a fraud and of course why we all should stay away from it. Guess what happened when the price started to drop again in January? Right. The very same thing. There is no "this time it's different". This market is still in its infancy and yes, there are other coins that might become the crypto #1 but no one knows when it will happen and we shouldn't actually care about, because for now we clearly see a heavy BTC dependance on other alts - despite the diminishing BTC dominance.
Long story short - I think it's extremely important to never, really never fall for any catching armageddon crypto headline out there. I am actually using all this as an contrarian indicator, meaning that a peak in both, heavy optimism and pessimism regarding cryptos should be a warning sign. People just went crazy in France a week ago or so, because some stores have been offering Nutella and diapers for a 70% discount. This thing has escalated so quickly that they've had to call the police. On the other hand, when people are been offering to increase their crypto holdings to buy back at a heavily discounted price of more than 70% , people are scared to death and even sell(!!!) their holdings with a massive loss. I mean..that's just insane.
It's not about having the most accurate entry or exit. Think of Michael Burry (The Big Short) or other investment funds who act during or prior to such a crisis,bubble,healthy correction (call it whatever you want). They rarely squeeze a trade out from the very bottom to the absolute top. Sure, they're doing their best to do so - but in the end it's about the final result. And speaking of this, it simply doesn't matter that much if you've bought in at $6k or $7k. Hell, let BTC even drop to 5k or 4k. That would be even better, as we can buy at much cheaper levels. And once BTC and alts start to gain bullish momentum again, you'll hear the exact same words, you'll read the exact same headlines on the very same magazines and newspapers. And yes, there will be again regulatory talk going on, people spreading rumours, maybe some bans, etc. It just doesn't matter in the mid to long run.
I've seriously read a comment below a tweet of Kim DotCom who advised people to buy BTC on the 5th of August 2016 with the words "Buy Bitcoin while cheap. Like right now. Trust me". You don't believe what an insane amount of hate comments he received and many were just like "mhmm alright". These peeps have probably the very same mentality to those who are laughing at others that say, BTC and alts with a proven concept will have another insane bull run in the near future.
Don't be a sheep. Don't panic. Be patient
