Crypto Market Alert: New York Session Breakdown Asset: Bitcoin (BTC/USD)
Strategy: Quantum Pulse AI (Fibonacci Focus)
Session: New York Open
Date: November 18, 2025
🧠 Executive Summary
The Quantum Pulse AI algorithm has triggered a BUY signal for Bitcoin during the New York session. Despite neutral readings on traditional lagging indicators (MACD and RSI), our proprietary model is detecting an imminent volatility expansion. The price action suggests a "coiled spring" consolidation phase, often a precursor to a sharp breakout.
Current sentiment is reacting to shifting risk parameters in the broader market, positioning BTC as a high-beta asset for the session.
🎯 The Trade Setup
We are looking for a continuation of the bullish structure, targeting liquidity above the recent consolidation range.
Direction: 🟢 BUY (Long)
Entry Price: $92,332.82
Take Profit: $94,553.09
Stop Loss: $90,852.64
Risk Analysis
Risk per Unit: ~$1,480.18
Reward per Unit: ~$2,220.27
Risk-to-Reward Ratio: 1:1.5
Insight: For every $1.00 risked, the trade targets $1.50 in profit. This is a solid, probability-based setup suitable for intraday volatility.
📊 Technical Deep Dive
Why "Neutral" Indicators Matter Here
You might notice the standard indicators are flat:
RSI (14): 50.0 (Dead Neutral)
MACD: 0.0 (Flatline)
Analysis: In the Quantum Pulse strategy, a "flatline" on the MACD combined with an RSI of 50 is not a sign of inactivity—it is a sign of equilibrium. The market has priced in recent moves and is awaiting a catalyst. The "Pulse" algorithm detects that order flow is building up pressure at the pivot points (support/resistance), suggesting that the next move will likely be explosive rather than gradual.
Key Levels
Resistance: The target of $94,553 aligns closely with the recent weekly high structure. A break above here opens the door to $95k+.
Support: The stop loss at $90,852 is placed strategically below the daily pivot area to prevent a "whipsaw" stop-out.
🌍 Fundamental Context
The analysis flags "Heightened Volatility" driven by risk sentiment shifts.
As traditional markets (S&P 500, Nasdaq) open in New York, liquidity flows often spill over into crypto. The trade rationale anticipates that risk-on sentiment will favor Bitcoin as a hedge against currency debasement or simply as a momentum vehicle for the day.
🛡️ Trade Management Plan
Entry: Execute at market or limit at $92,332.
Mid-Trade Adjustment: If price reaches $93,500 (approx. 50% to target), consider moving Stop Loss to Breakeven ($92,332) to secure a "risk-free" trade.
Exit: Hard exit at $94,553. Do not hold through the session close if the target is not met, as swap fees and Asian session volatility may alter the landscape.
Disclaimer: This analysis relies on algorithmic projection and fallback strategies (Fibonacci Retracement). Cryptocurrency trading involves extreme volatility. Never trade with capital you cannot afford to lose.
Cryptos

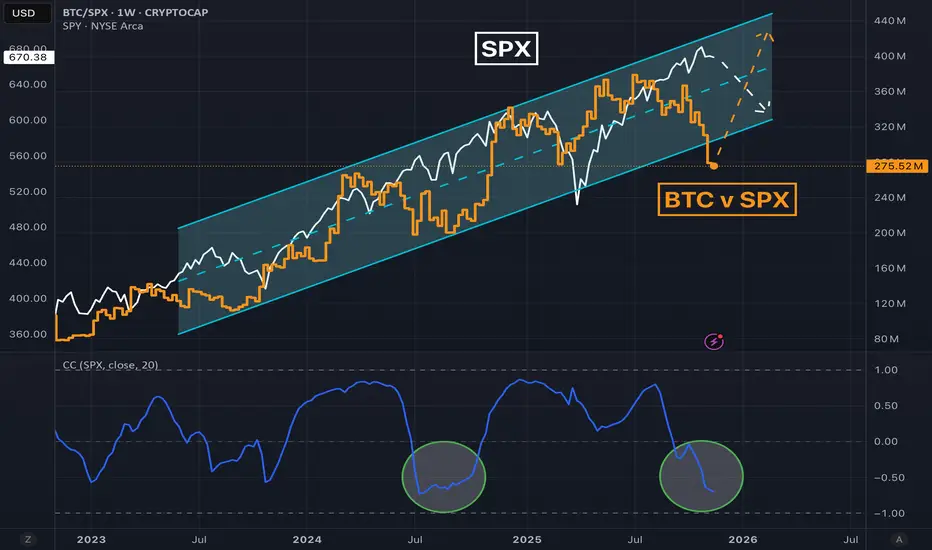
Upcoming rotation from big tech to crypto?Tech SP:SPX and crypto CRYPTOCAP:BTC have been tightly correlated despite suggestions that crypto is a hedge. Therefore it's surprising to see the relative outperformance in tech this year.
In fact, Bitcoin has just gone negative on the year, while the stock market is up double digits again after a sharp April drawdown.
History suggests that crypto / stock relationship should return to a tight correlation, but how do we get there? Will stocks hold and crypto appreciate? Will crypto hold and stocks depreciate?
I think crypto could dig in around current levels, but there's a very good chance I'm mental lol!
ETHUSD has completed five waves since inceptionThe ETH weekly chart shows a textbook 5-wave structure. These first 5 waves must be considered as wave 1 green. Next, Ethereum is going to develop a corrective wave 2.

BTC/USD key support being testedBitcoin has seen its fair share of turbulence along with equity markets in recent days, with the drop below the $100K level triggering a wave of stops and extending the sell-off. That level also happens to coincide with yesterday’s closing price, making it an obvious pivot; reclaiming it would be a constructive development. Yesterday’s low at $97,870 is another level to keep an eye on for short-term resistance. In terms of support, the zone around 95,200—an area of consolidation before this year’s breakout—has finally been revisited. If it fails to produce a bounce, the next meaningful target for sellers lies near 85,000, a sizeable distance below. At this stage, anything is possible, and the sensible approach is to watch how price behaves around these levels rather than fixating on a single direction. Each reaction offers a potential trading opportunity. My base case is for a bounce back to $100K from here.
By Fawad Razaqzada, market analyst with FOREX.com

BTC CRACK! UPDATE WARNING!!⚠️ BTC CRACKS — Officially in a Bear Market (-24%)
Bitcoin has now broken below $97,000, down 24% from its highs, officially entering bear-market territory.
I’ve been warning about this setup for months — not because I enjoy being bearish, but because the structure was screaming caution.
This isn’t a “buy-the-dip” moment or a garden-variety correction. We’ve hit a major technical and psychological level that could decide the next phase for the entire crypto space.
If this level fails, expect a chain reaction across risk assets — leverage, liquidity, and sentiment all roll over together.
It could be years before you see another uptrend. Note: This is not a short-term trade.
Stay sharp. The real test for crypto starts now.
Thank you ALL FOR getting me up to 5,000 followers!! ))
Click boost, follow, comment nicely for more authentic, no BS, raw analysis. Let's get to 6,000 followers. ))

We are NOT finished.Weekly close has come in and, as expected, BTC has closed above the band once again.
Since the start of this cycle, Bitcoin has had the following pullbacks:
September 2023: 21%
August 2024: 34%
April 2025: 33%
November 2025: 21%
Tell me, people—what has changed? Has Bitcoin done anything different from what it’s been doing all cycle?
NO!
Yet 95% of sentiment is extremely bearish. The other 5% who aren’t bearish are patting themselves on the back because they “called the top”—you know, the same “top” everyone is staring at, the same top that can be calculated using basic math from the last two cycles.
Since I joined this space, I have NEVER seen sentiment this bad after only a 20% pullback. Complete madness. The only time I saw emotion this raw was during the COVID crash.
This level of bearish sentiment is what you find at the BOTTOM of rallies, not the top.
The idea that the top is in just because of “cycle length” is invalid—especially when EVERYONE is thinking the exact same thing. It’s never that easy with Bitcoin.
Mark my words: it WILL rally above 200k in 2026, and everyone who sold this year will be buying back in higher. That’s the nature of these markets.
Every cycle, you have to stay grounded, stick to the technical data, and ignore all the noise.
The technical are still holding strong—we are NOT finished!

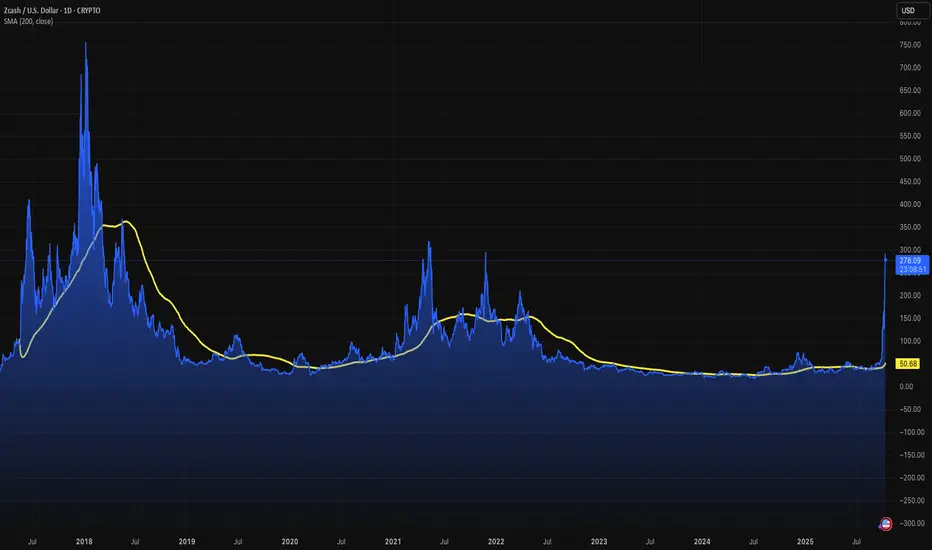
Zcash: Privacy at the edge of the next crypto cycleCrypto isn’t new anymore. We’re past the toddler years. Total crypto market cap has surged past $3 trillion again, and maturity is following price. Each cycle brings innovation. The next one will be about infrastructure, scalability, compliance, privacy.
Zcash fits that last bucket. We must saw from the outset that crypto is different to other asset classes in that it is very much sentiment driven. The network grows and becomes self-fulfilling.
It's a sentiment asset class, based on utility, confidence, and durability. Liquidity drives interest, interest builds trust, trust scales networks.
Zero-knowledge proofs aren’t theory, they’re live. Zcash lets you send fully encrypted transactions. No blockchain breadcrumb trail. That’s a big deal in a world that’s getting more watched.
Regulators are moving. The EU’s MiCA framework is here. The US Treasury wants more visibility over crypto flows. Even stablecoins are facing surveillance. But there’s a line, privacy isn’t crime. Legitimate financial privacy will be demanded by users who value security, not secrecy.
Zcash is one of the few projects positioned for this. Its tech is peer-reviewed, its encryption is compelling. As crypto grows, so will scrutiny. And with that, demand for tools that offer privacy without leaving the system.
With a market cap of $3.8 billion, Zcash is a fraction of Bitcoin’s $1.2 trillion or Ethereum’s $450 billion (as of October 2025). Yet, it outshines competitors like Monero, whose $3.2 billion market cap lags despite similar privacy goals, thanks to Zcash’s superior zero-knowledge tech and transparent framework that regulators can trust.
While privacy coins face scrutiny, Monero was delisted from major exchanges like Binance in 2024, Zcash’s design mitigates these risks, balancing user privacy with regulatory accountability.
Add to your watch list and accept this will have a lot of volatility in the coming months.
The forecasts provided herein are intended for informational purposes only and should not be construed as guarantees of future performance. This is an example only to enhance a consumer's understanding of the strategy being described above and is not to be taken as Blueberry Markets providing personal advice.
Market Psychology: Gold vs Bitcoin - Where We Really Are🧠 The Psychology Test That Changes Everything
Here's a simple test that will tell you everything about where TVC:GOLD and IG:BITCOIN is in its cycle:
Look at these two charts. Which one screams "bull market euphoria"?
────────────────────────────────────
Chart One
🥇 TVC:GOLD : A Textbook Bull Market
Current Price: $4,000.92
Peak Price: $4,390 (Recently hit)
RSI: 69.15
Phase: EUPHORIA → COMPLACENCY (Post-peak pullback)
What the Psychology Chart Shows:
Looking at FOREXCOM:XAUUSD price action overlaid with the Wall Street Cheat Sheet:
✅ Clean parabolic structure - No ambiguity
✅ Multiple phases completed - Hope → Optimism → Belief → Thrill → Euphoria
✅ Peak already hit at $4,390 - The pink Euphoria circle was touched
✅ Now pulling back from peak - Classic post-euphoria behavior
✅ RSI cooling from overbought - Down from 85+ to 69.15
✅ Volume still elevated as reality sets in
This is what a COMPLETED bull market looks like.
When you see this chart, you don't second-guess. You don't wonder "is this a bull market?"
You KNOW it is.
────────────────────────────────────
Chart Two
₿ IG:BITCOIN : Still in Early Stages
Current Price: $101,802.2
RSI: 44.61
Phase: OPTIMISM (not even Belief yet)
What the Psychology Chart Shows:
Looking at INDEX:BTCUSD price action overlaid with the Wall Street Cheat Sheet:
⚠️ "We are here" marker - Sitting in the OPTIMISM phase
⚠️ Haven't reached Belief yet - The green zone is still ahead
⚠️ Thrill phase - Blue circle far above current price
⚠️ Euphoria phase - Pink circle even further away
⚠️ RSI at 44.61 - Not even close to overbought
⚠️ Fourth Halving marker - April 22, 2024 clearly noted
This is what mid-cycle consolidation looks like.
────────────────────────────────────
🔍 The Critical Difference
Let me use an analogy: Think of market cycles like a marathon.
FOREXCOM:GOLD (Chart 1):
Mile 26 - Just crossed finish line - Race is over, starting to cool down
Runners are slowing down after sprint (Post-euphoria)
Crowd peaked, now dispersing (Volume still high but declining)
Everyone saw the finish (Peak at $4,390)
Now wondering if they should have sprinted harder
CRYPTOCAP:BTC (Chart 2):
Mile 8 of 26 - Still early in the race
Runners are fresh and steady (Optimism)
Crowd is watching but not cheering wildly yet
Most people aren't even at the venue yet
Many spectators think the race might be cancelled
────────────────────────────────────
📊 Side-by-Side Psychology Comparison
────────────────────────────────────
🎯 What This Tells Us About IG:BITCOIN
If COINBASE:BTCUSD were truly at a cycle top, it would look like CAPITALCOM:GOLD :
❌ Parabolic vertical moves
❌ RSI pinned above 75 for weeks
❌ Volume exploding
❌ Everyone saying "Bitcoin to $500K"
❌ Taxi drivers asking about crypto
❌ Magazine covers everywhere
❌ No doubt whatsoever about the trend
But OANDA:BTCUSD looks nothing like that:
✅ Choppy consolidation
✅ RSI in neutral zone (44.61)
✅ Volume moderate
✅ Everyone asking "Is the bull market over?"
✅ Retail despair and fear
✅ Zero mainstream coverage
✅ Maximum doubt about the trend
────────────────────────────────────
💡 The Psychology Principle
Here's the key insight from behavioral finance:
**"If you have to ask whether you're in a bubble, you're not in a bubble."**
TVC:GOLD : No one is asking if TVC:GOLD is in a bull market. It's obvious.
IG:BITCOIN : Everyone is asking if IG:BITCOIN is in a bull market. That's your answer.
────────────────────────────────────
🧩 Where Each Asset Really Is
TVC:GOLD - Post-Peak Bear Market Transition:
Completed Phases:
✅ Hope (Oct '23 - May '24)
✅ Optimism (May '24 - Dec '24)
✅ Belief (Dec '24 - May '25)
✅ Thrill (May '25 - Sep '25)
✅ EUPHORIA - PEAKED at $4,390 (Oct '2025)
Current Phase:
🔶 COMPLACENCY - "It'll come back to $4,390"
Price: $4,000.92 (down ~9% from peak)
Classic post-euphoria denial behavior
What's Next:
Anxiety → Denial → Panic → Capitulation (2026+)
Time Remaining: Bull market is OVER - bear phase beginning
────────────────────────────────────
KRAKEN:BTCUSD - Early-Mid Bull Market:
Completed Phases:
✅ Hope (2023 - Post-FTX recovery)
🟡 OPTIMISM (Current - 2024-2025)
Phases Still Ahead:
⬜ Belief
⬜ Thrill
⬜ Euphoria
What's Next:
Break into Belief phase → Thrill → Euphoria
Time Remaining: Given CRYPTOCAP:BTC high volatile nature - 2-6 months of upside potential
────────────────────────────────────
🎨 The Visual Test (Do This Right Now)
Step 1: Look at the TVC:GOLD chart
Does it look like a bull market? YES
Could you be wrong? NO
Is there any doubt? ZERO
Step 2: Look at the IG:BITCOIN chart
Does it look like a bull market? MAYBE?
Could you be wrong? POSSIBLY
Is there any doubt? TONS
Step 3: Ask yourself
**"Would a cycle TOP have this much doubt and fear?"**
The answer is NO.
────────────────────────────────────
📈 What the RSI Divergence Tells Us
TVC:GOLD RSI Pattern:
Peaked above 85 during euphoria
Currently cooling at 69.15
Rolling over from overbought
Classic post-peak behavior
This is bear market transition
IG:BITCOIN RSI Pattern:
Sitting at 44.61
Plenty of room to run
Not even approaching overbought
Recent "Bear" signals flushing out
This is early-cycle behavior
Think of it like a gas tank:
TVC:GOLD : Hit redline at $4,390, now coasting down on fumes
IG:BITCOIN : 45% full, tons of room to run
────────────────────────────────────
🔥 The Contrarian Insight
What the majority thinks:
" TVC:GOLD is in a bubble, IG:BITCOIN topped"
What the charts actually show:
TVC:GOLD is in a mature bull market (near end)
IG:BITCOIN is in early-mid bull market (tons of runway)
The irony:
Everyone trusts TVC:GOLD rally (late stage)
Everyone doubts IG:BITCOIN rally (early stage)
This is exactly backwards.
────────────────────────────────────
🎭 The Emotional State Comparison
TVC:GOLD Holders Right Now:
😰 Starting to feel anxious (down from $4,390)
🤔 "It'll bounce back, right?"
📉 Checking price hoping for recovery
🙃 "I should have sold at $4,390"
😬 "This is just a healthy correction"
This is COMPLACENCY - the denial phase after euphoria.
IG:BITCOIN Holders Right Now:
😰 Anxious and doubtful
🤐 Not talking about their positions
😔 Wondering if they should sell
📉 Feeling defeated
💀 "Maybe the cycle is over"
Which emotional state typically marks:
Post-cycle tops? → TVC:GOLD current state (Complacency/Denial after Euphoria peak)
Cycle middles? → IG:BITCOIN current state (Doubt during Optimism)
────────────────────────────────────
💎 The Bottom Line
Using the Wall Street Cheat Sheet as our guide:
TVC:GOLD :
Phase: Thrill → Euphoria
Completion: ~95% through cycle
Risk/Reward: High risk, limited reward
Action: Take profits soon
IG:BITCOIN :
Phase: Optimism (just finished Hope)
Completion: ~30% through cycle
Risk/Reward: Moderate risk, massive reward
Action: Accumulate aggressively
────────────────────────────────────
🧠 The Psychology Lesson
The market is designed to make you feel wrong at exactly the wrong time:
When TVC:GOLD peaked at $4,390 (Euphoria) → You felt confident, " TVC:GOLD to $5K!"
Now TVC:GOLD is pulling back (Complacency) → You feel like "it's just a correction"
When IG:BITCOIN is cheap and poised (Optimism) → You feel scared to buy
This is why most people:
Miss selling tops (felt too good at $4,390)
Hold through corrections (denial and complacency)
Sell bottoms during fear (Optimism feels scary)
To win, you must:
Trust the structure over the sentiment
Buy when it feels uncomfortable (Optimism/Belief)
Sell when it feels amazing (Euphoria/Peak)
────────────────────────────────────
📍 Where We Actually Are
HOPE → OPTIMISM( IG:BITCOIN ) → BELIEF → THRILL → EUPHORIA ( TVC:GOLD $4390 Peak) → COMPLACENCY → ( TVC:GOLD Current)
IG:BITCOIN is 3-4 phases behind TVC:GOLD .
TVC:GOLD already peaked. IG:BITCOIN hasn't even started its parabolic phase yet.
────────────────────────────────────
🎯 What This Means for Your Portfolio
If you're holding TVC:GOLD at $4,000:
You missed the peak at $4,390
You're in post-euphoria complacency
"It'll bounce back" is denial
Risk/reward is terrible now
Exit strategy needed YESTERDAY
If you're doubting IG:BITCOIN at $102K:
You're sitting in Optimism
You're early to the party
Peak is 3-4 phases away
Risk/reward is excellent
Accumulation strategy needed NOW
────────────────────────────────────
🔚 Final Thought
The next time someone tells you " IG:BITCOIN topped," show them these two charts side by side.
Ask them: "Which one actually topped?"
The answer is clear: TVC:GOLD peaked at $4,390 and is now in complacency denial. IG:BITCOIN is still in optimism.
TVC:GOLD finished its race.
IG:BITCOIN is just finishing Act 1.
The Golden Bull Run isn't over—it's barely begun.
────────────────────────────────────
This is educational content comparing market psychology across asset classes. Not financial advice. Always do your own research and manage risk appropriately.
────────────────────────────────────

BITCOIN HIGH PROBABILITY SETUP SOON!!!🚨 BTCUSD HIGH PROBABILITY BUY SETUP 🚨
* Here We Can See Clearly The Next Potential Moves For BTC Coming Hours/Days.
* Keep Your Eyes Close On Your Trading Positions.
* Happy PIP Hunting Traders.
FXKILLA.

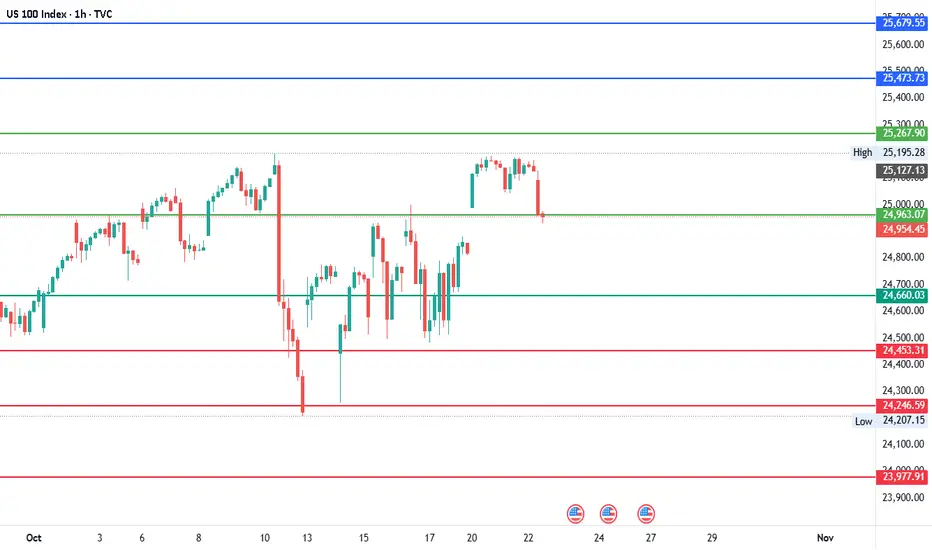
#NDQ - Short-term Range $26,216 - $23,709 | 1000 Points Move?Date: 22-10-2025
#NDQ - Current Price: $24,963.00
Pivot Point: $24,963.07 Support: $24,660.03 Resistance: $25,267.90
Upside Levels:
L1: $25,473.73 L2: $25,679.55 L3: $25,948.23 L4: $26,216.91
Downside Levels:
L1: $24,453.31 L2: $24,246.59 L3: $23,977.91 L4: $23,709.23
#TradingView #Nifty #BankNifty #DJI #NDQ #SENSEX #DAX #USOIL #GOLD #SILVER

BITCOIN daily FALLING-WEDGEBitcoin is in a falling wedge and very likely can break above that in the coming days

ICPUSDT - BUY OPPORTUNITYI predicted Solana to achieve its ATH when it was trending bearish and markets where in complete negative sentiment towards Solana, none the less, my Solana outlook and price forecast was based on the blockchain, its usability, and TPS etc. It hit through all the TP areas and is now fully trading at its fair value, and still growing...
Now I am back with my updated outlook on Internet Computer Protocol (ICP). This blockchain is by far the most advance and powerful blockchain I have come across and know. Literally nothing comes close to it. I have done my own thorough research and can honestly say, this blockchain is literally a steal at current market value. In fact I am in complete disbelief and amazed how this blockchain is not in the TOP 5, when compared to other blockchains out there, who don't offer any real value, and or utility but rather just a mere copy tokens, of ETH etc most cant even host a single bite size image on their blockchain. Yes even Solana can not compete with the tech of ICP. ICP is a super-powerful blockchain, that can host anything including Ai fully on-chain. YES Fully On-Chain.
The introduction of Caffeine Ai > sovereign self-writing apps, self writing internet etc You can find more about this on ICP or follow Dom on X @ DOMINIC_W
Caffeine Ai could bring a lot of Devs over, possibility of anyone becoming a Dev through Caffeine Ai, buildings Apps that will generate income, burn cycles on ICP, catalyst for ICP growth and value etc
The scale at which ICP can exponentially grow from there, with mass adoption can far exceed market cap of Solana and many other blockchains. In my opinion, its far more superior than ETH. It is the only true Ai Blockchain which can host Apps fully on-chain etc immune to tampering, hacks etc A full scale IT stack that can engineer Apps, rewrite the internet all within ICP Blockchain.
It will recover, and gain its true value, at least 3 digits, potentially 4. (I am not financial advisor, Pls DYOR).
The ICP launch was heavily manipulated , it posed a threat to other blockchains, big techs etc however the TEAM at ICP continues to deliver (biggest R&D in crypto space), work and progress ICP. Its only a matter of time, ICP will be MASSIVE n people will wake up to its true reality and what it offers!
Todays price will be Historical!!! Yes I have added more ICP with this Dip. DCA is a powerful strategy ;) Thanks for the Dip - I call it the Winter Sale.
Lets see where ICP leads from here now!
I am holding strong, Diamond!
Oh, if you have come this far, Don't forget BOB on ICP - An interesting one to watch out for!!! just saying ;)
Pls DYOR - I am not Financial Advisor. Crypto is highly volatile!
Trade Safe Habibis

Bitcoin Loves OctoberRecently I had a client ask if I could tell them the probability of a candle being bullish or bearish. My fingers got excited and I tried it out. Little did I know this rabbit hole was getting adventurous.
July this month, COINBASE:BTCUSD rose by 8%. The probability read 70% which now makes it 78% next year. Whats even more curious is that October has a 90% chance of having a buillish candle.
Now the question remains, will this october be the one to lower this score or raise it?
Lets wait and find out.
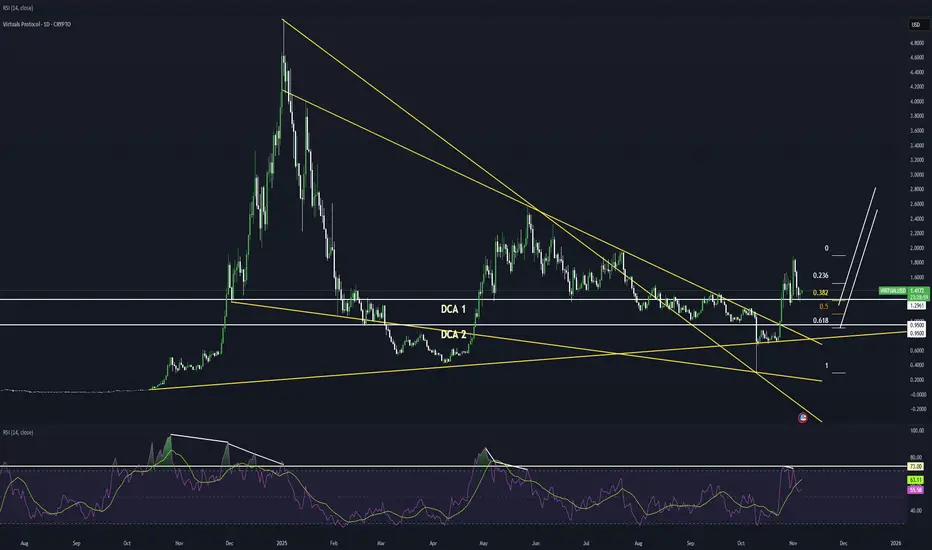
Virtuals Protocol Potential Bullish Breakout OpportunityVirtuals Protocol seems to exhibit signs of overall potential Bullish momentum if the price action breaks the previous prominent Higher High with multiple confluences through key Fibonacci and Support levels which presents us with a potential Non-Levered buy and hold opportunity.
Entry: (Buy 1 CMP & Buy 2 around 1 - 0.95 range)
Stop Loss: 0 (Non-Levered Buy & Hold is recommended)
Potential Range for Targets: 2.5 - ATH
Educational BTC Analysis: Decoding BTC's Wave (C) DownHello Friends, Welcome to RK_Chaarts.
Today we are going to understand Elliott Wave Teaching Points from the BTCUSD Daily Chart,
This chart sequence perfectly illustrates the difference between motive (impulse) and corrective waves, as well as the important structures and rules of a larger correction.
1. The Structure of a Corrective Pattern (A-B-C)The Big Picture: The overall movement, labeled Intermediate Wave (A), (B), and (C) (Blue), is a three-wave corrective pattern. This type of pattern moves against the trend of one larger degree (which have been an uptrend). The three-wave (A-B-C) structure is the classic way markets move in a counter-trend. Wave (A): The initial counter-trend move.Wave (B): A bounce or retracement that moves back in the direction of the previous trend, but fails to reach the start of Wave (A).Wave (C): The final, and often most powerful, leg of the correction, which is designed to complete the retracement. This wave is always structured as a five-wave impulse.
2. The Rule of Subdivisions: Corrective Waves are Internally Motive, Wave (C) is an Impulse: The report states that Intermediate Wave (C) is expected to unfold as a five-wave impulse sequence of a Minor Degree (Red) (Minor Wave 1, 2, 3, 4, 5).
Learning Point: This highlights a fundamental Elliott Wave rule: the C-wave of an A-B-C correction is a motive wave (it has a five-wave internal structure) because its purpose is to create strong directional progress and complete the larger correction. This is commonly known as a Zigzag correction (which has a 5-3-5 internal count for A-B-C).
3. Identifying the Strongest Move (Wave 3)
The Current Phase: The market is currently in Minor Wave 3 (Red) downwards.
Learning Point: In Elliott Wave theory, Wave 3 is typically the longest and never the shortest of the three motive waves (Waves 1, 3, and 5). This means the analysis anticipates the current move to be the most directional, high-momentum, and volatile part of the entire Intermediate Wave (C) correction. This is the "sweet spot" for trend traders.
4. The Principle of Alternation (Predicting Wave 4)
Upcoming Wave: The analysis projects a shallow Minor Wave 4 (Red) rebound.
Learning Point: While the chart doesn't show Wave 4 yet, this prediction is often guided by the Principle of Alternation. If the preceding corrective wave (Minor Wave 2) was a sharp, deep correction, the next corrective wave of the same degree (Minor Wave 4) is expected to be a sideways, shallow, or complex correction (like a flat or triangle). The prediction of a "shallow" wave 4 suggests Minor Wave 2 was likely a deeper, sharper retracement.
5. The Critical Invalidation Rule
The Invalidation Level: The report sets the critical invalidation price at 74,223, which represents the low or starting point of wave ((1)).
Learning Point: Wave ((2)) can never retrace more than 100% of Wave ((1)). By identifying a specific price level, we can assume that our study says price should not broke below that particular level, it provides traders with clear risk management parameters.
I. Current Wave Count Status
The analysis indicates that the previous upward corrective structure, designated as Intermediate Degree Wave (A) and Wave (B) (Blue), is complete. The market is now engaged in a significant downward movement within the larger Intermediate Degree Wave (C) (Blue).
This Intermediate Wave (C) is expected to unfold as a five-wave impulse sequence of a Minor Degree (Red) to the downside, fulfilling the final leg of the overall corrective cycle.
II. Detailed Downward Projection
The Minor Degree five-wave structure within Intermediate Wave (C) is currently positioned as follows:
Minor Wave 1 and Minor Wave 2 (Red): These waves are identified as complete.
Current Phase: The market is now unfolding Minor Wave 3 (Red) downwards, indicating the strongest portion of the bearish move is in progress.
Anticipated Completion: Following the completion of Minor Wave 3, the analysis projects a shallow Minor Wave 4 (Red) rebound, followed by the final impulse move, Minor Wave 5 (Red), to complete the entire Intermediate Wave (C) correction.
The ultimate completion of Intermediate Wave (C) will signal the end of the larger-degree correction (labeled as a corrective wave (2)).
III. Critical Invalidation Level
The integrity of this bearish wave count is contingent upon the price action respecting a critical support level.
Invalidation Price: 74,223
Significance: This price point represents the extreme low or starting point of wave ((1)), so Wave ((2)) correction Should not breach this level as per wave principles, if it makes lower low below 74,223 on the lower side, the current Elliott Wave analysis would be invalidated, requiring a revision of the entire wave structure and market outlook.
I am not Sebi registered analyst.
My studies are for educational purpose only.
Please Consult your financial advisor before trading or investing.
I am not responsible for any kinds of your profits and your losses.
Most investors treat trading as a hobby because they have a full-time job doing something else.
However, If you treat trading like a business, it will pay you like a business.
If you treat like a hobby, hobbies don't pay, they cost you...!
Hope this post is helpful to community
Thanks
RK💕
Disclaimer and Risk Warning.
The analysis and discussion provided on in.tradingview.com is intended for educational purposes only and should not be relied upon for trading decisions. RK_Chaarts is not an investment adviser and the information provided here should not be taken as professional investment advice. Before buying or selling any investments, securities, or precious metals, it is recommended that you conduct your own due diligence. RK_Chaarts does not share in your profits and will not take responsibility for any losses you may incur. So Please Consult your financial advisor before trading or investing.

XRP/USDT: Bearish Channel Holds as Price Struggles Below $2.50XRP/USDT continues to trade below the descending trendline inside a clear downward channel, maintaining a bearish structure. The recent rejection at the $2.44 zone signals ongoing weakness, with price unable to break higher.
As long as it stays below the $2.50 resistance, a move back toward $2.00 support remains likely. Momentum favors a gradual drift lower, keeping short-term bearish pressure in place.
⚠️ Risks:
– A Bitcoin rally could lift altcoins and disrupt the setup.
– Regulatory news around XRP may increase volatility.
– U.S. macro shifts could impact USD strength and XRP flow.

Potential outside week & bullish potential for ETHD (short ETH)Entry conditions:
(i) higher share price for AMEX:ETHD above the level of the potential outside week noted on 30th October (i.e.: above the level of $4.25).
Stop loss for the trade would be:
(i) below the low of the outside week on 27th September (i.e.: below $3.23), should the trade activate.

SHIB Comeback? (YOLO)The chart doesn't look great but I see a lot of chatter lately about CRYPTOCAP:SHIB and it's slated to be in T. Rowe Price's ETF once approved. Also, the weekly burn rate is up ~130%, so I'm taking a shot on it. The daily chart also shows a multi-day squeeze forming.
10x long from .000010172

Bitcoin Weekend Volume Could Exceed 116K as Smart Money Accumula📊 Market Update
Bitcoin has been building strength since the 106K–107K level, showing signs of a new uptrend. Both the lower time frames and the main trend are currently positive. There’s a strong possibility that BTC will target 112K as the first level, with 116K+ also possible depending on the weekend trading volume.
🔹 Market Structure
The market structure is gradually building, suggesting smart money inflows into BTC over the last 10 hours. We’ll continue tracking this development closely further

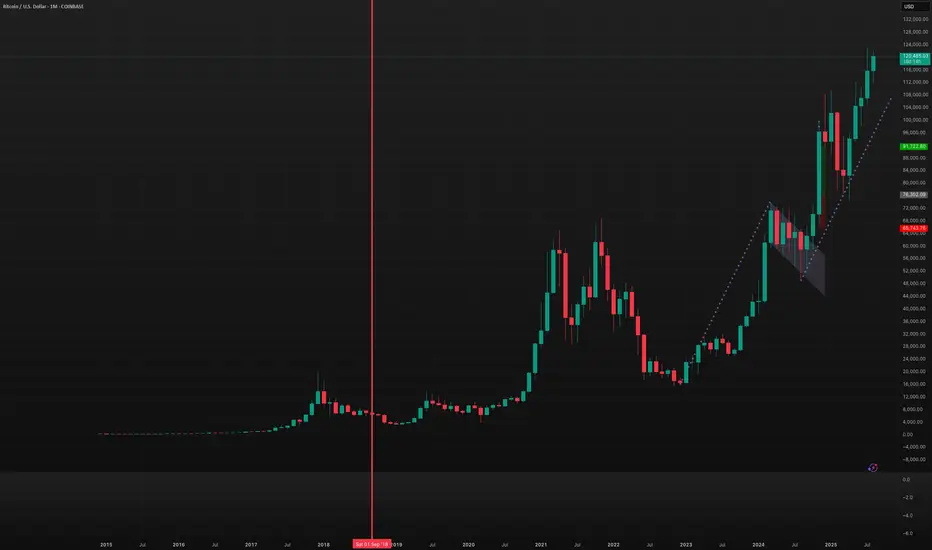
Bitcoin may have topped Bitcoin is still holding within the current ascending channel, showing sideways consolidation near the upper range. The MACD is beginning to turn, signalling potential momentum loss after a strong rally. From the 2020 swing low to the 2021 swing high, price has reached and rejected the 1.618 Fib extension, suggesting a temporary top may be forming.
If the lower boundary of the channel breaks, BTC could repeat the pattern seen in the 2021 cycle — a deeper corrective phase before forming the next major leg higher. As long as it stays inside the channel, the broader trend remains bullish.

#BTC/USDT 4HOUR CHART UPDATE !!BTCUSDT 4H Chart Analysis
Pattern: The chart shows a double bottom at the $106,000–$107,000 zone (circled as points 1 and 2). Price bounced strongly after retesting this support region twice.
Support & Resistance: The green box highlights the major support zone, which has held firm and led to a reversal. Resistance remains at the gray band around $112,000–$113,000.
Setup: After confirming the double bottom, BTC has reclaimed $110,000 and is pushing toward resistance. The green bars suggest a bullish projection, targeting higher levels toward $117,000–$123,000 if BTC sustains momentum above resistance.
Summary:
BTC is bullish above $110,000, with a double bottom support in place. A successful breakout above local resistance could accelerate the uptrend in the coming sessions.
DYOR | NFA

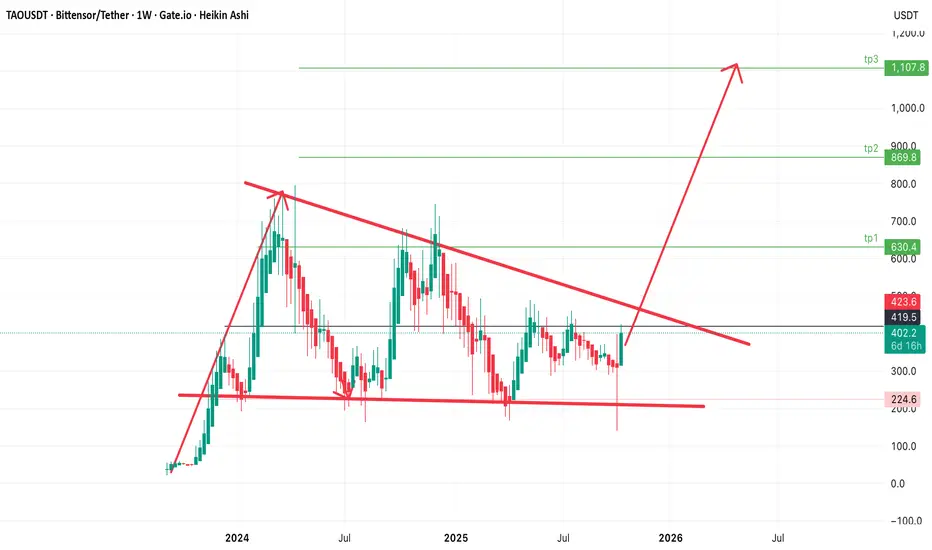
$tao TAO Bittensor Descending Triangle PatternGETTEX:TAO TAOUSDT Bittensor/Tether shows large descending triangle pattern forming on the Weekly timeframe— a classic setup for a major breakout when price breaks the downtrend line.
Current Price: $419
#TAO Chart Structure & Trend
Strong horizontal support between $224–230
Price recently bounced strongly from around $315 to $401, signaling momentum building toward a potential breakout of the triangle.
A decisive breakout above $450–470 would likely confirm a bullish reversal.
Key Levels
* Short-term: between $450–470 (trendline resistance and breakout zone)
* Medium-term: $630 (tp1)
* Extended: $870 (tp2) and $1,108 (tp3)
Invalidation of this Bullish bias is under $315