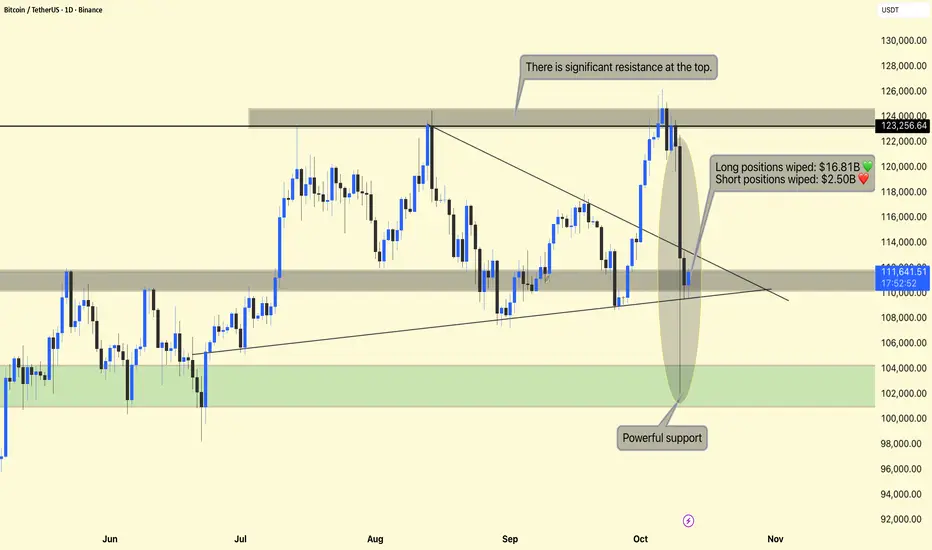
Bitcoin (BTC/USDT) – Daily Chart Analysis !!Bitcoin (BTC/USDT)
The chart shows a sharp correction from the $124,000 resistance zone, followed by a major liquidation event that wiped out:
Long positions: $16.81B
Short positions: $2.50B
This represents one of the most volatile 24-hour periods in recent months — aligning with the Fear & Greed Index drop to Extreme Fear (24).
$123,000 – $124,000 Major Resistance Strong supply area — multiple rejections in past rallies.
$111,000 – $110,000 Current Support Zone Price is currently consolidating here after the crash.
$102,000 – $104,000 Powerful Support Historical accumulation zone — where buyers previously stepped in aggressively.
Resistance Rejection
At the top of the range ($123,000–$124,000), BTC encountered heavy resistance, triggering large-scale profit-taking and the liquidation of overleveraged long positions.
This area has acted as a strong rejection zone several times since August, indicating sellers are defending it aggressively.
Breakdown and Liquidations
After the breakdown of the descending triangle, cascading liquidations forced a steep drop.
This led to a high-volume candle (highlighted area) where:
Liquidity was cleared both above and below key support levels.
Market sentiment flipped rapidly from Greed → Extreme Fear.
This kind of liquidation sweep often signals a short-term capitulation — a flush before possible recovery.
Support & Market Structure
Price bounced from near $110,000, a previous structure support level.
If BTC maintains above $110,000, it may attempt to stabilize and retest mid-range resistance around $115,000–$116,000.
However, if price breaks below $110,000, we could see a retest of the $102,000–$104,000 demand zone, which is marked as “Powerful Support” — a key area where long-term buyers might re-enter.
DYOR | NFA
Cryptosanders
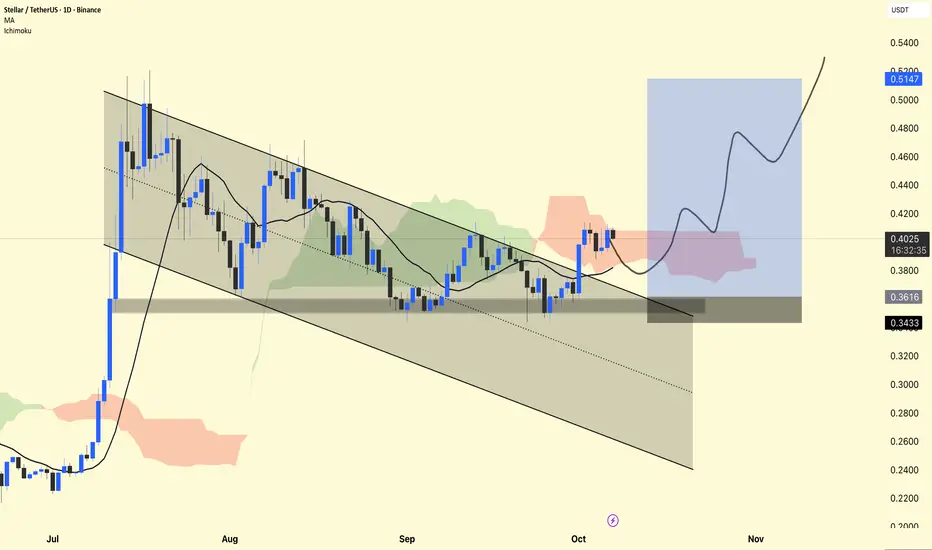
XLM/USDT — Daily Chart Analysis !!XLM/USDT — Daily Chart Analysis
The price is currently trading around $0.40, holding firmly above the demand zone ($0.36–$0.34).
The chart shows a falling channel breakout, which is a bullish reversal pattern.
The Ichimoku Cloud is showing early signs of a bullish trend as the price is attempting to hold above the cloud base.
The moving average (MA) at $0.38 is acting as dynamic support – a positive sign for further upside.
📈 Long Setup:
Entry Zone: $0.38–$0.40
Stop-Loss: Below $0.34 (clear invalidation level)
Targets:
🎯 $0.46 → First Target
🎯 $0.51 → Main Swing Target
DYOR | NFA
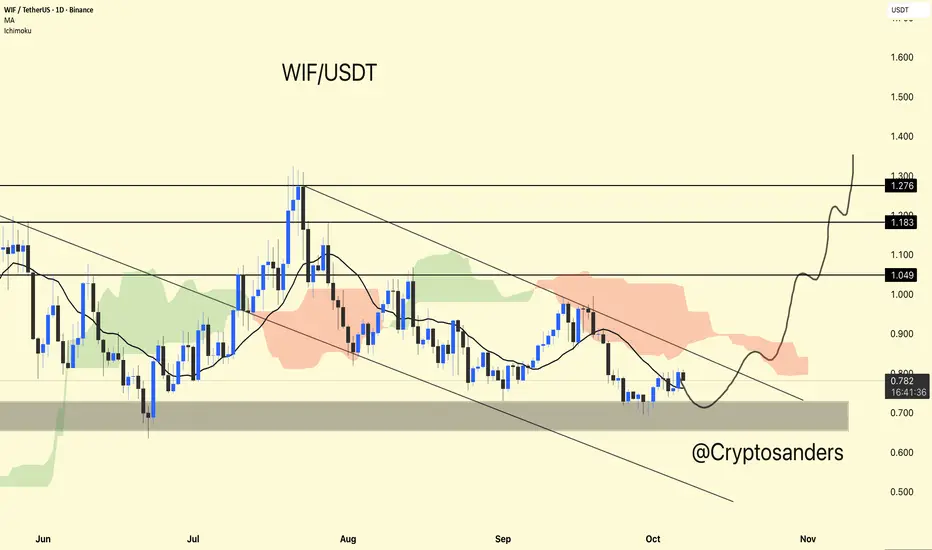
WIF/USDT chart Update !!📊 WIF/USDT Update
WIF is holding strong within the key demand zone of $0.70–$0.75 and is showing signs of reaching lower levels.
Currently trading around $0.78, the price is forming a falling wedge – a potential bullish reversal setup.
A clear breakout above $0.85 could accelerate momentum in this direction:
🎯 Targets: $1.05 → $1.18 → $1.27+
As long as WIF remains above $0.70, the bullish trend remains intact.
🛑 A breakdown below that area would invalidate this setup.
Patience here could yield significant profits.
DYOR | NFA
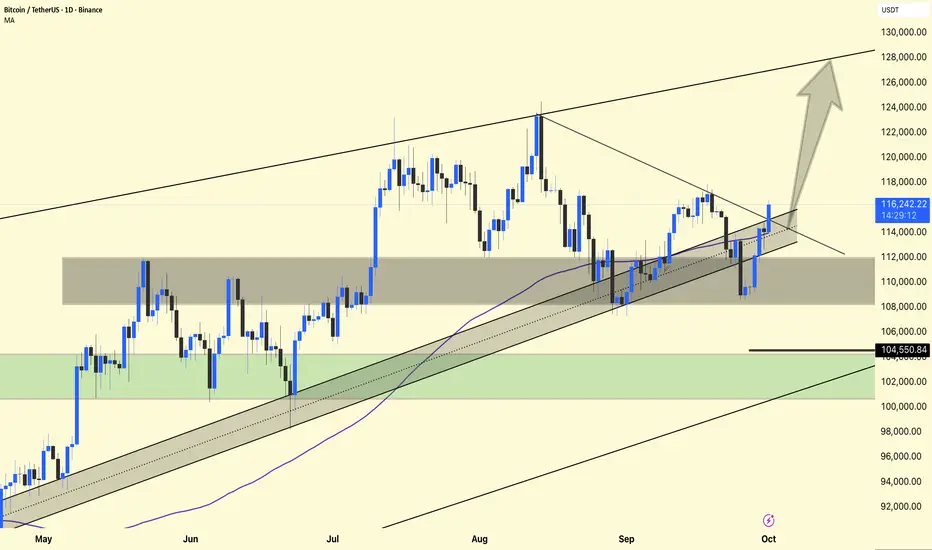
#BTC/USDT 1DAY CHART UPDATE !!BTC Trend Context: The price is within an ascending channel – overall, this suggests an upward trend in the market.
Support Testing: The lower boundary or support zone is being tested – this is a critical "decisive" area.
Rejection/Bounce Potential: If support holds and the price reacts upwards, we could see a further move upwards towards resistance.
Breakdown Risk: If the price breaks decisively below support, this could lead to a deeper decline or a trend reversal.
S&P500 CHART UPDATE !!S&P 500 Analysis
The S&P 500 is trading near 6,650, moving strongly within its ascending channel.
Support: 6,400 – key level to hold for bullish momentum.
Resistance: 6,800 – a breakout could open the door toward 7,200.
The trend remains bullish, and staying above the midline keeps upside potential intact.
A breakdown below 6,400 may signal a short-term correction.

BTC.DOMINANCE WEEKLY CHART UPDATE !!BTC Dominance (BTC.D) Weekly Chart Analysis
BTC dominance is currently at 58.94%, bouncing from the key support zone near 56%–57% (yellow area).
Resistance: Around 60%–61%, aligned with the 50-week MA.
Support: Strong support at 56%, critical for bulls to defend.
If BTC.D holds above 57%, it could retest 62%, strengthening BTC’s position over altcoins.
However, a break below 56% may trigger a drop toward 54%–55%, signaling a potential altcoin rally.

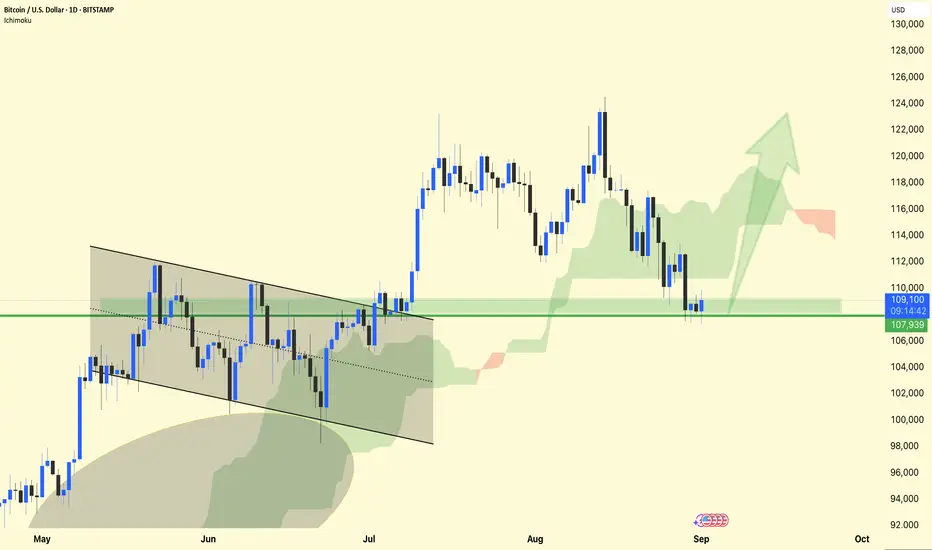
BTC/USDT – 1D Chart Analysis !! BTC/USDT – 1D Chart Analysis
BTC is holding above the $108K support zone (green box). This area has acted as a demand zone, preventing deeper downside.
Structure: After the breakdown from the wedge pattern earlier, the price is consolidating near support with lower wicks showing buyer defense.
Ichimoku Cloud: Price is still inside the cloud zone, suggesting a neutral-to-bullish outlook. A strong daily close above $110K–112K could flip momentum upward.
Next Targets:
Bullish breakout → Move toward $116K – $120K zone (green arrow projection).
If support fails → Risk of retest around $104K – $102K.
⚡ Sentiment: Market is at a make-or-break level — holding $108K could spark a strong rebound; losing it could trigger further correction.
DYOR | NFA
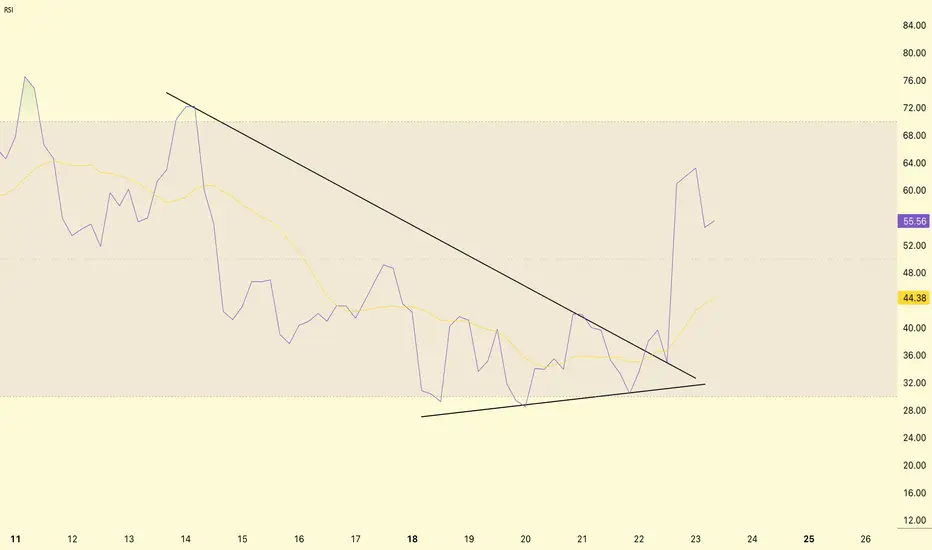
BTC/USDT RSI Analysis !!BTC/USDT RSI Analysis
RSI (Relative Strength Index) breakout analysis.
Descending wedge in RSI
From August 11 to August 22, RSI was forming a descending wedge pattern (lower high, higher low).
This is usually a bullish reversal setup.
RSI breakout
RSI broke out of the bullish wedge on August 22 → rose from ~30 to ~65.
Current RSI = 55.97 → from neutral to bullish territory.
Moving average (yellow line) = 44.41, which means RSI is above the trend, indicating positive momentum.
RSI breakout confirms strong buying interest.
This could mean that BTC has completed its short-term correction phase and is ready for another rise.
DYOR | NFA
U.S. Dollar Index (DXY) !!U.S. Dollar Index (DXY)
Long-Term Channel Support Held
The chart shows DXY moving within a rising parallel channel since around 2008.
Recent price action bounced right from the lower trendline (~98 zone), indicating strong structural support.
Bearish Pressure
DXY dropped below 100, currently around 98.72, down 1.32% this month.
Trading below the 200-month EMA, which suggests weakening long-term strength.
Bearish candlesticks forming near the lower channel indicate an increased risk of a breakdown if support fails.
Ichimoku Cloud Signal
Price below the Kumo (cloud) = bearish territory.
Cloud turning thin ahead — signaling potential indecision or transition.
What This Means for Markets
If the DXY breaks below this channel, it could trigger a broader USD sell-off, potentially bullish for cryptocurrencies, gold, and emerging markets.
If support holds, expect a rebound toward the 104–106 zone, especially if macro sentiment favors the dollar.
Stay updated and manage your risk accordingly.
DYOR | NFA

ETH/USDT – Weekly Chart Analysis !! ETH/USDT – Weekly Chart Analysis
ETH is testing a major historical resistance between $3,700 – $4,000 (highlighted green zone).
A clean breakout above this level could push price toward the next key resistance at ~$4,660.
Previous accumulation zone around $2,400 – $2,800 (yellow box) now acts as strong support.
Long-term floor at $1,420 and $1,025, though currently far below.
Bullish Breakout Potential: If ETH sustains above the green resistance, it may retest $4,660+.
A failure to break above $4K could lead to a healthy pullback toward the yellow zone (~$2,800).
Stay updated and manage your risk accordingly.
DYOR | NFA

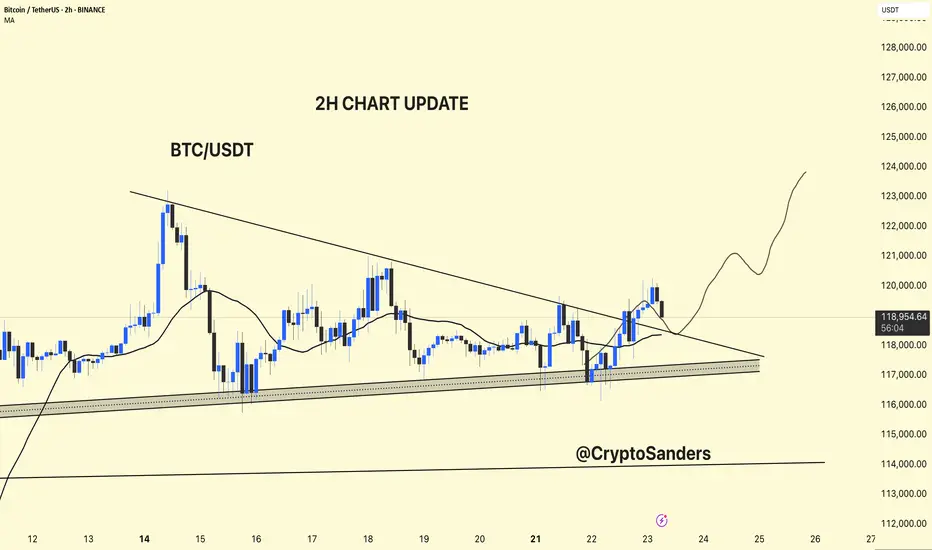
BTC/USDT – 2H Chart Update!!BTC/USDT – 2H Chart Update
Breakout Confirmed:
BTC has broken above the descending trendline but is currently facing resistance at around $ 119,500.
Support Zone:
Strong ascending support between $ 117,000 and $ 118,000 remains intact.
Moving Average:
Price is currently testing the 2H MA (~$118.3). Holding above this could confirm bullish continuation.
Outlook:
If BTC holds above $ 118,000, a move toward $ 123,000–$ 125,000 is likely.
Failure to hold may retest $117K support.
Bias: Short-term bullish unless price breaks below ascending trendline.
Thanks for your support!
DYOR. NFA
ETH/USDT 1DAY CHART UPDATE !!ETH has broken out of a long-term downtrend (black diagonal trendline) and is now in a consolidation phase below the $2,800–$2,850 resistance.
The price is currently $2,612, showing hesitation below the key horizontal resistance.
Resistance Zones:
$2,800–$2,850: Key horizontal resistance. Breaking above this confirms bullish continuation.
$3,200 and $3,600: Medium to long-term bullish targets.
Support Zones:
$2,000–$2,200: Strong horizontal support + ascending trendline + 50 EMA (red line)
$1,410: Key long-term support (unlikely to be tested soon unless the market reverses)
ETH breaks and closes above $2,850 ➝ $3,200 → $3,600 → $3,800+ likely to rise
The structure suggests that a higher low will likely form before the breakout.
If ETH rejects at $2,850, expect a retest of $2,000–$2,200 (golden zone)
This would create a bullish higher low setup and could be a strong buy-dip opportunity.
Thanks for your support!
DYOR. NFA

BTC/USDT CHART UPDATE !!Chart Pattern: Inverted Head and Shoulders (iH&S)
The chart shows a classic reversal pattern of the head and shoulders formation.
Left Shoulder: Late January 2025
Head: April 2025
Right Shoulder: Potentially forming near current levels (~$100K–$102K)
This bullish reversal pattern often leads to a strong bounce if the neckline is respected.
Support Zones:
$98,000 – $100,000: 50 EMA (red) and retest of the area near the neckline
$94,500 – $95,000: 200 EMA (green), last resort support
Resistance Levels:
$108,000 (horizontal neckline resistance)
$112,000 and $125,000 (bullish breakout targets)
Scenario Outlook
Bullish Case: If BTC maintains the $100K area and breaks above $108K with volume → rally towards $115K–$125 K.
Bearish Case: Breakdown below $94K invalidates the iH&S structure.
Thanks for your support!
DYOR. NFA

BTC/USDT Chart Analysis.
BTC has been in an uptrend since early April 2025, breaking above a strong horizontal resistance line (visible in the chart).
However, we can now observe a descending channel (falling wedge) after the peak, indicating a potential pullback.
Support Levels:
The price has tested the 50-day SMA (red) and is approaching the 200-day SMA (green), which is a strong dynamic support (around $94,740–$98,000).
Horizontal support lines are around the $103,000 and $100,000 levels, acting as immediate support.
Price Pattern:
The pattern resembles a bullish flag or descending wedge, suggesting a possible continuation of the previous upward move if a breakout occurs.
Before a bullish reversal, a retest of support levels (highlighted in the blue circle) near the moving averages is possible.
Future Path (as drawn on the chart):
Possible pullback to around $100,000–$98,000 levels.
Reversal and breakout are expected to be between $112,000 and $115,000 initially, and possibly higher to $125,000–$130,000.
Volume & Momentum:
No volume data is shown, but the price action indicates a correction with weakening momentum.
Trend lines are sloping upwards, indicating underlying strength despite the correction.
Trade Setup Based on This Analysis
Entry Zone: Around $100,000–$98,000 (if price tests support and forms reversal patterns like a bullish engulfing or hammer).
Stop-Loss: Below $94,000 (below the 200 SMA and the trendline support).
Short-Term Target: $112,000–$115,000.
Mid-Term Target: $125,000–$130,000.
Risk Considerations
If BTC breaks below the 200 SMA and horizontal support near $94,000, the trend may weaken.
Thanks for your support!
DYOR. NFA

USDT dominance chart!The chart shows USDT.D (Tether dominance) moving within a descending channel.
Currently, USDT.D is testing the upper resistance of the channel, around 4.65%.
If the dominance gets rejected at this level, the next potential target is the lower channel support around 3.9-4.0%.
This could indicate a risk-off environment where traders move capital from stablecoins (USDT) to more volatile assets like Bitcoin or altcoins.
The 50 and 200 moving averages provide dynamic resistance levels that support this potential downside move.
Thanks for your support!
DYOR. NFA

ETH/USDT – Weekly Chart AnalysisETH/USDT Unique Technical Structure: Large Accumulation + Recovery Setup
This chart shows Ethereum’s price action over the past few years, highlighting key support and resistance areas. A strong visual signal (blue arrow) indicates bullish potential.
Chart Pattern Implications:
The pattern on this chart is not a classical shape (e.g., cup and handle), but it does show a Wyckoff-style accumulation phase followed by a failed breakout and reaccumulation:
Strong base formed between $1,000-$1,400
A series of lower highs and a range-bound structure after the 2022 peak
The bullish projection illustrated by the arrows shows a potential recovery towards the ATH again
This setup suggests that Ethereum is at a critical juncture – either:
It retests current support and begins a new uptrend.
Or it risks another test of the $1,400-$1,050 range before a breakout.
Risk-Reward: Current levels ($1,796) offer attractive long-term entries if you’re bullish.
Caution Zone: If ETH breaks below $1,400 with volume, $1,050 becomes the next key defense.
If you found this analysis helpful, hit the Like button and share your thoughts or questions in the comments below. Your feedback matters!
Thanks for your support!
DYOR. NFA

BTC/USDT – Weekly Chart Analysis (Long-Term View)BTC/USDT Chart Pattern: Multi-Year Cup and Handle Formation
The chart shows a textbook “cup and handle” formation, a highly reliable bullish continuation pattern. This pattern has played out over several years (2021-2025), indicating long-term accumulation and a breakout attempt.
Cup Phase:
Extended from mid-2021 to early 2024.
Formed a deep and rounded base, often indicating institutional accumulation.
The rounded lows reflect a gradual sentiment recovery from the 2022-2023 bear market.
Handle Phase:
A short-term consolidation after moving above the $70,000-$74,000 resistance area.
Price action pulled back marginally after hitting $110,000, forming higher lows near $85,000.
The structure resembles a bull flag or pennant, which is usually seen before the next upward move.
Key Support and Resistance Areas:
Key Support $70,000–$74,000. Previous resistance turned into support
Psychological Support $85,000 Local Retracement Low
Immediate Resistance $100,000–$110,000 Near ATH, selling pressure area
Long-term Target $130,000+ Measured move from cup pattern
Volume: Volume was high during the breakout from late 2024 to early 2025, which validates the breakout from the cup resistance area.
If BTC breaks above $100,000–$110,000 with strong volumes, we can expect continuation towards:
$130,000 (short-term target)
$150,000–$180,000 (extension based on pattern symmetry)
Bearish Risks:
Failure to hold $85,000 could lead to a retest of the $70K support area.
Sustained breakdown below $70K would invalidate the bullish pattern, but this seems unlikely given the strong fundamentals and macro structure.
If you found this analysis helpful, hit the Like button and share your thoughts or questions in the comments below. Your feedback matters!
Thanks for your support!
DYOR. NFA

Based on the BTC/USDT 4-hour chart:Current Price Levels: Bitcoin is currently trading around 85,269.35 USDT.
Support and Resistance:
Support Zones: A crucial support zone marked in green suggests strong buying interest between 80,000 and 81,000 USDT.
Resistance: The upper trend line indicates resistance; if Bitcoin can break it, it could target levels close to 88,000 USDT.
Bullish Case: A breakout above the upper trend line could lead to an upward rally towards 88,000 USDT or above.
Bearish Case: If the price breaks below the support zone, a downward move toward 75,000 USDT can be expected.
Monitor the trade closely to see how it reacts around these crucial levels. Based on the price action, adjust your strategy accordingly. Feel free to ask if you have further questions or need analysis on specific indicators!
If you found this analysis helpful, hit the Like button and share your thoughts or questions in the comments below. Your feedback matters!
Thanks for your support!
DYOR. NFA

BTC/USDT 1DAY CHART UPDATE !!50-day moving average (red line):
This is a short-term trend indicator. It reacts more quickly to price changes and is often used to identify short-term trends.
When the price is above this moving average, it usually indicates bullish momentum; when it is below, it may signal bearish momentum.
200-day moving average (green line):
This is a long-term trend indicator. It provides a smooth moving average that helps identify the overall trend over a long period.
A price above this line indicates a long-term bullish trend, while a price below it indicates a potentially bearish market.
Current Analysis
Price Action: As of the current date, the price is hovering around the 80,000 USDT, just below the 50-day MA, which may indicate a potential resistance area.
Convergence of MAs: The behavior of both the 50-day and 200-day MAs can provide insight:
If the 50-day MA crosses above the 200-day MA (a “golden cross”), this typically indicates a bullish signal.
Conversely, if it crosses below (a “death cross”), this can indicate a bearish sentiment.
Support and Resistance: The chart also shows areas of support (horizontal green lines) around 76,000 to 80,000 USDT. If the price breaks this resistance, it may have room to move towards the next levels indicated.
If you found this analysis helpful, hit the Like button and share your thoughts or questions in the comments below. Your feedback matters!
Thanks for your support!
DYOR. NFA

BTC/USDT 1DAY CHART UPDATE !!A downward trendline connecting the recent high points indicates bearish pressure.
A horizontal support level around 77,500 USDT shows where the price has struggled to drop.
Current Price:
As of your chart's timestamp, BTC is trading at approximately 79,883.75 USDT.
Potential Movement:
If the price can break above the descending trendline and stay above the support level, there could be potential upward momentum. The upward arrow suggests a bullish outlook.
Key Levels to Watch:
Resistance: Look for resistance at trendline breaks and the next significant levels above the current price (e.g., 82,500 USDT).
Support: The 77,500 USDT level is crucial; a drop below it could signal further downward movement.
If you found this analysis helpful, hit the Like button and share your thoughts or questions in the comments below. Your feedback matters!
Thanks for your support!
DYOR. NFA

BTC/USDT 4H Chart Update. Current Price: ~$78,336
BTC has broken below the symmetrical triangle and is testing the key horizontal support between $78,424 and $79,183.
A wick is visible below the support, but the candle closed within the area, indicating a potential fakeout or demand absorption.
Resistance (downtrend line): ~$85,500
Support Zones:
Primary: $78,424
Secondary: $79,183
Immediate Resistance: $82,000 – $83,000 (recent breakdown zone)
Outlook & Scenarios:
Bullish Reversal Scenario (Green Arrow):
The green arrow projection suggests a potential bounce from this demand zone.
If BTC reclaims $80K+ with strong momentum, it could aim for the descending trendline near $85K.
A bullish confirmation would be a 4H candle close above $80.5K–$81K.
Bearish continuation (if support fails):
If the price fails to hold this support zone, the next downside targets could be:
$76,000
$73,500
Sentiment factor:
The previous sentiment (Fear & Greed Index: 28 – Fear) reflects ongoing market caution.
Price action near key support in the fear zone could trigger a short squeeze or panic sell-off, depending on volume and reaction.
Summary:
BTC is at crucial support, and unless volume confirms a deeper breakdown, the bounce is likely to be short-lived.
Moving back above $80K would signal that bulls are regaining control.
Want any strategy ideas for trading this setup?
If you found this analysis helpful, hit the Like button and share your thoughts or questions in the comments below. Your feedback matters!
Thanks for your support!
DYOR. NFA

BTC/USDT 4H Chart Analysis !!Current Price: $83,809
The chart shows a symmetrical triangle pattern, indicating a possible breakout soon.
Upper Resistance: Around $86,000
Lower Support: Around $82,000
Key Support Levels: $79,183 and $78,424
Bullish Breakout (Green Arrow)
If BTC breaks above the resistance trendline (~$86K), it could see a strong move towards $90K-$92K.
Confirmation would be a candle close above $86K with volume.
Bearish Breakdown (Red Arrow)
If BTC loses the support trendline (~ GETTEX:82K ), it could drop towards $79K-$78K.
The candle closing below GETTEX:82K could fuel further selling.
Market Sentiment:
Fear & Greed Index: 28 (Fear) – Investors remain cautious.
The direction of the breakout will depend on market sentiment and volume.
If you found this analysis helpful, hit the Like button and share your thoughts or questions in the comments below. Your feedback matters!
Thanks for your support!
DYOR. NFA

BTC Dominance Chart Analysis. 50-day MA: 61.94% (Notable Support Level)
200-day MA: 59.21% (Strong Support)
Trend: The chart shows a bullish trend in BTC dominance since the beginning of the year, with higher lows forming.
Resistance Level: A key resistance area lies around 63%, which the price is currently testing.
Support Level: The 50-day and 200-day moving averages provide solid support below current levels.
Update Points
Short-term outlook: If BTC dominance stays above 62%, it could reach 63% resistance.
Long-term indicators: Continued support at the moving averages suggests bullish sentiment if BTC can maintain its position.
Market Conditions: Monitor fluctuations in altcoin performance, which could impact BTC's dominance positively or negatively.
If you found this analysis helpful, hit the Like button and share your thoughts or questions in the comments below. Your feedback matters!
Thanks for your support!
DYOR. NFA
