DYDX About to Explode or Collapse? Yello, have you seen what #DYDX is doing right now? This textbook falling wedge is running out of space, and the next move will either trap late sellers or leave sidelined bulls chasing.
💎#DYDXUSDT has broken out of its falling wedge pattern, and we’re now waiting for a clean retest of the breakout zone. Once that retest is confirmed, there’s a high probability of a bullish continuation move.
💎Previously, we saw price dip below the descending support, but that breakdown was quickly absorbed by buyers, flipping the script and revealing early signs of seller exhaustion. That kind of failed breakdown is a classic signal of demand strength.
💎 What’s even more telling is the reaction at the demand zone. Instead of panic or cascading liquidations, we’re seeing multiple rejections from the same support area—a clear signal that accumulation is underway.
💎 If price continues to push up from here and successfully retests the wedge, that would confirm a shift in market control. The first target is the minor resistance zone, and from there, any breakout backed by increasing volume could trigger a sharp expansion move toward the next major resistance area. That’s where momentum could accelerate quickly.
The bullish thesis remains valid as long as the current demand zone holds firm. However, a clean break and close below this area would invalidate the setup and open the door for a deeper correction.
MyCryptoParadise
iFeel the success🌴
Cryptosignals

TAKE Sell Short Signal (1H)After the price moved above the flip but failed to hold/confirm it, then broke the flip to the downside and printed a bearish CH (change of character). After sweeping the liquidity pool, the price continued its drop. We are looking for sell/short positions around the nearby order blocks.
Targets are marked on the chart. Take partial profits at the first target and move the position to breakeven.
Do not enter the position without capital management and stop setting
Comment if you have any questions
thank you

BCHUSDT Bulls Beware? Price Just Triggered a Classic TrapYello Paradisers! have you noticed how BCHUSDT just tapped into a key resistance right after sweeping liquidity above previous highs? This could be the perfect bull trap, and what comes next might catch many traders off guard if they’re not prepared.
💎BCHUSDT has just taken inducement and is now reacting from a strong resistance zone. Price is currently moving within an ascending channel while also showing clear bearish divergence, a combination that increases the probability of a bearish move. This setup suggests that momentum is weakening despite higher price action, often a red flag for trend continuation.
💎Aggressive traders may already be looking to enter short from current levels. However, the more strategic and safer approach is to wait for another reaction from the resistance zone, ideally accompanied by a clear bearish candlestick pattern. That will give us a much higher probability entry with a more defined invalidation level. If this confirmation comes, we can then look to target the liquidity pools and support zones lying below.
💎That said, if BCHUSDT manages to break and close above the resistance zone with strength, it would completely invalidate our bearish scenario. In that case, it’s best to stay on the sidelines and wait for fresh price action to develop before taking any new trades. Chasing trades without structure is where most traders lose.
🎖Strive for consistency, not quick profits. Treat the market as a businessman, not as a gambler. Stay patient, disciplined, and focused only on high-probability setups, this is the only way you’ll make it long-term in this market.
MyCryptoParadise
iFeel the success🌴

QNTUSDT Breakdown Loading? Yello Paradisers! Have you seen what’s forming on #QNT’s chart? A clean Head and Shoulders pattern is developing, and it’s signaling that a major move could be just around the corner.
💎The structure shows clear bullish exhaustion, with the left shoulder, head, and right shoulder all forming under weakening momentum. Price is now pressing directly against the neckline supports the final barrier before a potential trend reversal.
💎Adding fuel to the fire, #QNT has already broken below its ascending trendline, confirming that buyers are losing grip. If we get a confirmed close below the neckline with volume, the bearish setup becomes active, opening the door to more downside.
💎The first area to watch is 81.70, a minor support where short-term buyers may react. But the main downside target sits between 69.65 and 67.52, a strong historical demand zone and high-volume area that could attract heavier bids.
💎As long as QNT stays below 99.70, the bearish outlook holds. A reclaim of that level would invalidate the pattern and give bulls another shot at pushing higher.
Stay sharp, the setup is clean, but it’s also a classic trap zone.
MyCryptoParadise
iFeel the success🌴

DASH Breakout: Reversal or Trap?
Yello Paradisers, is this the beginning of a massive DASH reversal or just another fakeout that will punish impatient bulls?
💎#DASHUSDT has just broken out of a well-defined Falling Wedge formation, a classic bottoming pattern that often signals the end of a correction and the start of a new bullish phase. The move comes after a strong bounce from the major demand zone around $45–46, a level that has consistently attracted buyers and proven itself as a high-liquidity reaction area.
💎The breakout above the descending trendline shows that sellers are losing control, but the structure still demands confirmation. What matters now is whether the market delivers a clean retest. Ideally, a pullback toward the broken trendline or a dip back into the upper portion of the $45–46 demand zone would serve as a strong confirmation and potential entry trigger for the next impulsive move.
💎If buyers step in with strength on the retest, #DASH could start grinding higher toward the first resistance around $49–50, and if momentum sustains, the price may even push toward the more significant resistance region near $55.
💎That said, this structure is still fragile. A failure to hold the demand zone, particularly if price breaks below $44, would invalidate the bullish scenario and put DASH back at risk of deeper downside.
It’s not about being early, it’s about being right. Stay sharp and don’t let emotions dictate your trades. That’s the only way you make it far in this game.
MyCryptoParadise
iFeel the success🌴

BTC/USDT | Another try before bearish move? (READ THE CAPTION)Good day everyone, Amirali here.
As stated in the previous analysis, BTCUSDT reacted to the supply zone and faced a dropdown and now it is being traded 92,600 level right now. I expect another move to the FVG and seeing how it reacts before making a move. Should it manage to break through the 4H FVG, I expect a move to $96,900, the lower level of daily FVG.

ETHEREUM Analysis (12H)From the point where we marked the green arrow on the chart, the Ethereum triangle has begun, and at the point where we placed the red arrow, this triangle has completed and the price has entered a bearish phase.
It seems that we are currently in the late stages of wave C of this phase. Just note that this is the 12-hour timeframe, and this phase has not finished yet; its completion requires more time. We expect wave C to finish within the green zone, which is a supportive flip area.
From the green zone, wave C is expected to complete and the price should enter wave D, for which we have marked the targets on the chart.
Let’s see how it will unfold.
For risk management, please don't forget stop loss and capital management
When we reach the first target, save some profit and then change the stop to entry
Comment if you have any questions
Thank You

BTC/USDT | Consolidation and fall (READ THE CAPTION!)By examining the 4H chart of BTCUSDT, we can see that BTC is struggling to make a move and is consolidating over the IFVG. If it fails to make a move, a fall to the Demand Zone at 86,600 is possible. However, if it manages to go up, it'll face the FVG at 94,500 level, which then determines whether BTC can make an upwards move or falls again.

TRX Breakdown Incoming? This Trendline Retest Could Be the FinalYello Paradisers, could this be the final warning before #TRX breaks down completely? Or is the market setting up for a savage fakeout that will trap late sellers and then rip higher?
💎#TRXUSDT is currently retesting the ascending trendline after pulling back from the supply zone around $0.2820, a level that has consistently acted as strong resistance. Price action remains within a clearly defined ascending channel, with the lower trendline still providing solid technical support; however, momentum is beginning to shift. The MACD is starting to show signs of developing bearish pressure, supporting the likelihood of a potential downside continuation in the short term.
💎If the current retest fails and confirms a rejection from this supply zone, the probability of a move lower increases significantly. In that case, the price could first target the minor support around $0.2720, and if selling pressure continues, we would be eyeing the stronger support zone near $0.2660 as the next key level to watch. On the flip side, a confirmed breakout above $0.2900 would completely invalidate the bearish setup and instead favor a bullish reversal scenario, opening the door for a more aggressive leg up.
💎Right now, the market structure presents a clean and high-probability short setup. The risk is clearly defined above the $0.2820 supply zone, and if the rejection confirms, the setup offers a very favorable risk-to-reward ratio for disciplined traders.
Trade smart, Paradisers. The market is never generous for long, and only those who combine strategy with discipline will reach the winner’s circle.
MyCryptoParadise
iFeel the success🌴

BTC/USDT: Bulls Defend 89K as Price Eyes 96K ResistanceBTCUSDT is holding firm above its ascending trendline after defending the 89,000 support zone, preserving the broader bullish structure. The recent dip swept short-term liquidity before buyers re-entered, signaling a corrective move rather than a full reversal.
As long as price stays above 89,000, BTC has room to climb toward the 96,000 resistance zone near the weekly high. Continued higher lows and trendline respect favor upside, with consolidation phases adding strength to the bullish case.
➡️ Primary scenario: higher lows hold → continuation toward 96,000 resistance area.
❗️ Risk scenario: a break below 89,000 would invalidate the bullish setup and shift focus toward deeper support zones.

SOL at a Major Turning Point — Big Move Ahead#SOL
SOL is sitting right on its major weekly support, a zone that has held the chart together multiple times. This area is still acting as the main foundation for the current structure 🧱
If SOL can bounce from here and push back into the resistance zone above, the chart opens the door for a larger continuation toward the upper distribution area 🚀
We can already see how clean the structure becomes once price reclaims that mid-zone.
But if this major support fails to hold, SOL could slide into the deeper accumulation zone — a long-term area where strong buyers usually step in 👀
Right now, SOL is at a critical point. How it reacts here will shape the next big weekly move. Stay patient and follow the reaction, not the prediction ⚡
#SOLUSDT

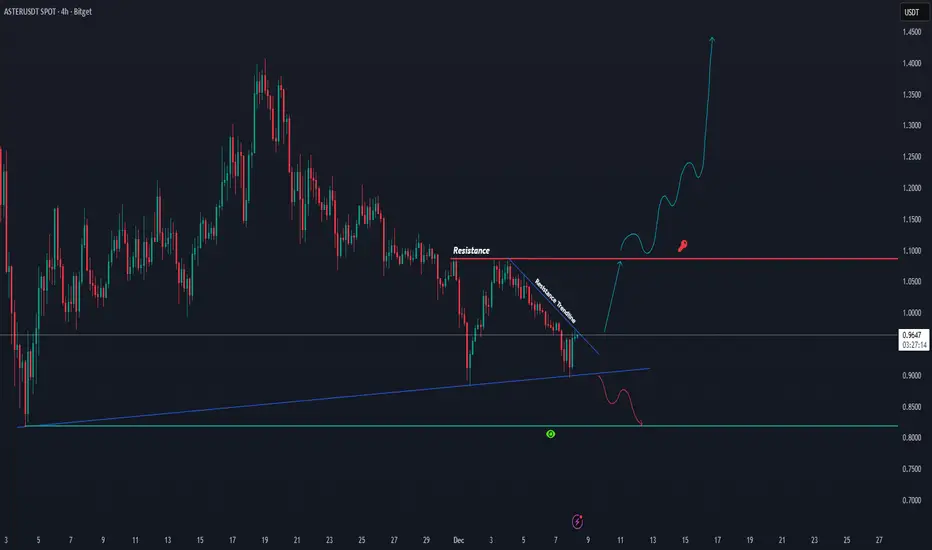
ASTER Squeezing Tight — Breakout Soon?#ASTER
ASTER is currently sitting right on its ascending support while still moving under the short-term resistance trendline. Price is compressing between these two areas, and a breakout in either direction is getting closer
🔥 If ASTER can break above the trendline and push through the resistance zone, momentum could flip bullish quickly and trigger a strong continuation move
🚀 But if it fails to hold the ascending support, a deeper pullback could follow
🔻 Right now, this is a classic “wait and react” setup — the chart is telling us the next big move depends on which side breaks first 👀
#ASTERUSDT
BNB/USDT : Rise or continue to fall?Hello friends
considering the downtrend we have and we have identified it, you can see that the power is in the hands of the sellers and every high it hits is a selling opportunity.
But there is one point, and that is this triangle that the price has formed. If it continues the trend, it is very likely that the price will fall again to the specified areas.
But if buyers want to break it and push the price up, the story changes and the price pivots we identified become the targets of the buyers who hit them.
This analysis is purely technically reviewed and is not a buy or sell recommendation. Please observe risk and capital management.
*Trade safely with us*

BTC/USDT | Another run over 100K? (READ THE CAPTION!)By analysing the 4H BTCUSDT chart, we can see that a fall into the FVG and dropping all the way too $87700, it has reacted positively and is now being traded at $91700!
We shall see if BTC manages to go through the daily FVG, which is the $96900-$98000 zone. If BTC goes over than zone, another run to over $100K is possible!
This analysis will be updated!

BTC at Critical Support — Bounce or Breakdown?BTC 4H Update
BTC is still moving in a controlled pullback after failing to break the 93,241 resistance. The rejection shows the market continues to respect this supply zone, and price is now hovering just above short-term support.
The key area to watch is the 88,850–89,200 support zone. If BTC can hold this level, a rebound toward 90,193 is likely, followed by another attempt to break the major resistance. A successful breakout would open the path toward the 98k–99.5k zone shown on the chart.
However, if this support breaks, price may slide into the OB 87,670–86,300 or even revisit the 85,650–85,000 support area — the same zone that created the recent higher low. Losing that level would weaken the bullish structure.
For now, structure is still intact, and BTC just needs a clean bounce to maintain upward momentum.

TAG Analysis (12H)Before anything else, please note that this coin has high volatility.
This coin is completing a bullish structure. The pattern is a bow-tie diametric, and we are currently in its G wave.
In the red zone, the G wave is expected to finish, and we anticipate a drop.
In the red zone, we will be looking for sell/short positions.
Targets are marked on the chart.
A daily candle closing above the invalidation level will invalidate this analysis.
For risk management, please don't forget stop loss and capital management
When we reach the first target, save some profit and then change the stop to entry
Comment if you have any questions
Thank You

BTC/USDT | $BTC Smashes Back to 94K but The Real Test Is Ahead!CRYPTOCAP:BTC pulled a full reversal after the heavy crash and pushed all the way back to 94K. Right now price is trading around 93K and this entire move basically filled the liquidity void created during the violent dump. For short term traders this is where I prefer staying on the sidelines because premium entries will show up again at lower levels once the market cools down.
For long term traders and holders nothing has changed. The bullish structure is still alive and if Bitcoin can break above 97K the next upside leg can easily extend toward 105K and even 106K. I will update the view again once we see how price behaves around the 97K zone.
Please support me with your likes and comments to motivate me to share more analysis with you and share your opinion about the possible trend of this chart with me !
Best Regards , Arman Shaban

CARDANO (ADAUSD): Bullish Reversal Confirmed?!
There are multiple bullish clues on ADA on a daily time frame
that make me think that the market is ready for a reversal.
First, the price formed a high momentum bullish candle.
Then, the market violated a resistance line of a falling
wedge pattern.
A change of character occurred afterward.
The market has a great potential to rise more
and reach 0.474 resistance soon.
❤️Please, support my work with like, thank you!❤️
I am part of Trade Nation's Influencer program and receive a monthly fee for using their TradingView charts in my analysis.

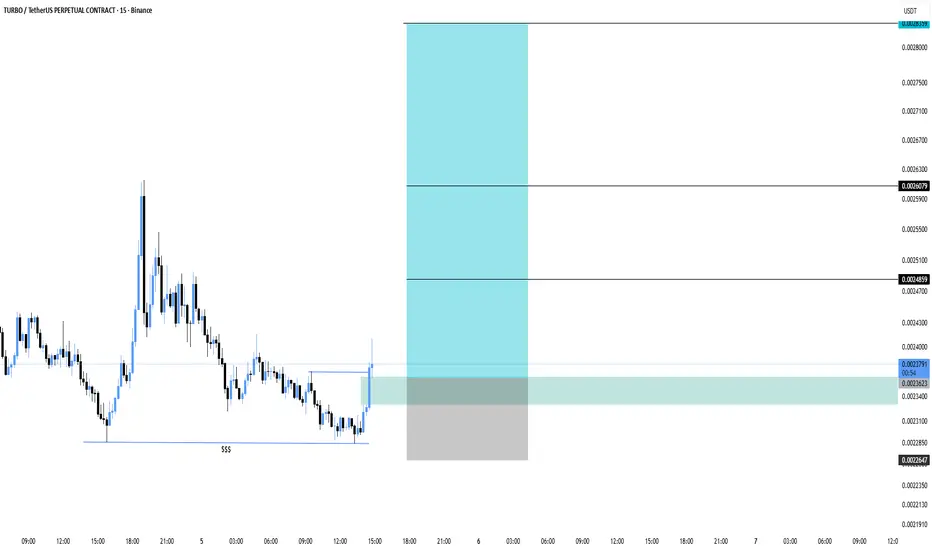
TURBO/USDT – Clean Long Setup After SweepPrice swept the liquidity (SSS) and instantly reacted with a strong bullish push. Structure is shifting short-term, giving a clean long opportunity as price taps the demand zone.
Entry: 0.0023623
Stop Loss: 0.0022647
TP1: 0.0024859
TP2: 0.0026079
Final TP: 0.0028359
#TURBO #TURBOUSDT #TURBOUSDTPERP
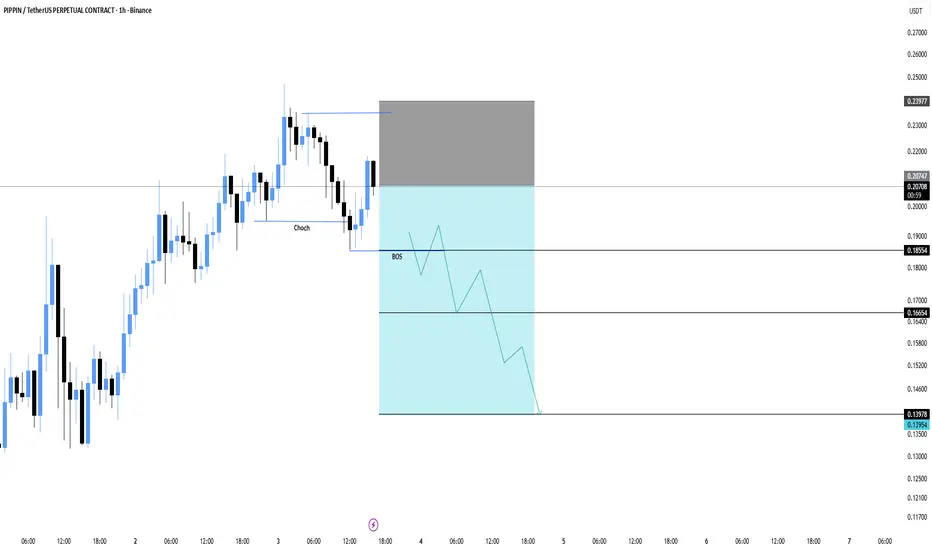
PIPPIN/USDT – Clean Short Setup, Dump Is coming!Price has shown a clear CHoCH followed by a BOS, confirming bearish structure. Current move is a retracement into the supply zone, giving a straightforward continuation-short opportunity.
Entry: 0.20747
Stop Loss: 0.23977
TP1: 0.18554
TP2: 0.16654
Final TP: 0.13978
BTC/USDT | The real test ahead! (READ THE CAPTION)Hello everyone, back with another analysis, this time on BTC.
By examining the daily chart of BTC, we can see that bitcoin has been boosted up after hitting the demand zone and is currently being traded in 93K zone. I expect a rise to 97k-98k FVG zone, if BTC manages to go past through this zone, a rise to 104K could be possible. Should it fail to go past 98K, another drop to 81K is likely to happen.

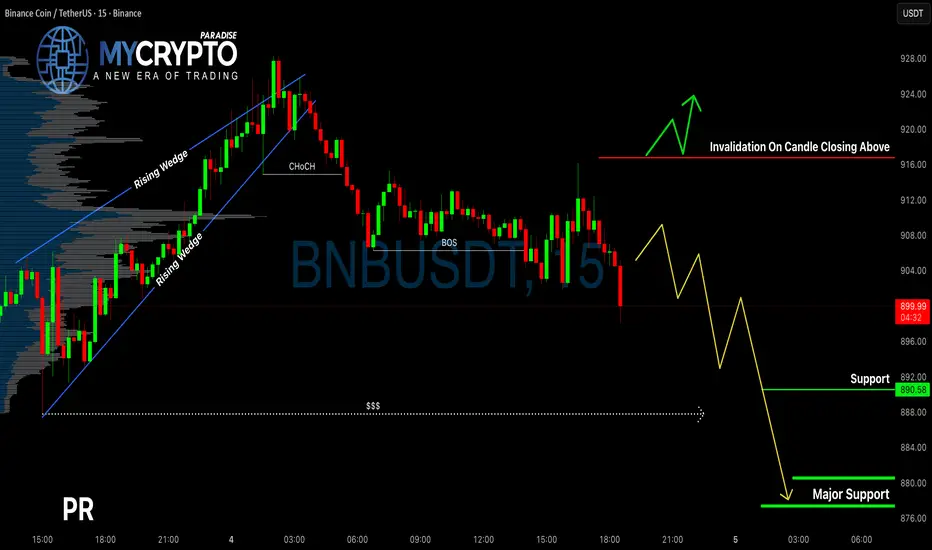
BNB Just Triggered a Breakdown, Are You Ready for the Next Move?Yello, Paradisers! Have you noticed how BNB quietly broke down from its rising wedge while most traders are still waiting for direction? This could be the early signal of a much deeper move—if you're not prepared, you might miss the whole thing.
💎BNBUSDT has officially broken down from a rising wedge formation—a pattern that typically signals a bearish reversal. What makes this even more significant is the clear bearish Change of Character (CHoCH) on the chart, which adds further confirmation that the trend may be shifting downward.
💎We’ve already seen a bearish Break of Structure (BoS), suggesting that downside momentum is building. However, instead of jumping in now, the higher-probability setup would be to wait for a pullback. Ideally, we want to see the price return to a more premium level, where we can then look for confirmation through a bearish candlestick pattern. That would give us a much better risk-to-reward entry point. Once confirmed, we’ll be targeting the next zones of liquidity and support lower on the chart.
💎That said, we always need to plan for the invalidation scenario. If price breaks above our invalidation level and closes a full candle above it, the current bearish thesis would no longer be valid. In that case, it’s best to step aside and wait for more reliable price action before taking any positions. Patience will protect your capital more than any indicator.
🎖Strive for consistency, not quick profits. Treat the market as a businessman, not as a gambler. The next few moves will separate those who follow their plan from those who trade emotionally. Stay sharp, Paradisers.
MyCryptoParadise
iFeel the success🌴
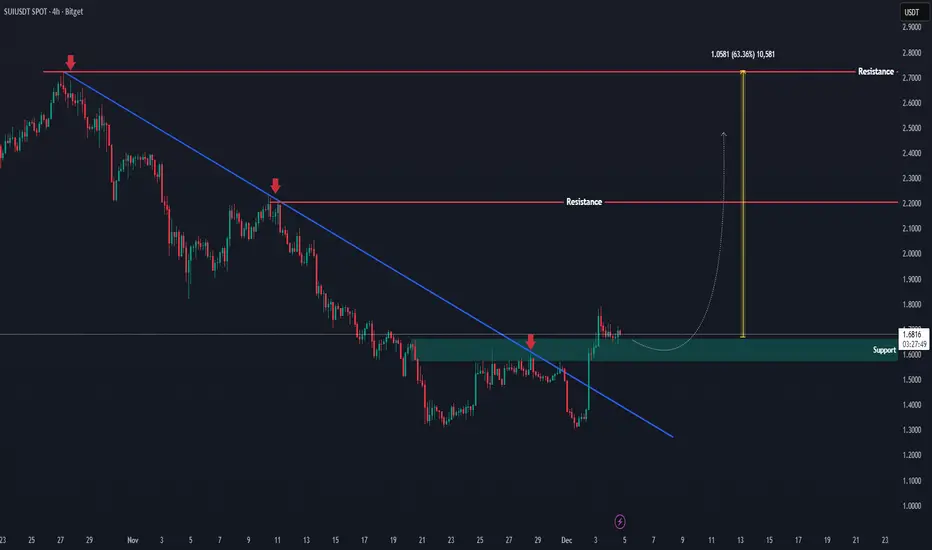
SUI Just Broke Out — A Big Move Might Be Loading!!SUI has finally broken out from its extended downtrend, showing a clean breakout above the descending structure. Price is now retesting the previous rejection zone, which has flipped into an important support area after the breakout.
If this retest holds, the chart suggests a potential continuation toward the next major resistance zone. The structure is showing early signs of a bullish reversal, with momentum beginning to shift to the upside.
For now, the key focus is how price reacts at this reclaimed zone — a strong confirmation here could open the path for a larger move upward.