SOL/USDT: Recovering from Flash Crash with Bullish Setup FormingSOL/USDT rebounded sharply from the $170 support following a flash crash and is now consolidating near the $200 level within a mid-range structure. Price action displays a sequence of impulse and correction legs, indicating buyers are attempting to regain control.
A stable close above $210 could confirm renewed bullish momentum toward the $230 resistance zone. The broader setup points to range accumulation, with potential for an upward breakout if momentum continues to build.
Cryptosignals

ETH: Technical Precision Amid the CrashIn spite of the crypto market crash, Ethereum actually moved very technically.
The break below the $4,300 support led to a drop toward the important $3,500 zone.
Although the price also broke below $3,850, a quick reversal followed — the rebound brought the price back above the $3,850 support and up to the $4,300 resistance.
A new wave of selling came next, but this time, the price stopped around the $3,850 support zone, confirming it as an important level.
A quick rebound followed, and now ETH is back above $4,000, trading around $4,100.
Also very important — the price of ETH is forming an ascending triangle, with resistance at $4,300.
A break above $4,300 will most likely accelerate gains toward the $4,900–$5,000 area, which is both a technical resistance and the target of the triangle.
I’m looking to buy on dips, preferably below $4,000, and considering the mentioned target, such a setup offers around a 1:3 or even 1:4 risk-reward ratio.
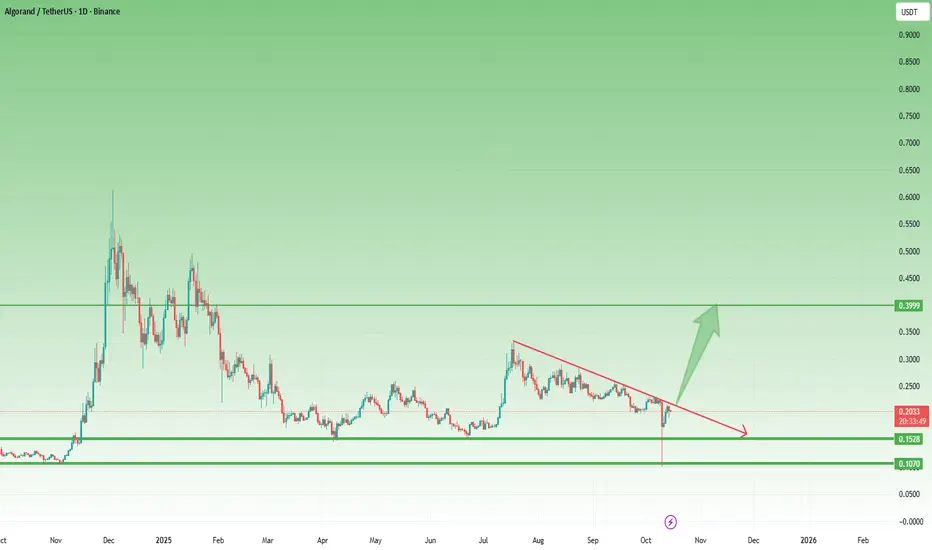
ALGO – Reversal from the Final Support ZoneLike most altcoins, Algorand also ended Friday’s crash by touching its final support zone, then strongly reversed.
After dropping to 0.10, the coin rebounded sharply and reclaimed the next key level at 0.15.
Currently trading around 0.20, ALGO is showing early signs of stabilization. If the overall crypto recovery continues, this setup could develop into a solid bullish signal.
The confirmation comes with a break above 0.2250, which would mark the end of the correction that started in December last year — opening the way toward the 0.40 zone.
Let’s see if the market confirms it. 🚀
LINK – Back Inside the Bullish FlagOn Friday night, Chainlink lost its confluence support from the 18.50 zone and dropped sharply to just under $10.
However, looking at the chart, we can clearly see the importance of this area, marked by both the 2022–2023 accumulation resistance and the 2024 lows.
From there, the coin rebounded fast, managing to reclaim the 18.50 support and re-enter the bullish flag that started forming at the end of August.
This recovery shows strong buying interest — but no clear buy signal has yet appeared.
For now, LINK remains a coin to watch closely.
A confirmed breakout above 21.50 would open the door for a new bullish leg, with 30 USD as the next technical target.

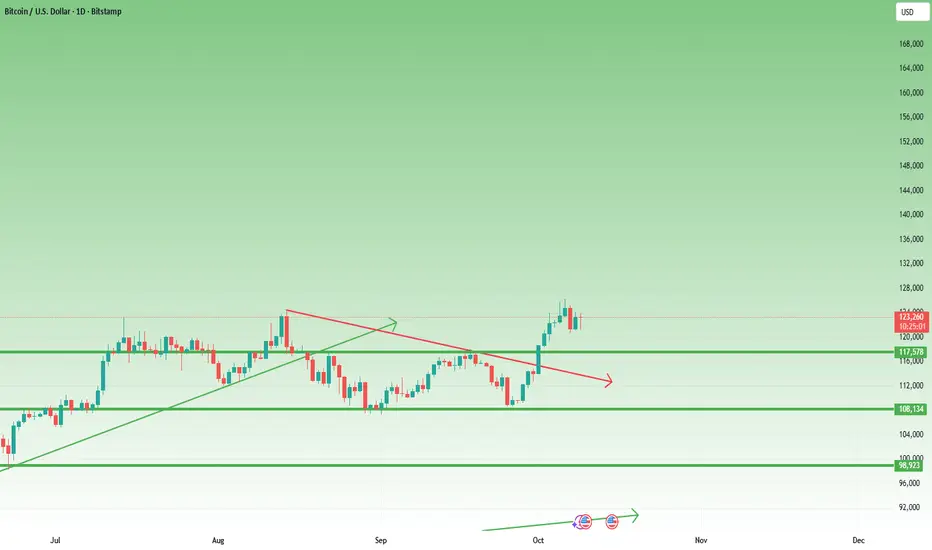
Why This BTC Price Action Doesn’t Inspire ConfidenceIn my yesterday’s analysis, I raised a rhetorical question: I s Bitcoin in a corrective rebound, or are we witnessing a genuine upside reversal?
Even in my Sunday educational post, I mentioned that the whole “ great reset, now we go up ” narrative doesn’t resonate with how I view trading.
At the time of writing, BTC is down again around 112K, after touching once more the 110K support zone — almost like a second chance for those who missed the first dip.
However, this kind of price action is far from encouraging in my opinion.
________________________________________
Technical Picture
• The price reversed before the 118K resistance, forming what can now be viewed as a lower high.
• If the 110K level breaks, the next obvious target remains 100K, both from a psychological and technical perspective.
________________________________________
Trading Plan
My plan is to sell preferably around the recent high, aiming to position with the broader structure rather than chase short-term fluctuations.
BTC still needs to prove it can sustain an uptrend — until then, rallies look like selling opportunities rather than the start of a new bull leg.
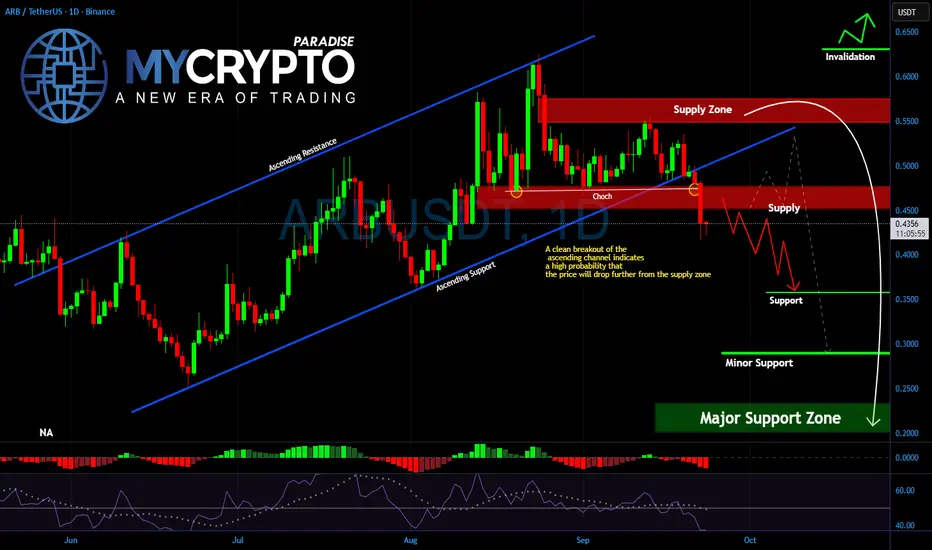
ARB Breaks Structure – Is the Drop to $0.30 Already in Motion?Yello Paradisers, what happens when a strong uptrend finally cracks under pressure? That’s exactly what we are seeing with #ARBUSDT right now. The ascending channel that carried price action since June has officially been broken, and history tells us this is rarely a small signal. A clean breakdown from such a channel often marks the beginning of a deeper move, and #ARB is showing all the signs that more downside could unfold.
💎After failing to hold inside the channel, #ARB retested the broken zone but quickly rejected from supply around $0.45–$0.50. This rejection zone is now the key barrier standing above price. As long as #ARBITRUM trades below it, sellers are in control, and the probability of further decline remains high.
💎The next important area to watch lies at $0.35, which acts as the first strong support. If that level gives way, the move could accelerate toward the $0.30 minor support before potentially reaching the major support zone around $0.20–$0.25. This entire area is where bigger buyers could look to step in, but until then, the path of least resistance is clearly to the downside.
💎Invalidation for this bearish outlook would only come if AMEX:ARB reclaims the $0.55 supply zone and holds above it. Until then, traders must respect the bearish momentum.
🎖Strive for consistency, not quick profits. These breakdowns are where inexperienced traders get wiped out, while disciplined ones wait patiently for the best opportunities.
MyCryptoParadise
iFeel the success🌴
CAKE Analysis — Bulls Still in the GameIn my previous CAKE analysis, I mentioned that the coin could rise to at least 5 USD, following a breakout above the 1.5-year accumulation resistance.
That projection worked well, with CAKE reaching a high around 4.5 USD before entering what initially looked like a normal correction. However, Friday’s massive liquidation event turned that pullback into a sharp drop.
Yet, unlike many other altcoins that are still trading below their broken supports, CAKE showed an impressive recovery, quickly reclaiming the lost level. This kind of V-shaped recovery often signals strong underlying bullish pressure and confident buyers.
Technical outlook:
• Bias: Bullish again
• Key support: 3.00 USD (as long as price holds above, trend remains constructive)
• Target zone: 5.00 USD
• Strategy: Look for entry points near 3.00 USD or during healthy dips above that level
Momentum has shifted back to the bulls, and as long as 3 USD holds, the path of least resistance remains upward. 🚀
Where Can We Rebuy OM? (1W)After the heavy drop, it became evident that a bearish trend had started, and the price is now seeking high-liquidity (buy) zones.
Based on the chart, the green zone stands out as the best area for a potential rebuy — it could launch the price upward by 100% to 500%.
Reaching this zone may take several weeks or even months.
A weekly candle closing below the invalidation level would invalidate this outlook.
For risk management, please don't forget stop loss and capital management
Comment if you have any questions
Thank You

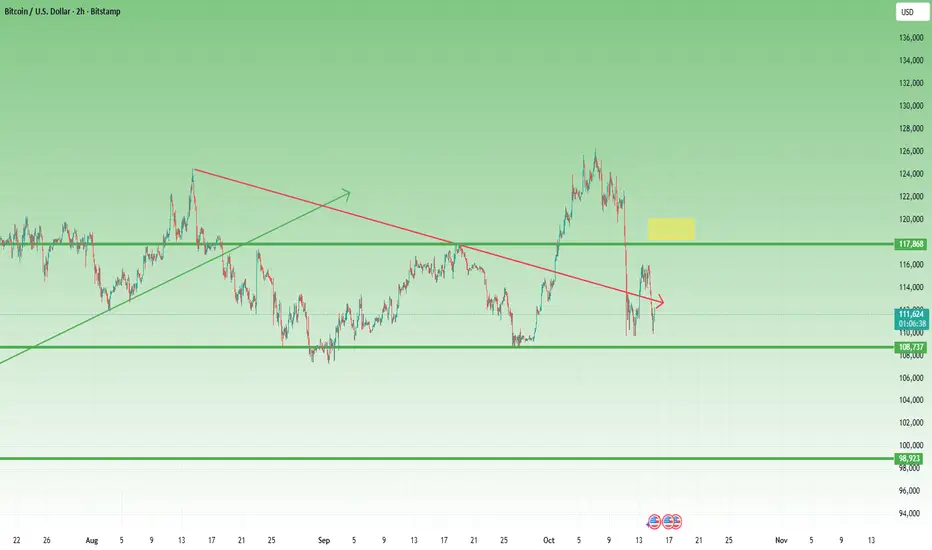
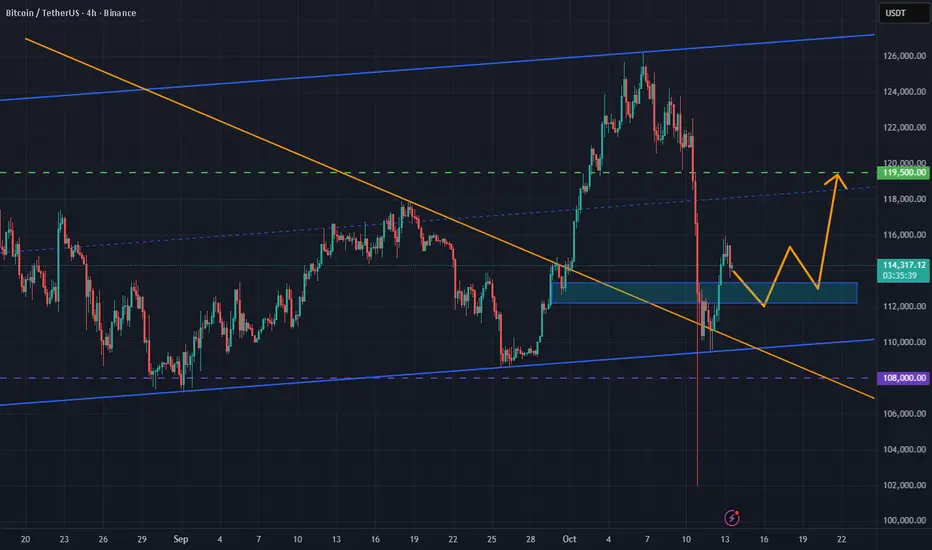
BTC/USDT:Sharp Rebound Signals Recovery Within ConsolidationRageBTC/USDT bounced strongly from the 102,100 support level following a flash crash, indicating renewed buying interest near structural lows. The pair continues to trade within a broad consolidation range, with 119,500 serving as a key resistance target.
A sustained break above the trendline could confirm recovery momentum toward the all-time high at 125,000. The recent flash crash may have cleared out weak hands, paving the way for market stabilization and potential re-accumulation.
Is #HBAR About to Break Down Hard? Don’t Get Trapped by BearsYello Paradisers! Are you prepared for what might be the next major shakeout on #HBARUSDT? Let’s break down the current setup of #Hedera:
💎#HBAR has been moving within a descending channel since mid-July, consistently being rejected by the descending resistance trendline. Each bounce has been weaker than the last, and we're now approaching the lower edge of this structure with selling pressure intensifying.
💎As of now, HBAR is trading around $0.224, and the next few daily candles will be critical. If you're not managing your risk carefully here, the upcoming volatility could eat your capital alive. The 50 EMA is currently acting as a dynamic resistance, pushing the #HBARUSD lower each time it attempts a bounce. As long as the price remains below this level, the bearish pressure will likely continue.
💎A clean breakdown below the descending support of this channel would be a high-probability bearish confirmation. If we get a breakdown + retest rejection, #HBAR could accelerate toward the Moderate Support zone at $0.166. Then eventually, reach the Strong Demand Zone near $0.127, where we expect more serious buy interest to step in.
💎The bearish setup is invalidated on a confirmed breakout above the resistance zone at $0.255–$0.278. Only if price reclaims and holds above this range will we consider shifting back to a bullish bias. Until then, every bounce is likely to be sold into.
Trade smart, Paradisers. This setup will reward only the disciplined.
MyCryptoParadise
iFeel the success🌴

TAO Analysis – Strength After the DropIn my last week’s TAO analysis, I mentioned that the coin remains bullish, with the $300 zone being an excellent buy area.
Friday’s market-wide crash also hit TAO, but what followed was far more important.
________________________________________
1. Reaction After the Drop
• The decline stopped exactly at the previous support.
• Price quickly recovered the $300 level, turning it back into support.
• That support was retested and held again, confirming its strength.
• Finally, TAO broke above resistance and even made a high above Friday’s top.
________________________________________
2. Outlook
All these are bullish confirmations of strength and resilience.
If the broader market continues to stabilize, TAO could extend its move toward $500, followed by $700 as the next potential target zone.
The outlook stays strongly bullish as long as $300 remains intact.
________________________________________
Conclusion:
TAO continues to outperform and show real momentum.
Support respected, resistance broken, buyers in control. 🚀

Too Early to Buy Solana? Watch the $200–210 ZoneAs mentioned in my general crypto post yesterday, I remain bullish on the broader market and still hold some altcoins at this stage.
However, that doesn’t mean we should jump in blindly, assuming this is it.
Every setup needs confirmation — and Solana is no exception.
At the time of writing, SOL/USD is trading close to my initial entry area, but price action deserves a closer look.
1. What Happened on Friday
The general market sell-off pushed Solana below both a key horizontal support and the lower boundary of its rising channel — a clear bearish technical signal.
After that, we saw a strong recovery into the weekend, with price touching the psychological $200 level overnight before facing some resistance.
2. Current Market Structure
Despite the bounce, the structure remains bearish for now.
A clean stabilization and acceptance above the $200–210 zone would be the first technical sign of a potential trend shift to the upside.
3. Trading Plan
If you’re considering a long position on Solana, I believe it’s too early to enter.
The market looks overconfident in recovery, and when everyone assumes “the bottom is in,” that’s often when a new drop comes.
Wait for confirmation!

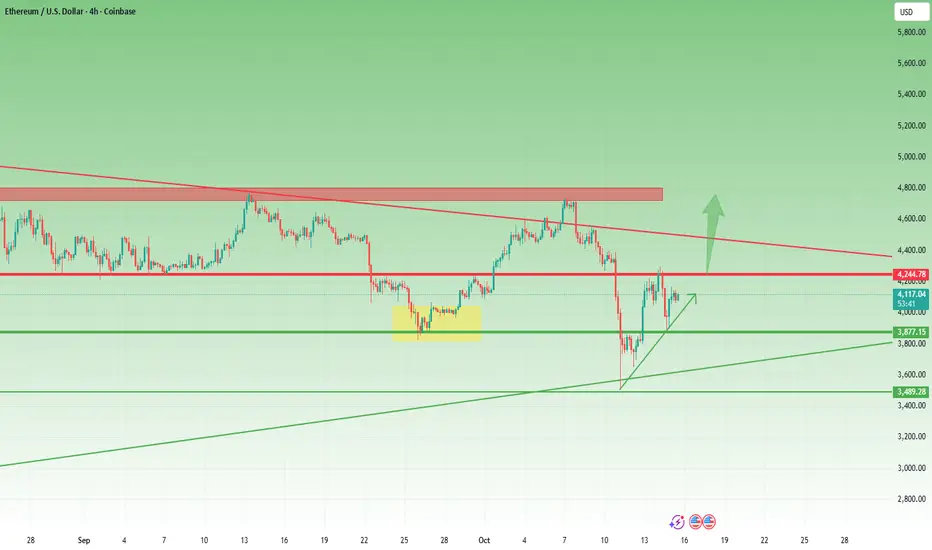
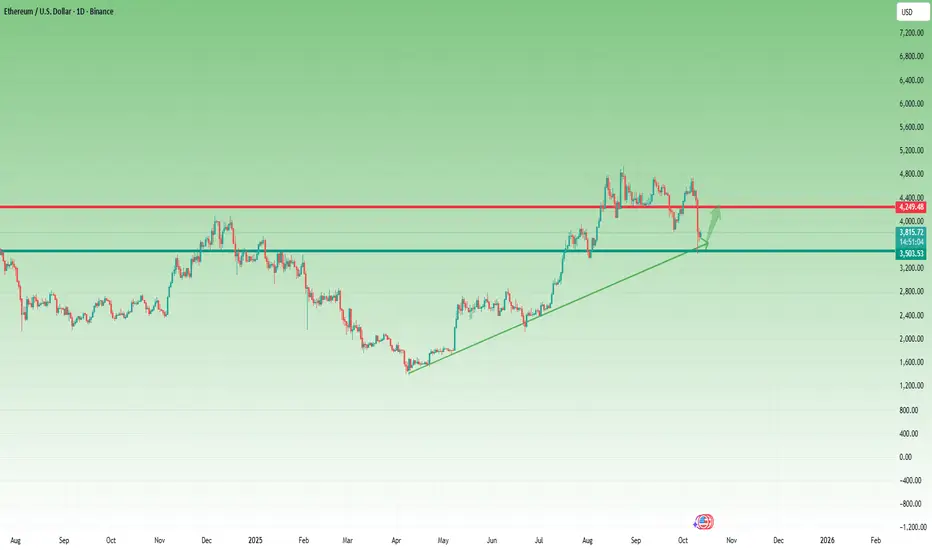
ETH— What the 3500 Support Means and How I’m Trading ItExactly on Friday, just before the big drop, I bought ETH at 4300.
Fortunately, I had a stop loss at 4150, which — of course — got triggered.
But instead of frustration or searching for someone to blame, I took it like a trader should — accepted it, moved forward, and focused on what’s next. Because in trading, maturity starts where ego ends.
Technical Picture
Looking at the chart, after breaking the 4300 support line, ETH accelerated to the downside and found buyers around 3500.
This level is not random — it’s defined by:
1. A major horizontal support
2. The ascending trendline from previous lows
3. And the psychological round number of 3500
Naturally, we saw an initial rebound from that area.
Trading Plan
If the market retests the 3500 zone, I’ll be looking for buying opportunities, targeting a potential retest of 4300.
However — and this is crucial — my trade will be low-volume and protected by a tight stop.
Why? Because while I believe this could be a turning point, so does everyone else.
And when every retail trader sees the same thing, I trade carefully — because as we’ve all learned now, there’s no such thing as free money.
Final Thought
Discipline is not about winning every trade — it’s about staying rational when emotions scream louder than logic.
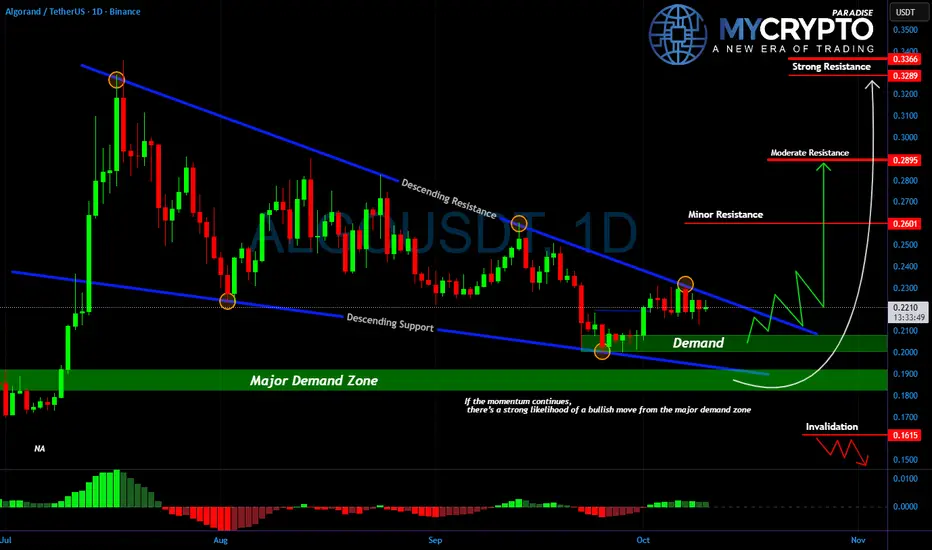
ALGO on the Edge: Will the Next Move Catch Everyone Off Guard?Yello Paradisers, are you prepared for what could be the breakout that surprises the entire market? While most traders are distracted, #ALGOUSDT is quietly compressing inside a clean descending wedge structure, and the pressure is reaching a critical point.
💎After weeks of bleeding, #ALGO has established a solid base within the major demand zone between $0.185 and $0.20. This area has held strong multiple times, showing clear signs of aggressive buying each time price touches down. It’s no coincidence this zone is being defended, and smart money knows it.
💎Price is now consolidating just below the descending resistance line, and every touch to the downside has become weaker, signaling a potential shift in market control. If momentum builds from here, a confirmed breakout above the $0.23 level could open the path toward higher targets. The $0.26 region will likely act as the first minor resistance, followed by stronger supply zones around $0.288 and $0.3289, where historical selling has previously stepped in.
💎However, as always, we must stay grounded in probabilities. Invalidation sits clearly below $0.1615. A break beneath that level would invalidate the bullish structure and shift the momentum back into the hands of the bears.
💎Until then, this remains a high-probability accumulation pattern. But remember, the market often fakes in one direction before delivering the real move. That means a final shakeout can’t be ruled out before the breakout. This is where emotional traders get liquidated and where the disciplined ones wait with confidence.
Strive for consistency, not quick profits. Treat the market as a businessman, not as a gambler. This is the only way you will make it far in your crypto trading journey. Be a PRO.
MyCryptoParadise
iFeel the success🌴
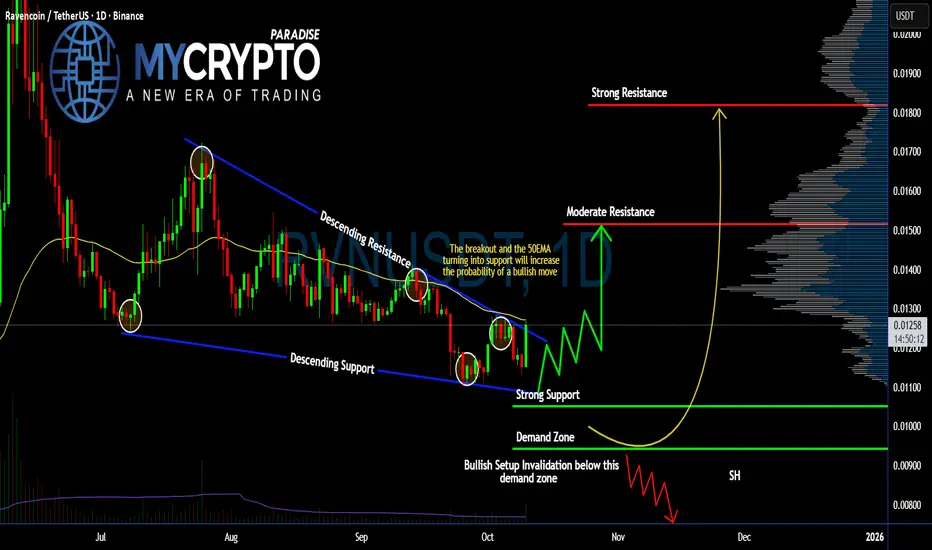
#RVN Ready for an Explosive Bullish Move | Must Watch For BullsYello Paradisers! #RVN just broke out of the descending channel exactly as we expected... but will it hold this time, or is this another fakeout? Let’s break down this #Ravencoin setup:
💎#RVNUSDT has been trading inside a well-respected falling wedge since July. After multiple rejections from the descending resistance, the price is about to break out and close above the structure. This move will also reclaim the 50EMA, which will act as support. If this EMA continues to hold, it will increase the probability of continuation to the upside.
💎The key bullish confirmation here is not just the breakout, but the structure of support forming right above the previously broken resistance line. This creates a possible bullish flip, turning old resistance into new support — one of the cleanest continuation patterns we look for.
💎If the current breakout holds, the next target for #RVNUSD to watch is at 0.015. A clean daily close and hold above that level would open the door for a stronger move toward 0.018, which is the next major resistance zone based on the volume profile.
💎Price is now holding above the strong support at 0.01052, and as long as we remain above the demand zone between 0.01052 and 0.00943, the bullish setup is valid. This area is now our invalidation level. A break below this zone would invalidate the structure and open up further downside.
Strive for consistency, wait for clear confirmations, and remember that discipline always beats chasing quick profits.
MyCryptoParadise
iFeel the success🌴
ASTERUSDT – Potential Reaccumulation Phase Before ExpansionAfter a strong impulsive rally in late September, ASTERUSDT is now entering a correctional phase, showing signs of a possible reaccumulation structure. The price has broken below the short-term trendline and is currently trading under the previous supply zone (1.75–1.80), confirming short-term weakness before potential re-entry opportunities.
The Support Zone (1.15–1.30) aligns perfectly with the hourly Order Block (OB) and liquidity pocket, suggesting this region as a high-probability area for manipulation or a liquidity sweep before the next bullish leg.
The ideal scenario would be a fake breakdown toward 0.85–1.00, triggering stop hunts, followed by a sharp rebound reclaiming the 1.15–1.30 levels — confirming bullish intent.
A successful manipulation and reclaim could drive the next expansion phase toward 2.40+, completing the reaccumulation cycle.
Key Highlights:
Trendline break with short-term bearish correction
Support Zone and OB (1H) between 0.85–1.02
Potential bullish continuation target: 2.40
Setup invalid below 0.80
Final Thoughts:
ASTER is likely setting up for a deep retest before continuation. Patience is key here — let liquidity form around the lower range. If structure confirms recovery from the support zone, the next impulsive wave could deliver a strong upside toward the previous high.

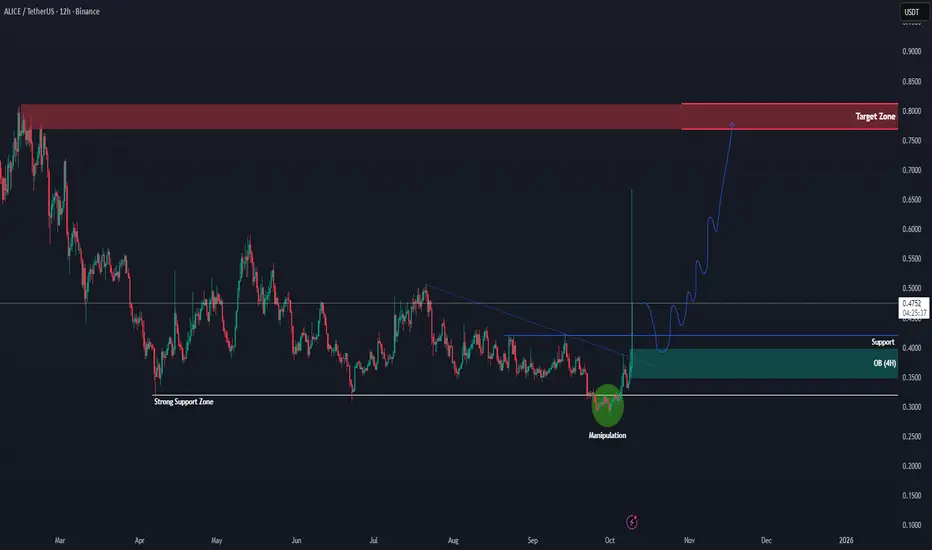
ALICEUSDT – Potential Trend Reversal After Long Accumulation PhaALICEUSDT – Potential Trend Reversal After Long Accumulation Phase
After several months of sideways movement, ALICE finally shows strong signs of reversal. The chart reveals a clear manipulation phase below the strong support zone, where price briefly dipped before quickly recovering. This manipulation often indicates that liquidity has been swept and smart money is entering the market. The breakout above the descending trendline confirms that bearish momentum is fading and a new bullish structure could be forming.
Currently, the 4H Order Block around 0.35–0.40 has turned into a solid support zone. As long as price holds above this area, the bullish outlook remains valid. A possible short-term pullback to retest this zone would create a healthy correction and a good entry opportunity for continuation toward higher levels.
The next major target sits around the 0.75–0.80 region, which aligns with the previous major resistance zone and liquidity area. However, if the price breaks back below 0.35, it would invalidate the current bullish setup and open a possibility for a deeper retracement. For now, ALICE is showing promising momentum, and the structure supports a potential mid-term bullish rally.
Bitcoin Outlook: Structure Intact, 140K Still on the TableIn my previous BTC analysis, I mentioned that a new all-time high was almost a certainty, with potential for a new leg up toward 140K–150K.
Indeed, BTC delivered — printing a fresh ATH, followed by a short and healthy correction.
At the time of writing, the price has reversed from just above 120K, showing strong demand.
Today’s daily candle displays a long lower tail, a clear sign of buying pressure, and could easily close as a continuation Pin Bar — signaling that bulls are still in control.
Key Zone to Watch
118K support – remains the line in the sand.
As long as this level holds, bulls have no reason for concern and the “buy the dips” strategy stays valid.
Outlook
Momentum remains bullish, structure remains intact, and the path toward 140K stays open — until proven otherwise. 🚀
AAVE/USDT;BUY LIMITHello friends
Given the price reaching the specified support and the strong support of the price by buyers in the specified range and the failure of the specified resistance, we can buy in steps with risk and capital management and move to the specified targets.
*Trade safely with us*

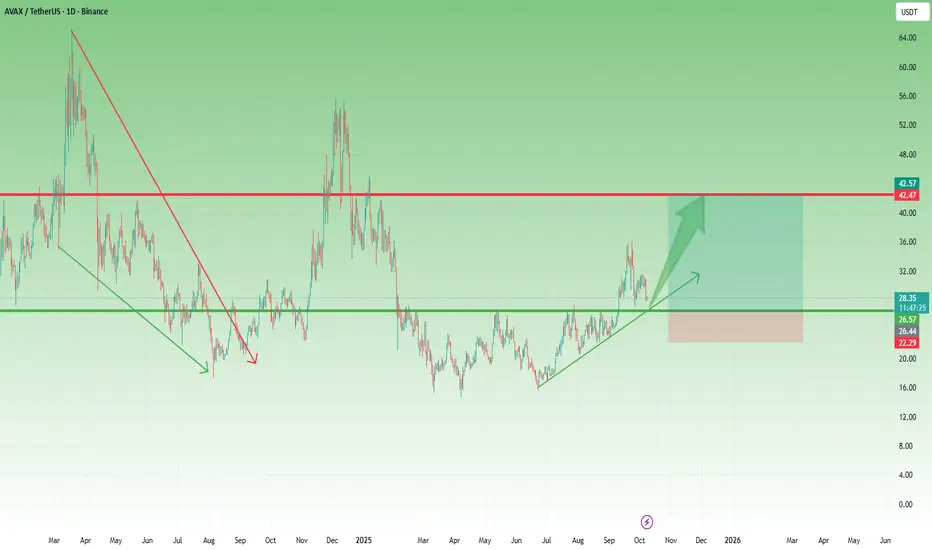
AVAX – Retest in Progress Before the Next Push UpAfter breaking the key resistance zone at $26.60, AVAX surged strongly, reaching a high of $36.60 in one decisive leg up.
Now, the price is pulling back to confirm the breakout, approaching the previous resistance, which could now act as support.
This area represents a confluence zone, aligning with the rising trendline from June, and may serve as a strong accumulation level for bulls preparing for the next upward leg.
From a risk/reward perspective, this setup is also attractive, offering an estimated 1:4 ratio — a solid structure for a technical long entry.
I’m looking to buy around this zone, with expectations for a continuation toward new highs once confirmation appears. 🚀
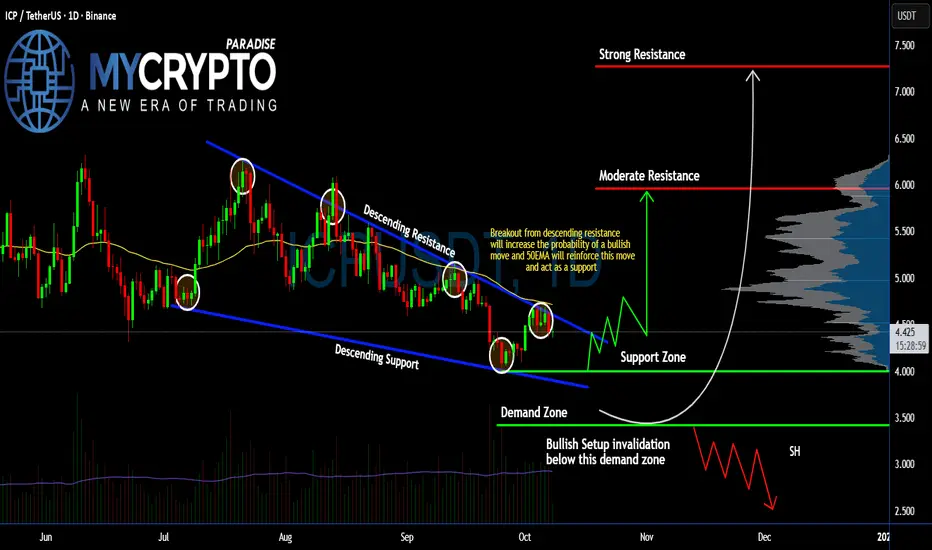
Is #ICP Ready to Make a Bullish Move? Watch it Closely Bulls Yello Paradisers! Will #ICP finally break out of this long-standing downtrend, or is a brutal shakeout brewing just below the surface? Let’s dive deep into #InternetComputer setup:
💎#ICPUSDT has been stuck inside a falling wedge since mid-July, bouncing precisely between descending resistance and support. Currently, the price is coiling right beneath that descending resistance line, and the squeeze is getting tighter. A breakout from this zone would significantly increase the probability of a bullish reversal, especially with the 50EMA right above acting as dynamic resistance-turned-support if the breakout is confirmed.
💎The support zone around $4.0 has already triggered multiple bounces in recent sessions, showing strong buyer interest. If bulls can hold this level and push through the channel resistance, the first key upside target is the moderate resistance at $5.96.
💎A successful break above $5.96 would open the door to the strong resistance at $7.27, where we expect significant selling pressure. For the #ICPUSD, volume confirmation on the breakout will be crucial, and without it, any move may turn into a bull trap.
💎On the flip side, if #ICP fails to hold the $4.00 support and breaks below the demand zone at $3.42, the bullish scenario will be invalidated. That would likely lead to a continuation of the downtrend with a sharp leg lower, potentially printing new short-term lows. This is the final line of defense — if lost, we expect stop-hunts and heavy liquidations to follow.
Strive for consistency, wait for clear confirmations, and remember that discipline always beats chasing quick profits.
MyCryptoParadise
iFeel the success🌴
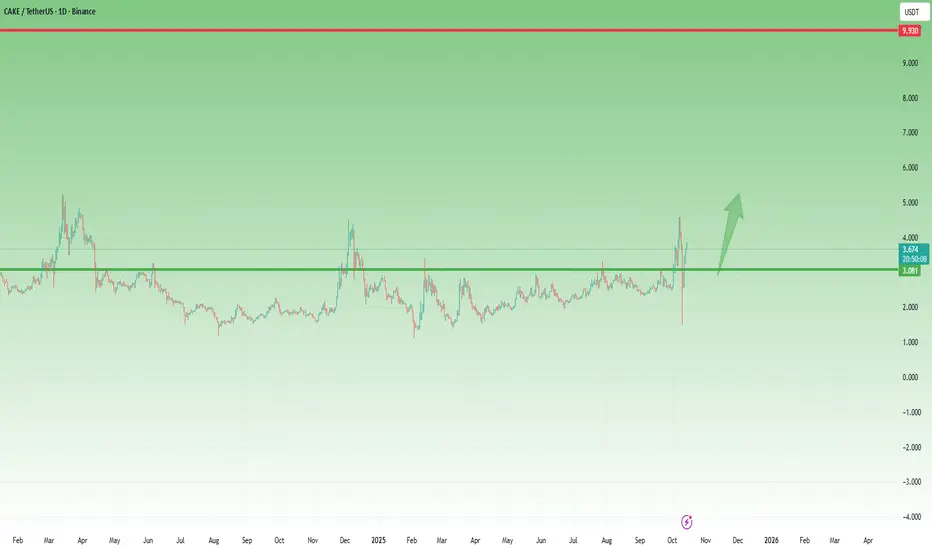
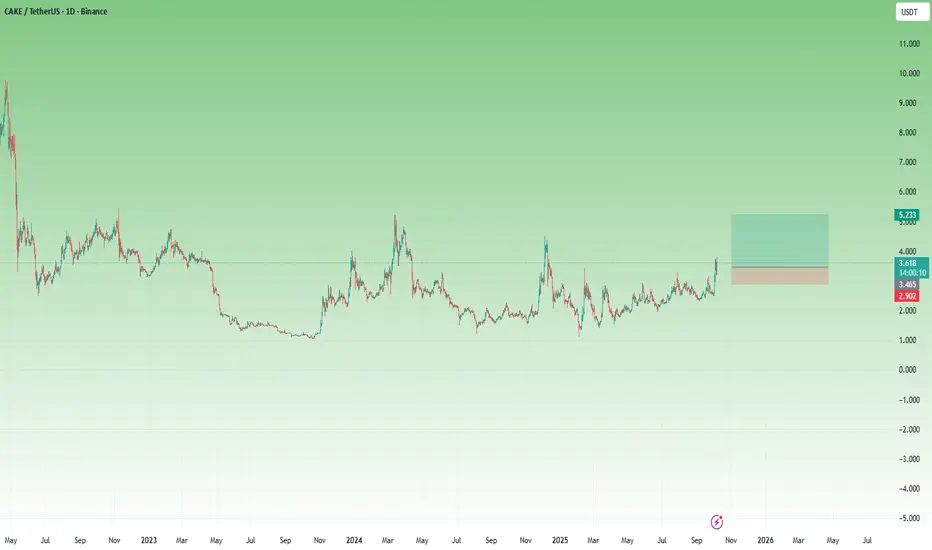
CAKE – Ready for Continuation After a Perfect Breakout RetestAfter the low from April, which aligned almost perfectly with the 2023 bottom, CAKE has shown remarkably constructive price action, steadily forming higher lows and repeatedly pressing against the $3 resistance zone.
Last week, the price finally broke above this major resistance and, in a textbook technical fashion, came back to retest the breakout level before rebounding strongly — confirming buyer commitment.
At the moment, CAKE trades around $3.5, holding well above the former resistance and showing signs of a potential upside continuation.
________________________________________
Key Levels & Outlook
• Support: $3.0 (former resistance, now key support)
• Intermediate target: $5.0
• Extended target: $10.0 (if momentum and broader market sentiment remain strong)
________________________________________
Trading Plan
My preferred strategy is to buy dips against the $3 level, aiming for $5 as a soft target, while keeping a runner for a potential test of $10 if the bullish momentum accelerates.
CAKE has proven resilience — now it’s time to see if it can turn this constructive structure into a sustained breakout.
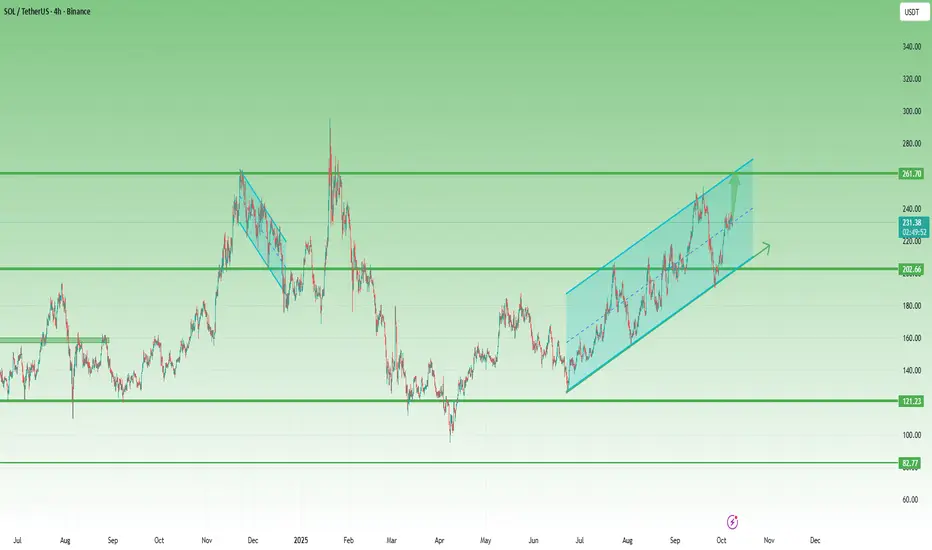
Solana in an Ascending Channel – Bulls Must Hold Above 215After the strong correction from 300 to below 100, Solana finally started to recover. Following an impressive 90% rebound, the price corrected again but managed to form a higher low just above the 120 support zone — a constructive signal for medium-term buyers.
Since then, Solana has been trading inside an ascending channel, showing consistent bullish control with well-defined higher highs and higher lows.
Recently, the market spiked slightly below 200, only to confirm the lower boundary of this channel before bouncing back.
In my previous SOLUSDT analysis, I mentioned that it was imperative for bulls to hold the 200 level to validate the ongoing reversal structure — and that’s exactly what happened. The market respected this support zone perfectly, leading to a 15% advance since then.
At the time of writing, Solana is consolidating near the midline of the ascending channel, suggesting a temporary pause before the next potential leg higher.
If this consolidation breaks to the upside, the next key target for bulls is 260, a confluence resistance formed by the upper boundary of the channel and the November 2024 swing high.
________________________________________
🔹 Summary
• Strong support: 200 (confirmed)
• Ideal bullish threshold: Above 215
• Next resistance: 260 followed by 300
• Structure: Ascending channel – continuation pattern
________________________________________
In conclusion, Solana remains bullish while holding above 200, but ideally, the price should stay above 215 to preserve upside momentum.
A breakout above 240 would likely trigger a test of 260 followed by 300, which becomes very probable— the next key resistance zone. 🚀