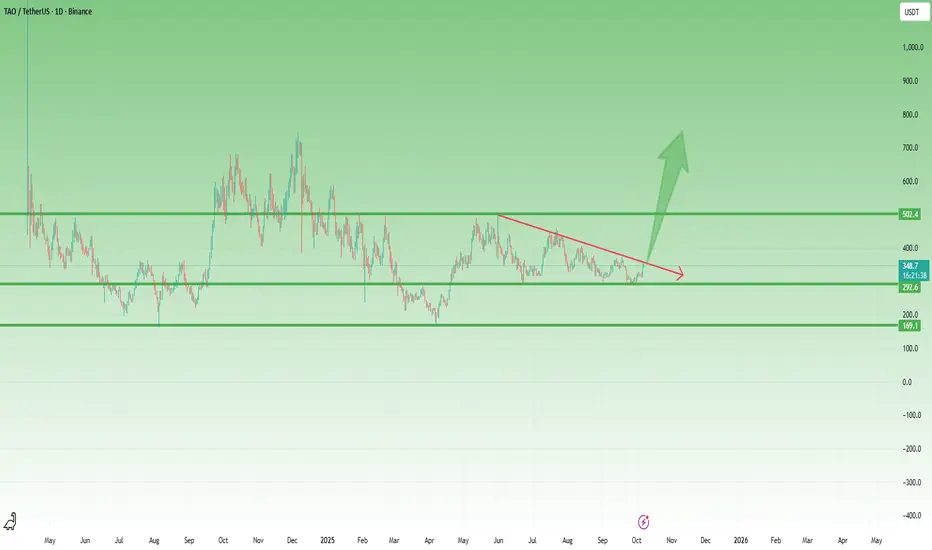
TAO – Constructive Recovery and Key Levels AheadTAO made a significant low in April, just like most crypto assets. Interestingly, this low is perfectly aligned with the one from August 2024, suggesting a strong structural base in the market. From that point, price started to rise in a very constructive and orderly manner, confirming a shift in sentiment.
After the initial rally, TAO touched the 500 zone, a key psychological and technical level. As expected, the market corrected from there, dropping just below 300. What’s notable is that the recent low sits precisely around this 300 area, now acting as a strong support level.
At the time of writing, the price is around 350, currently testing the falling trendline from previous highs. If we see a confirmed breakout above this line, I expect acceleration to the upside, with an initial and conservative target around 500.
However, if momentum continues to build, the next significant resistance lies near the 700+ area, which could translate into a 100% gain from current levels — a solid move if the trend structure holds.
Cryptosignals
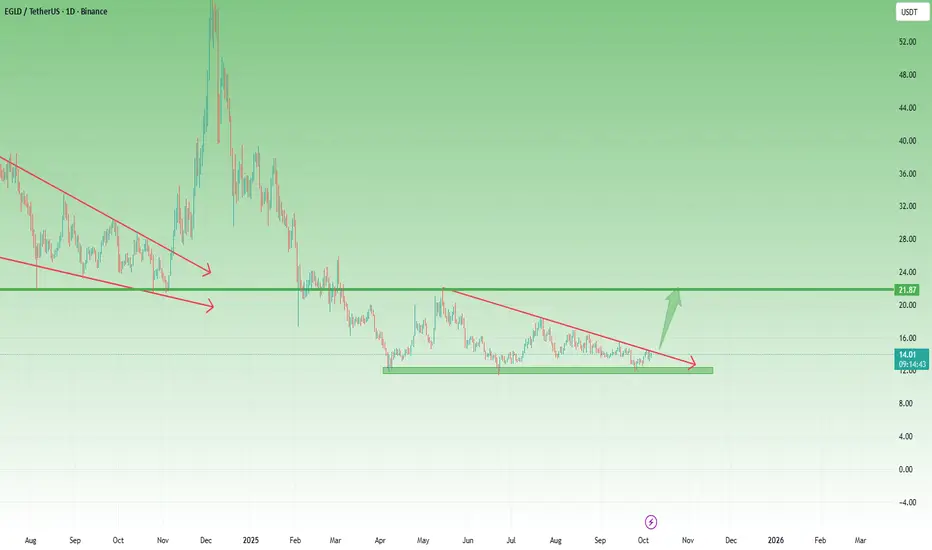
EGLD – Third Touch at $12 Support Could Ignite a Major ReversalEGLD has been on my radar for quite some time...
After forming a major low in April and rallying back toward the $22 zone, the coin pulled back again — effectively confirming that level as strong support.
By the end of September, price revisited the $12 area for the third time, and once again buyers stepped in decisively, triggering a solid rebound. Now, EGLD trades around $14, sitting just below a falling trendline that has capped upside momentum for months.
________________________________________
Technical Outlook
• Support: $12 (triple-tested, major demand zone)
• Resistance: Falling trendline around $14–15
• Soft target: $22 (key resistance and prior reversal area)
________________________________________
My Trading View
Given the strength of this repeated support and the contracting structure, I believe this trendline resistance is likely to break soon. If momentum follows through, EGLD could accelerate sharply to the upside, mirroring past explosive moves.
The setup remains constructive — buying dips above $12 could offer a strong risk–reward opportunity heading into the next leg higher.
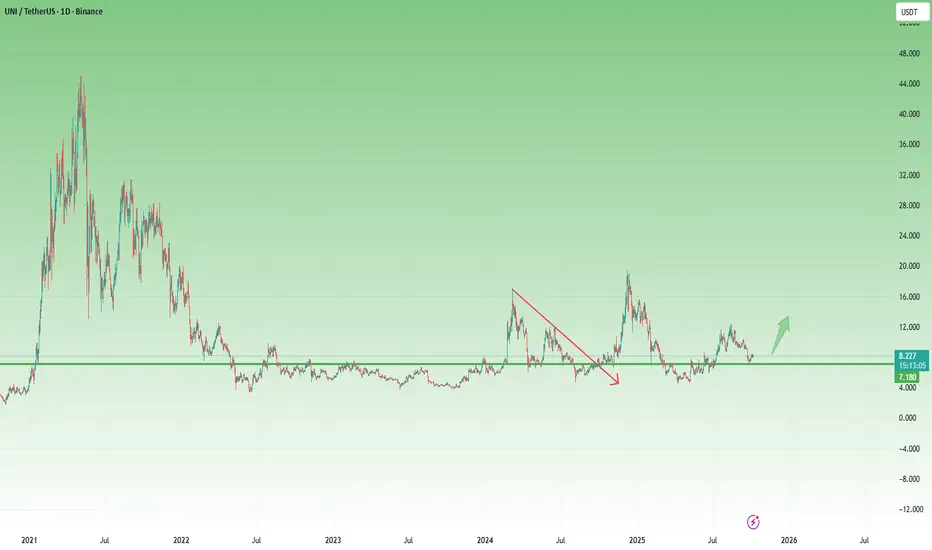
Uniswap Holding above $7 — Bullish Setup AheadAfter the massive 90% drop from its 2021 peak, Uniswap has been consolidating within a wide range. Each attempt to break higher has so far been followed by a return toward the lower end of the structure — a clear sign of prolonged accumulation.
What’s particularly interesting is how the $7 zone has consistently acted as a median level. Every time price dipped below it, UNI found demand and reversed back up. Recently, a solid support base has been confirmed around $5, further strengthening the bullish technical structure.
With the majority of altcoins now positioned for potential upward continuation, Uniswap could also be preparing for a significant leg higher, with a medium-term target around $14 per coin.
However, negation of this bullish setup would come with a clear breakdown below the $7 zone, which could open the way for a retest of the $5 support once again.
From a trading perspective, this setup offers an attractive 1:5 risk-to-reward ratio, making it an opportunity worth keeping on the radar — provided the $7 level holds.
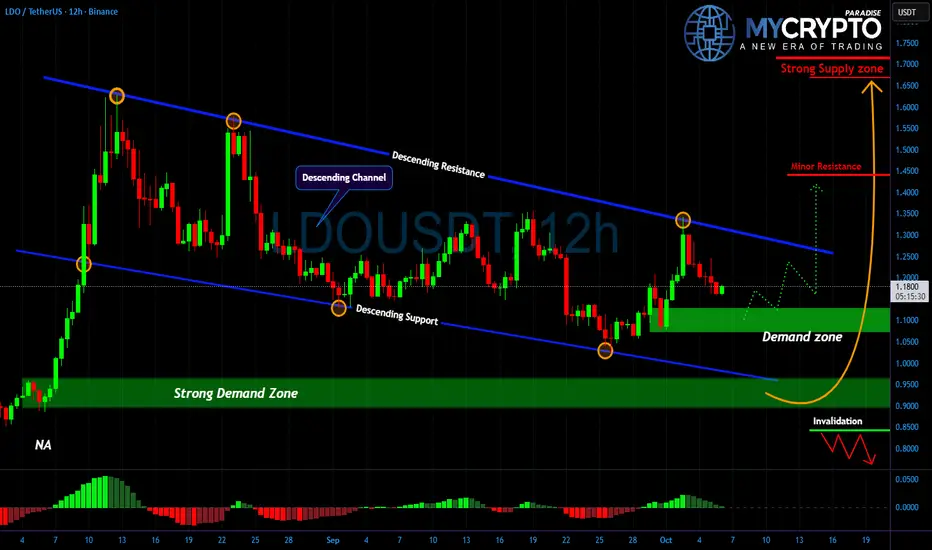
LDO Is Coiling for a Massive Move — But Will It Be Up or Down?
Yello Paradisers, are you ready for what could be one of #LDO’s most explosive reversal plays of Q4? After weeks of tight compression inside a well-defined descending channel, price action is now approaching a make-or-break demand zone and what happens next could define LDO’s direction for the rest of the year.
💎#LDOUSDT has been moving within a steady downward-sloping structure, with each touch of the lower boundary triggering a defensive bounce by buyers. This repeated defense shows that demand is still active at the lows, but the recent rejection from the channel top wasn’t followed by strong continuation. Instead, momentum indicators are flattening out, suggesting that bears may be losing control.
💎Now, price is pressing into a major demand area where high-probability long setups are beginning to form. If bulls step up here and manage to hold the zone while forming a clear higher low, an impulsive move toward the minor resistance near $1.35 could follow and from there, a rally toward the strong supply region between $1.65 and $1.70 becomes a real possibility.
💎However, if this demand zone gives way and we see a sustained breakdown below $0.85, the entire setup would be invalidated. That kind of move would likely trigger another round of selling pressure and take out weak hands who entered prematurely. Until that point, there’s no need to rush. The structure remains intact and the risk-to-reward is highly favorable — but only for those patient enough to wait for confirmation.
The market rewards patience, not emotions. Don’t guess — prepare. The setup is clean, but timing is everything.
MyCryptoParadise
iFeel the success🌴
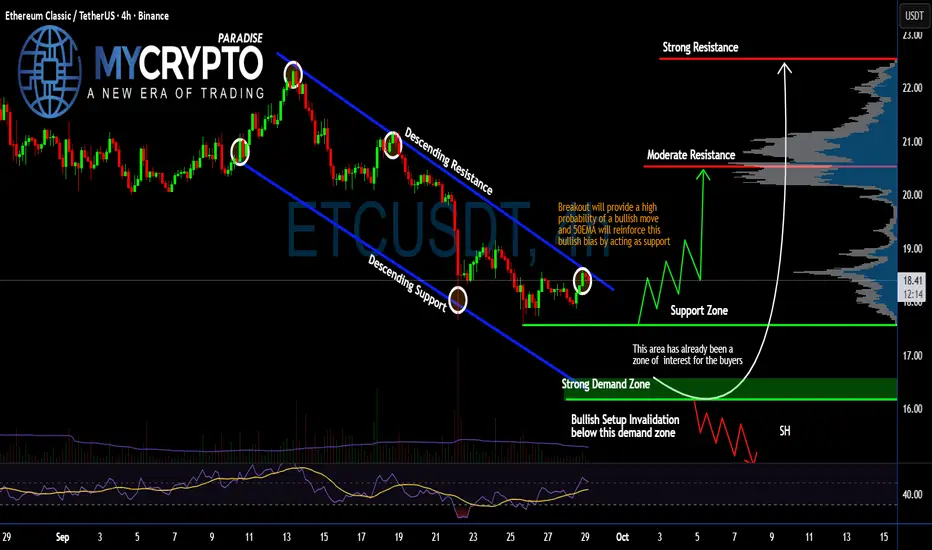
#ETC Bulls Ready For a Pullback or Not? Watch Closely for Trap Yello Paradisers! Are we about to witness #EthereumClassic finally escape this downtrend channel, or another trap lies ahead? Let's break down the #ETC setup before the trap springs:
💎#ETCUSDT has been grinding inside a clear descending channel in the 4-hour timeframe and bouncing consistently between its descending resistance and support. Price is now pushing right against the top of this channel, and this pressure is building. Any clean breakout from here will be a strong bullish signal, especially with the 50EMA lining up perfectly to act as dynamic support if the move confirms.
💎The current support zone around $17.58 has already shown buyer interest recently. A bounce from here and a breakout above the descending resistance would trigger upside momentum, with the first key test being the moderate resistance at $20.54.
💎Once #ETCUSD breaks that, we’re eyeing the final strong resistance around $22.54 — a level where smart money is likely preparing to take profits. You need to watch the volume to confirm the breakout and retest constantly.
💎However, a failure to break out, or worse, a breakdown below the strong demand zone at $16.17, would completely invalidate the bullish scenario. This area is the last line of defense. If it collapses, the next leg down could accelerate fast, triggering a deeper correction and taking out over-leveraged long positions in the process.
Strive for consistency, wait for clear confirmations, and remember that discipline always beats chasing quick profits.
MyCryptoParadise
iFeel the success🌴
DOGE Swing Long Idea - TRKZ ModelDOGE Swing Long Idea w TRKZ Model
📊 Market Sentiment
FED has resumed its rate-cutting cycle, starting with a 0.25% cut in September, with two more 0.25% cuts expected in the coming months. Additionally, institutional liquidity inflows have accelerated as the U.S. officially adopts crypto as part of its reserves. While inflation remains elevated, the weakening labor market is forcing the FED to ease, driving more capital into risk-on assets.
📈 Technical Analysis
Price broke the bearish trendline that had been responsible for the bearish trend since December 2024 and closed above, indicating that price will seek higher levels.
Price also broke the HTF Key Level aggressively and closed above. I expect this level to hold and push us higher.
📘 Model to be used – Broken Trendline Retest supported by HTF Key Zone Retest (TRKZ)
In this model, we need to see a HTF trendline broken aggressively with a close above on HTF. Then, we check for a broken HTF Key Zone (Supply–Demand–Support–Resistance) aligned with the trendline break. Finally, we look to enter after the retest of both the broken trendline and the broken Key Zone.
📌 Game Plan
Carry the position toward the December 2024 high at 0.48$ as a mid–long term swing position. Trail the stoploss after taking first TP, move entry to breakeven, and manage forward.
🎯 Setup Trigger
Setup is valid after retesting the broken trendline and HTF Key Level.
📋 Trade Management
Stoploss: 0.18254$
Targets: TP1: 0.308$ | TP2: 0.4344$ | TP3: 0.4842$
Once TP1 is hit, stoploss will be moved to breakeven to secure profits.
💬 Like, follow, and comment if this breakdown supports your trading! More setups and market insights coming soon — stay connected!
⚠️ Disclaimer: This content is for informational and educational purposes only and does not constitute financial, investment, or trading advice. Always DYOR before making any financial decisions.

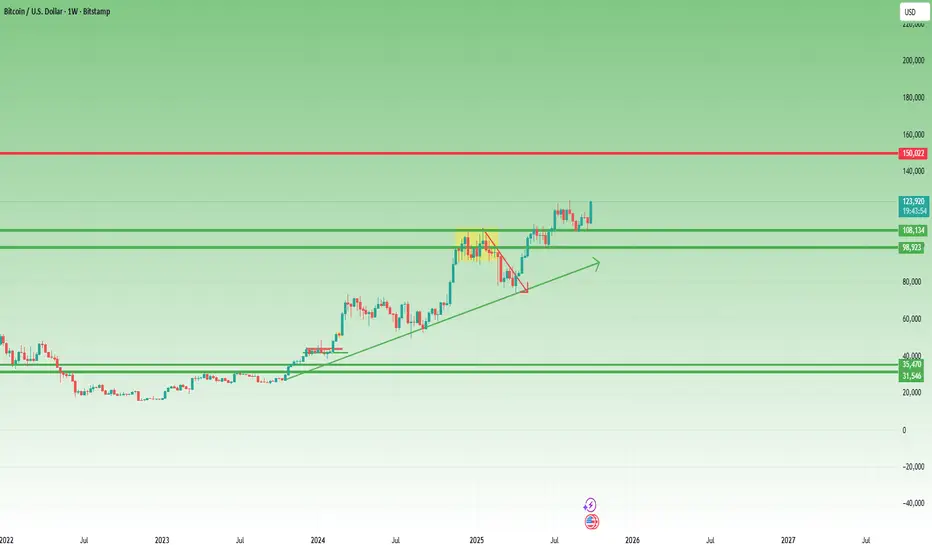
BTC Bulls in Control: 140K–150K Next?In my previous BTC analysis, I mentioned that 125K was the next target and that as long as 112K remains intact, bulls have nothing to worry about.
Since then, the price continued its ascent and is now flirting with the all-time high.
________________________________________
1️⃣ Is BTC Going to Make a New ATH?
From my point of view, it’s no longer a question of if , but how high it can go.
The trend is strong, momentum is building, and technically, we’re entering uncharted territory.
________________________________________
2️⃣ T echnical Context
After nearly three months of consolidation, clearly visible on the weekly chart, the breakout above the rectangle pattern gives us a measured target around 140K.
That’s the logical projection based on structure and continuation strength.
________________________________________
3️⃣ Can BTC Reach 150K?
Absolutely possible.
That’s only about a 20% move from current levels, and for Bitcoin, such moves are almost routine.
As long as 112K support holds, bulls remain fully in control.
________________________________________
Conclusion:
BTC seems ready to explore new highs.
Now the only question is — how far can this go? 🚀
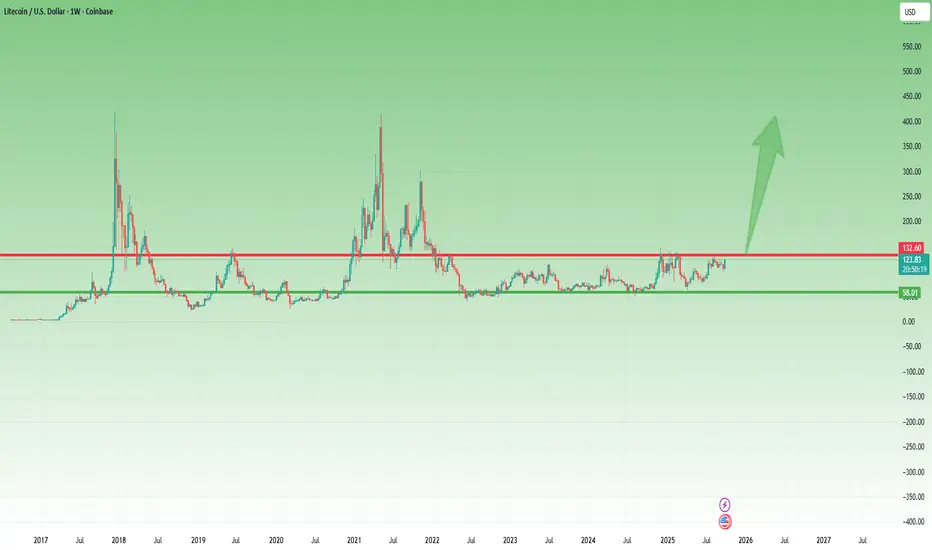
Litecoin Ready to Explode After 3 Years of SleepIn recent years, with the flood of new crypto projects, Litecoin has quietly faded into the background.
Since the local low in May 2022, the price action has been rather lethargic, contained within a well-defined range between 60 and 130 USD.
However, since April 2025, something interesting has been happening — Litecoin seems to be waking up, quietly and almost secretly, as if not to attract too much attention.
From that point onward, LTC/USD has been steadily printing higher lows, and if we zoom out to the longer-term chart, the structure looks remarkably clean — almost textbook — for a potential breakout setup.
Even recently, after another touch of the resistance zone, the correction that followed took the form of a bullish flag, and last week’s strong engulfing candle practically erased an entire month of pullback, now pressing once again against the key resistance level.
In my opinion, it’s time for this cryptocurrency to wake up.
A clear break above 130 would be a strong technical confirmation of that view.
While Litecoin might not deliver the “10x hype” potential that newer tokens promise, it has consistently proven to be one of the most stable and resilient assets in the crypto space.
After three years of accumulation, a breakout could easily trigger an explosive move to the upside.
📈 I’m personally buying Litecoin, with a target around 300 USD in the medium term.
Sometimes, the coins everyone forgets about are the ones that surprise the most. 🚀
DOGE Breakdown Could Trigger a Major Dump Yello, Paradisers! Have you noticed what just happened with DOGE? The recent price action is sending a clear warning that downside risk is increasing — and fast. Several technical signals are aligning, and ignoring them here could be costly.
💎DOGEUSDT has broken down from its ascending channel structure — a clear shift in trend. More importantly, we’re seeing bearish divergence on both MACD and RSI, confirming that momentum is weakening despite recent price attempts to push higher. When these signals appear together, it often precedes a sharp reversal.
💎Adding to the bearish bias, the price has just formed a double top pattern — and not just anywhere, but exactly at a previous support level that has now turned into resistance. This type of confluence makes the setup even more reliable for a potential move to the downside.
💎From the current levels, the risk-to-reward ratio is already attractive for short positions. However, considering the broader bullish tone of the overall crypto market, it may be wise to size positions conservatively here. Traders who prefer more confirmation might wait for a clean retest of the resistance zone, where a bearish candlestick pattern would provide a higher-conviction entry point.
💎If, however, price breaks back above the resistance zone and closes firmly above the invalidation level, the bearish setup becomes invalid. In that case, it's best to step aside and wait for fresh signals or clearer market structure before acting again.
🎖But it never is, and never will be a free ride. Make sure you play it smart, Paradisers; the next 6–9 months will be juicy for some and painful for others. Discipline, patience, robust strategies, and trading tactics are the only ways you can make it long-term in this market.
MyCryptoParadise
iFeel the success🌴

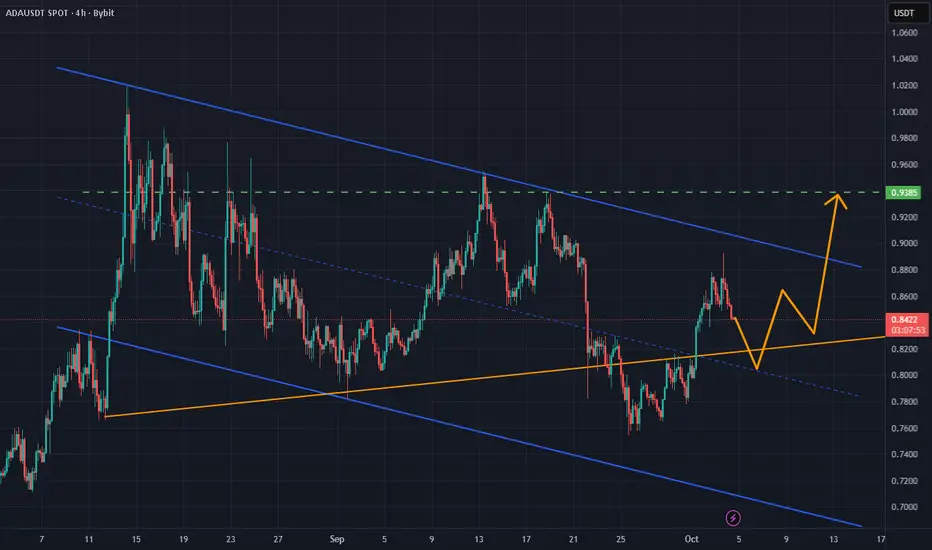
ADA/USDT: Holding Trendline Support with Breakout Setup FormingADA/USDT is holding above the 0.8135 upward trendline following a pullback from resistance, signaling early signs of stabilization. The current structure shows lower highs capped by a red descending trendline, while projection points suggest a potential breakout toward the 0.9385 level.
As long as the 0.8135 support remains intact, the bullish outlook stays in play, favoring continuation toward 0.9385, with momentum building for a possible challenge of the 1.0212 resistance zone. Buyers appear to be gradually regaining control.
ICP: False Break, Bullish Reversal in PlaySince the low from early April, ICP has traded within a well-defined range between $4.5 and $6.0.
Recently, the price broke below the range support, reaching as low as $4.0, but this move lacked follow-through. Instead, ICP quickly rebounded — a classic false break signal.
This rebound also resulted in a break above the descending trendline that started in mid-August, giving the chart a decisively bullish tone.
At this stage, all signals point toward further upside continuation, with the upper boundary near $6.0 as the first natural target.
However, considering that false breaks in one direction often lead to real breaks in the opposite, there’s a strong possibility that ICP could break above $6.0 in the medium term, potentially accelerating toward the key $10.0 zone.
________________________________________
✅ Key Takeaways:
• Range: $4.5 – $6.0
• False break below $4.0 reversed quickly
• Trendline from August broken to the upside
• Bullish outlook → targets $6.0 and possibly $10.0

TON/USDT: Bearish Bias Holds Below Key Resistance in Downward ChTON/USDT continues to trade within a well-defined downward channel, consistently forming lower highs and maintaining bearish pressure. Following a sharp decline from the consolidation zone, the recent rebound is now encountering resistance near 2.85, a level where sellers may reassert control.
As long as price remains below the 3.00 psychological level and the descending trendline, the bearish bias stays intact. A rejection from current levels could lead to a move toward the 2.62 support, with further downside possible into the buying area below 2.55.

ETH/USDT | ETH Weekly Setup – Strong Demand Pushes Toward $6K!By analyzing the Ethereum chart on the weekly timeframe, we can see that after entering the $3,800 demand zone, ETH gained strong buying pressure and reached the $4,200 and $4,600 targets.
Currently, Ethereum is trading around $4,500, up about 19%, and I expect further bullish movement soon. The next upside targets are $4,950, $5,500, and $6,000.
THE LATEST TA :
Please support me with your likes and comments to motivate me to share more analysis with you and share your opinion about the possible trend of this chart with me !
Best Regards , Arman Shaban

NOTCOIN; BUY SIGNALHello friends
Given that the price has reached the specified support and the price is supported by buyers and the specified resistance has been broken, we can buy in steps with risk and capital management and move to the specified targets.
*Trade safely with us*

BTC/USDT | BTC Rally +7% Gains – Bulls Still in Control (READ)By analyzing the Bitcoin chart on the 4-hour timeframe, we can see that the price continued its rally as expected, hitting the $115K target and now reaching up to $117,200, just one step away from the next target at $118K. So far, this analysis has delivered more than 7% gains. I hope you made the most out of it!
Please support me with your likes and comments to motivate me to share more analysis with you and share your opinion about the possible trend of this chart with me !
Best Regards , Arman Shaban
BITCOIN (BTCUSD): Road to ATH
Bitcoin violated a major resistance cluster and closed above that
on a daily time frame, yesterday.
The next strong resistance is based on a current all-time high.
123200 level will be the next goal for the buyers after a pullback.
❤️Please, support my work with like, thank you!❤️
I am part of Trade Nation's Influencer program and receive a monthly fee for using their TradingView charts in my analysis.

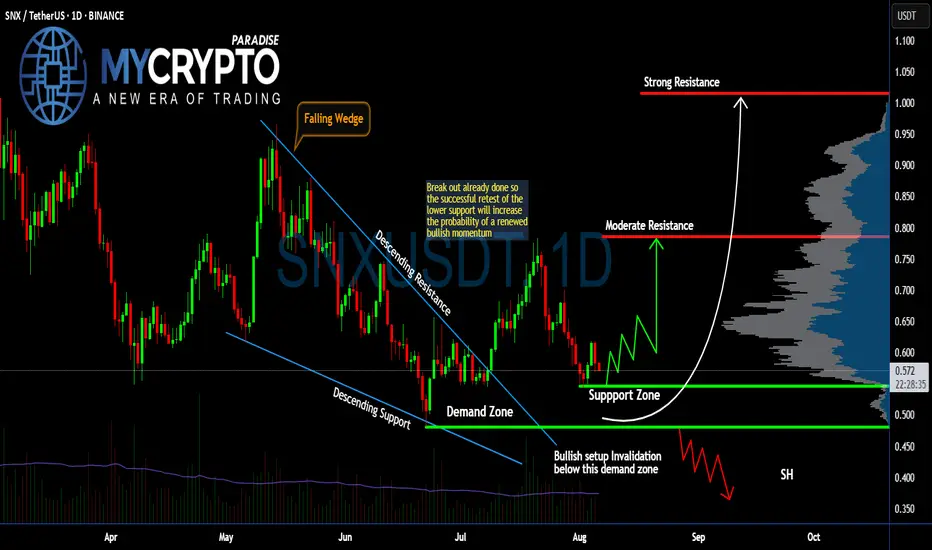
Can #SNX Bulls Sustain the Current Momentum? Watch it CloselyYello, Paradisers! Is this #SNX setup just another fakeout in disguise, or is the market quietly setting up for a major bullish momentum shift? Let’s dissect what’s really happening on #SNXUSDT:
💎After moving through a falling wedge pattern for months, #Synthetix has already broken out above the descending resistance, signaling an early shift in trend. However, the real move hasn’t yet begun—a proper retest of the support zone between $0.50–$0.54 is what we’re watching for now.
💎This support zone aligns with the prior wedge breakout and also overlaps with a visible demand area, making it a key region where buyers could step in again. If bulls defend this area successfully, we expect a renewed rally toward the moderate resistance level at $0.78.
💎From there, the next upside target lies at the strong resistance around $1.01—a level with heavy volume profile resistance and previous seller activity. But that level will only come into play if the bulls reclaim momentum with conviction.
💎On the flip side, if #SNXUSD breaks below $0.48, which is our bullish invalidation level, the setup collapses and opens the door for a deeper drop toward the $0.40–$0.35 zone, where short-sellers are likely to pile in.
Stay patient, Paradisers. Let the breakout confirm, and only then do we strike with conviction.
MyCryptoParadise
iFeel the success🌴
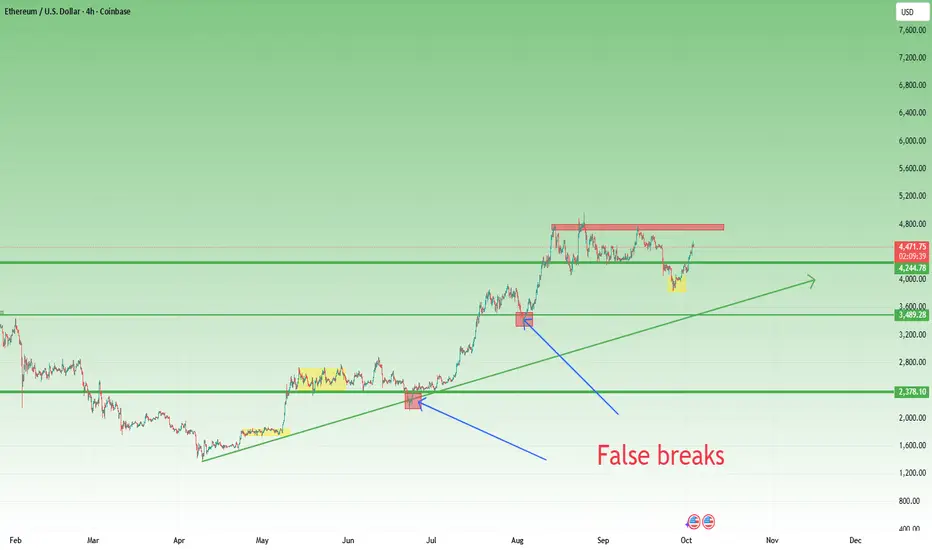
Ethereum: Bulls in Control, But Time for a BreatherIn my previous ETH analysis, I pointed out the high probability of a false breakdown under the 4100 technical support and the 4000 psychological level.
The reasoning was simple: during the strong bull leg from 1350 to 4900 (since April), ETH had already shown this type of price action twice.
That call proved correct. ETH reversed higher, hit my 4400 target, and even pushed further, printing highs close to 4600.
Now, after a nearly 15% rise since last Friday, the market may be due for a pause — a chance to consolidate or correct part of the gains.
________________________________________
Technical View
• Support: 4300 is the key level. As long as this holds, bulls remain in control.
• Resistance: Immediate pressure sits near 4600, the recent top.
• Structure: The trend remains strong and healthy, but after such a rapid move, short-term cooling is normal.
________________________________________
Trading Plan
The strategy remains simple: buy dips against 4300.
As long as that support is intact, ETH’s bull case stays firmly alive. 🚀
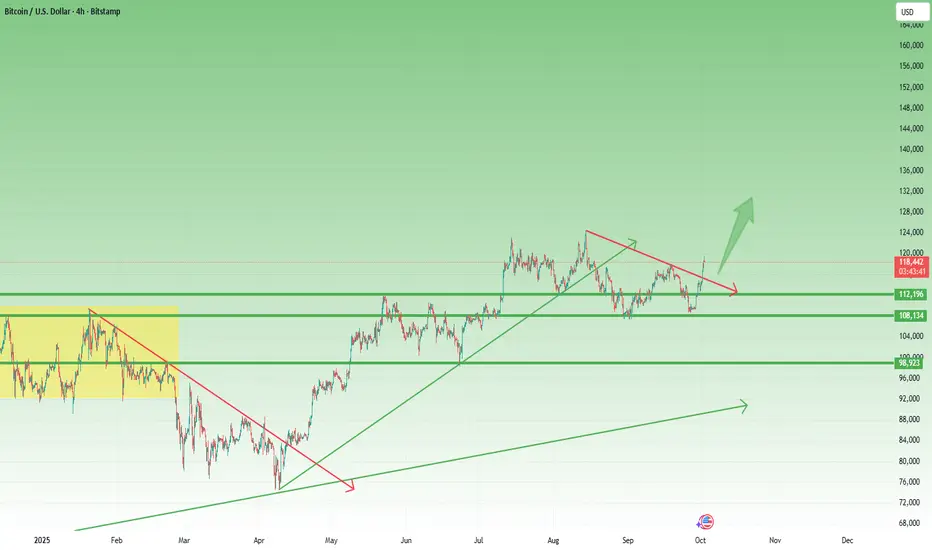
Bitcoin: Third Time’s a Charm at 120k?Two days ago, in my last BTC analysis, I mentioned that bulls had to defend 112k at all costs. Losing it would have opened the gates toward 100k.
Fortunately for the bullish camp, the defense worked. Bitcoin didn’t just hold the line—it pushed higher and broke through the 115k resistance, which had been reinforced by a falling trendline.
Now, with price trading around 118,600, the market is once again staring at the critical 120k barrier.
________________________________________
Why 120k Is So Important
• BTC has already tested this level twice this year, only to be rejected both times.
• Each failure sparked corrections, making 120k not just a number but a milestone for sentiment and structure.
• If bulls can finally conquer and hold above it, the door to new all-time highs swings open.
________________________________________
Technical Structure
• 108k: A solid support.
• 112k: The battleground of the past few months—resistance, support, resistance, etc is now reconquered.
• Trendline Break: The falling trendline gave way, giving bulls the momentum they needed.
The chart is building constructively, with strong supports.
________________________________________
Third Time’s a Charm?
Markets don’t often give three chances at the same key level. The third test usually decides the story.
My stance: buy dips. As long as 112k remains intact, I expect BTC to break 120k and head toward a new ATH.
So, will 120k finally fall on the third attempt? My conviction is stronger than before. 🚀
Rare Sell Opportunity on Bitcoin , target 114KBitcoin is currently approaching the 124,000 – 124,500 zone, which represents its all-time high and the strongest resistance level the market has ever seen.
From a technical perspective, this zone provides a golden and rare opportunity to enter a short trade, based on the following:
Price reaching an unprecedented all-time high.
Clear overbought signals on momentum indicators (RSI – MACD).
High probability of a significant profit-taking move from these levels.
🎯 Trading Plan:
Short entry: 124,000 – 124,500
Main target: 114,000
Stop-loss: Above 125,000
⚠️ This is not financial advice, but rather a personal technical analysis based on current market conditions.

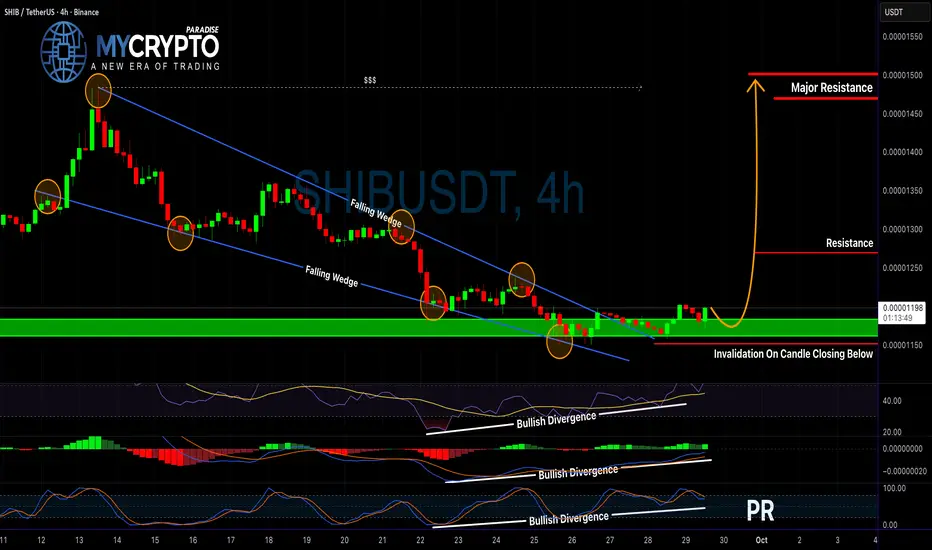
Is SHIB About to Explode or Collapse? Read Before It’s Too LateYello Paradisers! Are you paying attention to SHIB right now? Because this could either be the start of a massive bullish breakout — or the trap that wipes out impatient traders.
💎SHIBUSDT is showing strong potential after breaking out of a falling wedge pattern, which is a classic bullish reversal setup. What makes this move even more convincing is the presence of bullish divergence on the RSI, MACD, and Stochastic RSI — all of which are aligning to support a potential move to the upside.
💎From the current price level, after a proper retest of the support, the setup is still offering a favorable 1:2 risk-to-reward ratio, which is solid for short-term traders.
💎If you’re aiming for even larger risk-to-reward opportunities, you could wait for a more defined retest to enter with tighter risk parameters. However, this comes with the risk of missing the move entirely if the market doesn’t offer that second chance.
💎But here's the key — if the price breaks down and closes below the invalidation level, this entire bullish idea becomes invalid. In that case, it’s much smarter to step back and wait for cleaner price action and a higher-probability setup to form.
💎Discipline always beats impatience.
🎖Strive for consistency, not quick profits. Treat the market as a businessman, not as a gambler. That’s the only way to make it far in your crypto trading journey. Be a PRO.
MyCryptoParadise
iFeel the success🌴
BTC Game Plan – (LDMD Model)BTC Game Plan – (LDMD Model)
📊 Market Sentiment
FED has resumed its rate-cutting cycle, starting with a 0.25% cut in September, with two more expected. Institutional liquidity inflows have accelerated as the U.S. officially adopts crypto as part of its reserves. Despite elevated inflation, a weakening labor market is forcing the FED to ease, pushing more capital into risk-on assets.
📈 Technical Analysis
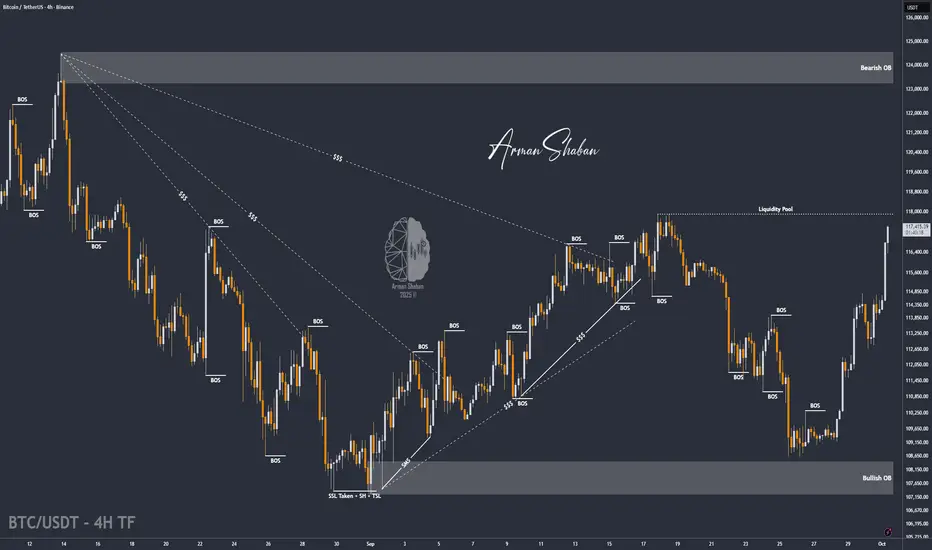
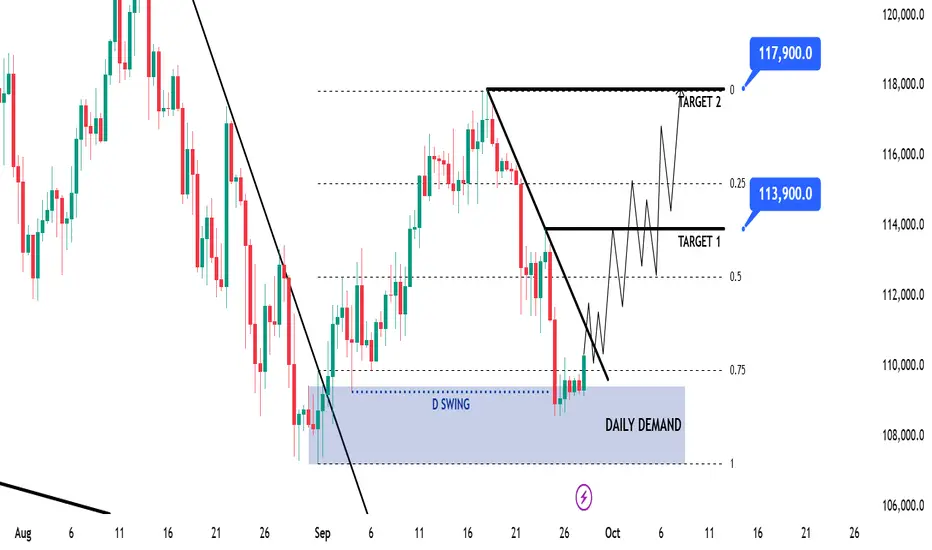
BTC is trending strongly bullish on the HTF, so long setups remain the priority. Recently, price broke the bearish trendline that had capped price action since August 13, signaling a shift in momentum. That breakout created a Daily Demand zone, which was tapped once before price moved higher — confirming liquidity inside the zone.
Currently, BTC ran the daily swing low (the first tap of that demand), revisited the Daily Demand, and repriced into the 0.75 Fibonacci max discount level. This strong confluence suggests accumulation and potential continuation higher.
📘 Model to be used – LDMD (Liquidity Run inside Daily Demand w/ Max Discount Zone)
In this model, I start by confirming the HTF trend to set directional bias. Then, I identify key Demand/Supply zones that carry significant liquidity. A sweep of HTF swing lows adds confluence by trapping liquidity. Finally, I align this with the 0.75 max discount retracement zone for a high-probability entry point.
📌 Game Plan
1-Wait for a daily close above the bearish trendline.
2-Enter long on confirmation.
🎯 Setup Trigger
Daily close above the bearish trendline.
📋 Trade Management
Stoploss: 108,500$
Targets:
TP1: 113,900$
TP2: 117,900$
After TP1, move SL to breakeven to secure profits.
💬 Like, follow, and comment if this breakdown supports your trading! More setups and insights coming soon — stay connected!
⚠️ Disclaimer: This content is for informational and educational purposes only and does not constitute financial, investment, or trading advice. Always DYOR before making any financial decisions.
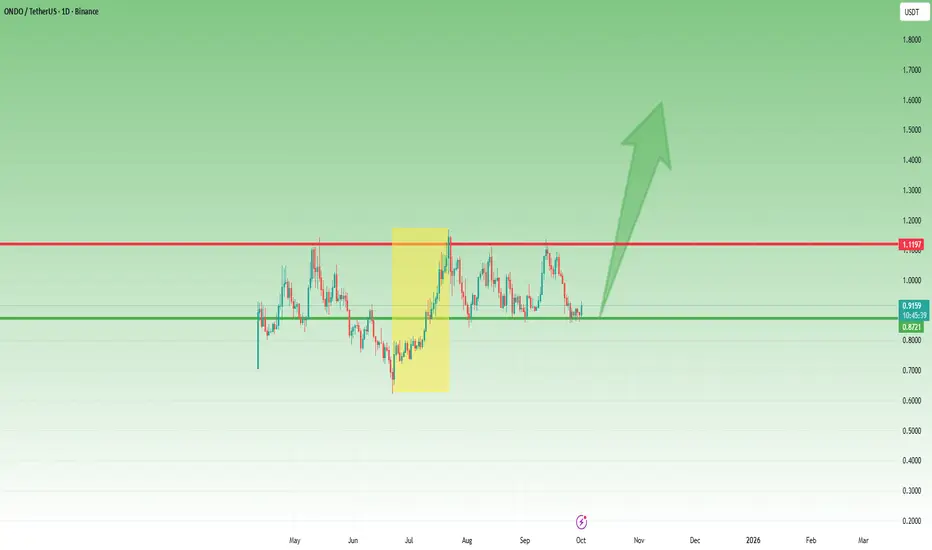
ONDO – Bullish Reversal from SupportWhat happened:
After the low back in June at 0.62, ONDO delivered a 100% rally. As expected after such a move, the price corrected and then settled into a range.
Key question:
Is this strong bounce from support the beginning of the next leg up?
Why I’m bullish:
• The recent reversal from support shows buyers are defending the structure.
• The first leg up measured a clean 100% move, and the current setup mirrors that strength.
• By extension, a second leg of similar length could take ONDO above 1.50.
Trading plan:
• I remain bullish as long as 0.80 holds.
• A continuation from here would confirm that the range is resolved to the upside, opening the path to 1.50+.
Bottom line:
ONDO combines strong fundamentals in tokenized real assets with a healthy technical picture. Support is clear and the potential reward above 1.50 is on the table. 🚀