XRP/USD LONG SET UP TRADETitle: XRP/USD (RIPPLE) BUY
Asset: Crypto
Symbol: XRP/USD
Market Entry Price 1: $2.19
Stop Loss: $2.14
Take Profit 1: $2.24
Take Profit 2: $2.28 (close 25 %)
Take Profit 3: $2.34 (close 50%)
Take profit 4: $2.45
Status: ACTIVE
Cryptotrade

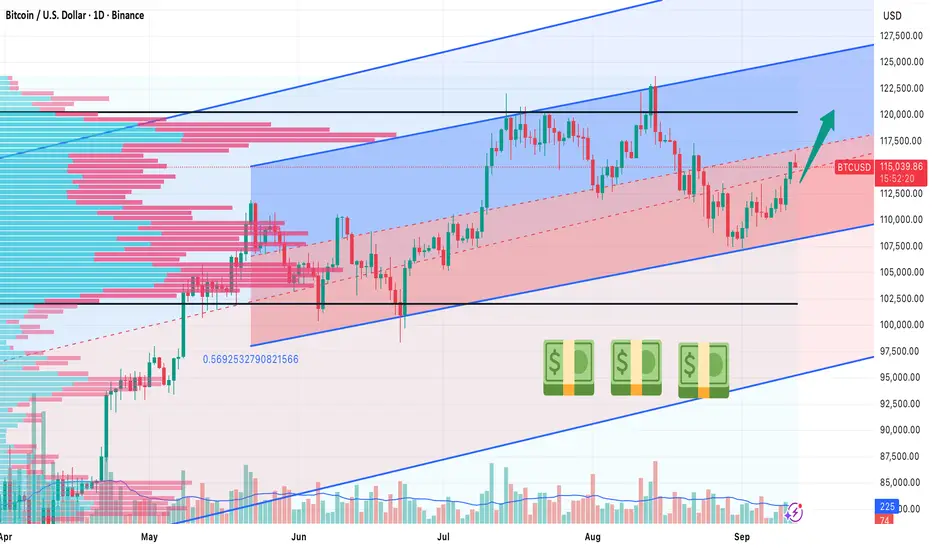
BTC/USD Near the Median of Weekly and Daily Regression TrendsHow to Approach the Setup
Long‑term bias: bullish (weekly regression channel slopes upward, daily channel is flat‑to‑slightly bullish).
Typical trader mindset: wait for an upward breakout with strong volume or place a buy‑limit order around the round‑number level of 115,000 USD and aim for an initial target near 120,000 USD (+4%).
Price action and technical context
BTC is currently trading close to the median line of two overlapping regression‑trend channels:
Weekly Timeframe: Channel slope Upward - Interpretation : Long‑term bullish pressure
Daily Timeframe: Channel slope Flat‑to‑slightly up - Interpretation : Short‑term equilibrium, slight upside bias.
The price sits in a narrow corridor bounded by the upper and lower regression lines. Because the weekly channel is tilted upward, the overall market structure still favors higher highs. The daily channel’s flatness suggests that any move will need a catalyst—typically a surge in buying volume or a breakout above the weekly upper trend line.
Key technical reference points
Upper daily regression line: ~125,000 USD – the first resistance level that, if breached with volume, could trigger a sustained rally.
Median (current price area): ~117,000 USD – a psychologically clean round number that also aligns with the median of both channels.
Lower daily regression line: ~108,000 USD – a safety net; a break below would invalidate the bullish bias.
Trade‑the‑setup options
1. Wait for a breakout – Enter the trade when the price closes above the weekly upper regression line and the accompanying volume is at least 1.5 times the 20‑day average. This condition confirms that the bullish bias is actually materialising and helps avoid false “whipsaw” moves. In practice, traders use a market order or place an aggressive limit order just above the breakout level (around 118,600 USD).
2. Buy‑limit at 115,000 – Set a limit order at the round‑number median of 115,000 USD. The round number acts as a natural “magnet,” and because the price is already near the median, this approach works well in a range‑bound market. The typical execution is a limit order at 115,000 USD with an initial profit target of 120,000 USD, representing roughly a +4 % gain.
Both methods assume the trader will monitor volume and short‑term momentum (RSI, MACD) to confirm that the move is not a temporary spike.
Momentum and volume cues
RSI(14): Values climbing above 55 support the bullish bias; a dip below 45 warns of potential reversal.
MACD: A bullish crossover (MACD line crossing above the signal line) on the daily chart adds confidence to a breakout or limit‑order fill.
Volume: A surge to at least 150 % of the 20‑day average on the day of the breakout dramatically raises the probability of a sustained move.
Risk considerations
Stop placement: If the price falls below the lower weekly regression line (≈111,000 USD) or breaches the median downward with a sharp volume spike, exit the position.
Position sizing: Because BTC’s volatility can be extreme, allocate a modest percentage of the portfolio (e.g., 2‑3 % of equity) to this speculative play.
Alternative defined‑risk structures: Traders uncomfortable with outright exposure can use a debit call spread (e.g., buy the 115,000 USD call, sell the 120,000 USD call) to cap downside while preserving upside to the first target.
Bottom line
When BTC/USD hovers near the median of a bullish weekly regression channel and a flat‑to‑slightly bullish daily channel, the market is in a neutral‑to‑bullish equilibrium. The prudent approach is either:
Patience: Wait for a volume‑driven breakout above the weekly upper trend line, or
Precision: Place a buy‑limit order at the clean 115,000 USD level and target the first upside milestone at 120,000 USD (+4%).
Both strategies rely on confirming momentum and volume before committing capital, while keeping a tight stop below the lower weekly regression line to protect against a sudden reversal.
BITCOIN (BTCUSD): Bullish Wave is Coming?!
Quick update for Bitcoin.
Earlier, I already warned about a potential bullish accumulation
after a test of a demand zone.
The price is now testing an important supply cluster and we may
see a breakout of that today.
In case of a daily candle close above 113600, a bullish reversal
will be confirmed, and we will expect a growth at least to 116800.
❤️Please, support my work with like, thank you!❤️
I am part of Trade Nation's Influencer program and receive a monthly fee for using their TradingView charts in my analysis.

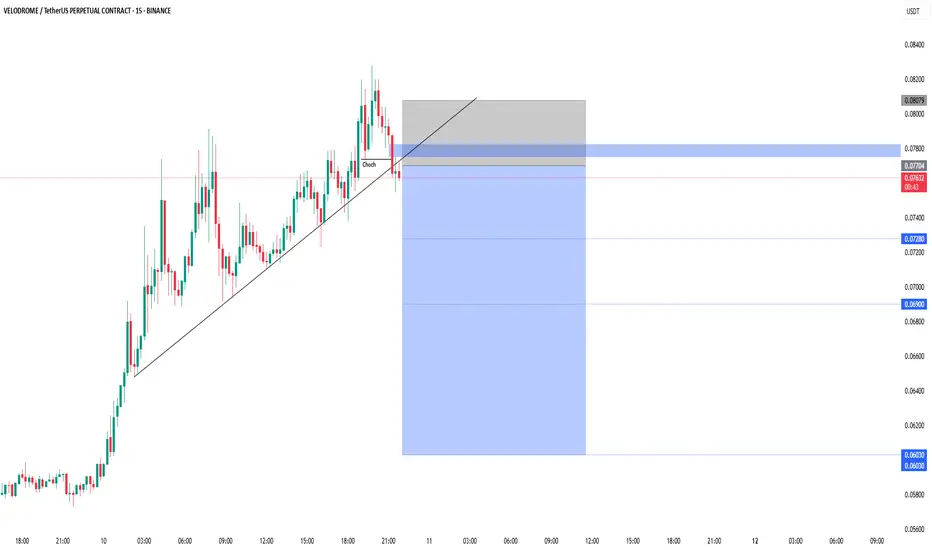
VELODROME/USDT — Trendline Break, Down is coming??Price has broken the ascending trendline and formed a clear Change of Character (ChoCh) to the downside.
This retest offers a potential short opportunity if rejection confirms from this zone.
Entry: Around 0.0770–0.0780
Stoploss: Above 0.0807
Target Levels:
• TP1: 0.0728
• TP2: 0.0690
• TP3: 0.0630
A break below 0.0728 could accelerate momentum to the downside. Waiting for price action confirmation is recommended before entry.
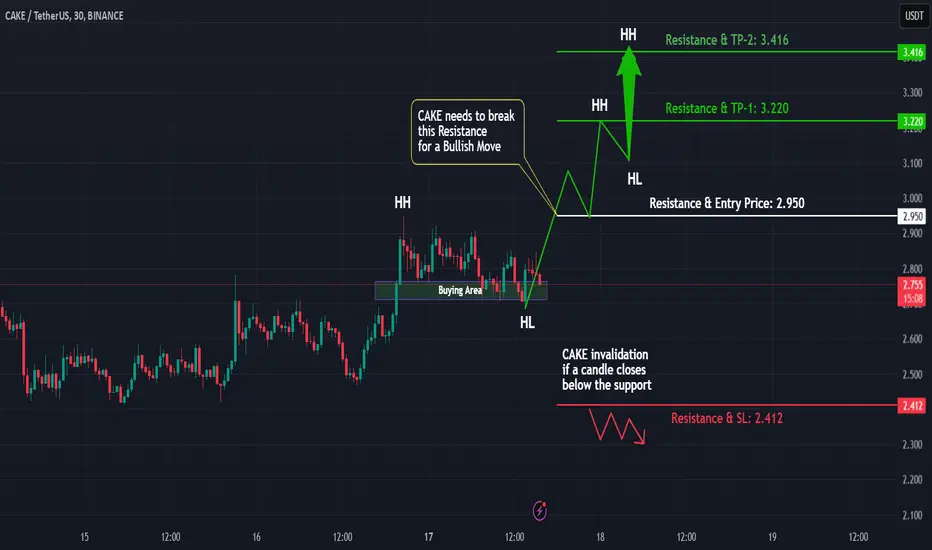
#Cake Ready for a Big Move? Bullish Breakout Incoming!🔹 Market Structure & Trend
#Cake is currently in a strong uptrend, forming higher highs (HHs) and higher lows (HLs). This is a classic sign of bullish momentum.
🔹 Key Breakout Zone
We are watching the resistance level: 2.950, which aligns with previous HHs. A breakout above this level could trigger another strong rally.
🔹 Trade Plan & Entry Strategy
Breakout Entry: Above 2.950 with confirmation
Stop Loss: Below recent HL for proper risk management
Targets: First TP at 3.220, extended TP at 3.416
🔹 Indicators & Confirmation
RSI: Above 50, indicating bullish strength
Volume: Increasing, signaling strong participation
Moving Averages: Aligning for an uptrend
What’s Your Take?
Do you think #Cake will break out or face resistance? Drop your analysis in the comments!
#ZEC–Bullish Reversal in Play? | Harmonic Pattern and DivergenceDowntrend Reversal in Sight?
#ZEC has been in a consistent downtrend and is currently at its lowest point. But the charts are telling a different story now.
Key Technical Highlights:
Harmonic Pattern: A clear Bullish Bat pattern has formed on the 1-day timeframe, signaling potential for reversal.
Bullish Divergence: We’re seeing a subtle bullish divergence, adding weight to the case for a potential trend reversal.
Resistance Break: The key confirmation level lies at 45.85. A break above this level will be our primary signal to go long.
What Does This Mean?
The technical indicators are aligning for a potential upward shift, but patience is key. We’ll need to wait for the resistance to break before entering the trade.
Once confirmed, we’ll be looking for a bullish entry at 45.85 with careful risk management in place.
Join the Discussion!
What’s your take on #ZEC? Are you seeing the same potential reversal, or is it too early to call?
Have you traded harmonic patterns before? Share your experiences below!

MOG Long Spot Opportunity Market Context:
MOG has retraced significantly from its all-time high but continues to maintain an upward trend—a rarity among meme coins. Price is approaching a critical support zone, presenting a strong risk-to-reward opportunity for a long trade.
Trade Details:
Entry Zone: $0.0000012
Take Profit Targets:
$0.0000025
$0.0000030
$0.0000035
Stop Loss: Daily close below $0.0000010
This setup provides an excellent opportunity to capitalize on a potential higher low formation as MOG attempts to reclaim support. Manage risk carefully! 📈

Potential Short Opportunity for BTC/USD at $61,000Overview:
In this analysis, I present a short trade setup for BTC/USD with an entry point around $61,000. This idea is based on the confluence of volume profile levels and Fibonacci retracement zones.
Volume Profile Analysis:
The volume profile indicates significant trading activity around the $61,000 level, which suggests it as a strong resistance zone. This implies that there may be considerable selling pressure once the price reaches this level.
Fibonacci Retracement:
Applying the Fibonacci retracement from the swing high to the recent swing low, the 0.618 retracement level aligns closely with the $61,000 mark. This confluence adds strength to the resistance at this level, providing a high-probability short entry.
RSI and ADX Indicators:
The Relative Strength Index (RSI) is currently showing bearish divergence, indicating a potential reversal or pullback.
The Average Directional Index (ADX) is at a high level, suggesting a strong trend which could soon see a correction.
Trade Setup:
Entry : Short at $61,000
Stop Loss : Above the $62,500 level to allow some room for potential volatility.
Target : First target at $56,000 (next significant volume node), second target at $50,000 (support zone and 1.618 Fibonacci extension).
Conclusion:
This trade setup leverages technical analysis tools to identify a high-probability short entry point. As always, ensure proper risk management and adjust the trade parameters based on market conditions.

🟣⚙️ DOT Trade Analysis ⚙️🟣📉 Market Outlook:
Polkadot (DOT) has reached a significant support level after consolidating for approximately five days.
This presents a potential low-risk opportunity to initiate a long position.
🎯 Trade Plan:
Entry Range: Consider entering the trade between $6.00 and $6.50, aligning with the current major support.
Profit Targets: Aim for profits at $8.00 - $8.50 or $9.50 - $10.00 resistance levels.
Stop Loss: Implement a stop-loss just below $5.70 to manage downside risk.
📈 Trading Strategy:
Entry: Initiate a long position within the specified range.
Targets: Take profits at identified resistance levels.
Risk Management: Utilize the specified stop-loss to mitigate potential losses.
🚨 Note: Stay attentive to market movements and adjust your strategy accordingly! #DOT #TradingAnalysis #CryptoTrade 🌐📊

BTCUSD Breakout TradeBTCUSUD wait for breakout and trade in the direction of breakout or place your but and sell stop.
Manage your risk according to account size!


ID Usdt Falling Wedge Natural BullishID Usdt 15 Min Chart Falling Wedge Natural Bullish Pattern.
Target 0.50

ETH Daily TA Neutral BullishETHUSD daily guidance is neutral with a *bullshit* bias. Recommended ratio: 60% ETH, 40% Cash.
* SUNDAY SCARIES WATCH . Russia has been notifying all Russian citizens in Kherson (Ukraine) to evacuate immediately due to the threat of impending "terrorist attacks" by Ukrainians . A few weeks ago, Putin announced that Russia officially recognizes Kherson and three other territories in Ukraine as annexed territories of Russia. This is yet another example of Russian war engineering to justify a continued and intentional escalation of the types of attacks they launch on Ukraine. The Chinese Communist Party has concluded their twice-a-decade Congress and reshuffled their Politburo and central committee to feature more Xi loyalists in preparation for his third consecutive five-year presidency . Speculators view this reshuffling as a signal that China is readying to formally attack Taiwan in the coming months. Through a war games lens, two full scale wars in different parts of the world would diminish the magnitude of a counteroffensive by the US and NATO, something military strategists on all sides are likely aware of. Key Upcoming Dates: S&P US October Manufacturing PMI at 945am EST 10/24; US October Consumer Confidence Index at 10am EST 10/25; US September New Home Sales at 10am EST 10/26; 20th and Final GDPNow US Q3 GDP estimate 10/26; US Q3 GDP First Estimate at 830am EST 10/27; US September PCE Price Index at 8am 10/28; FOMC Statement at 2pm EST 11/02.*
Price is currently trending up at ~$1310 as it continues to trend sideways along $1270 support for what is now thirty three consecutive sessions. Volume is currently Low (moderate) and on track to favor buyers for a second consecutive session if it can close today's session in the green. Parabolic SAR flips bullish just below the 50 MA ($1408) at $1355, this margin is bullish at the moment. RSI is currently trending up at 46.5 as it approaches the upper trendline of the Symmetrical Triangle from February 2020 at ~52 as resistance. Stochastic crossed over bullish in today's session and is currently trending up at 63 as it continues to test 46.76 support. MACD remains bullish and is currently trending up slightly at -19, the next resistance is at 28. ADX is currently trending down slightly at 29 as Price continues to trend sideways, this is neutral at the moment.
If Price is able to push higher here then it will likely retest the 50 MA at ~$1400 as resistance which is just below $1427 resistance . However, if Price breaks down here, it will likely retest $1270 minor support before potentially heading lower to $1k minor support . Mental Stop Loss: (one close below) $1269.54.

BTC Daily TA Cautiously BearishBTCUSD daily guidance is neutral bearish. Recommended ratio: 35% BTC, 65% Cash.
*BULL TRAP WATCH. Bitcoin is at a critical resistance and is currently testing a one year descending trendline. Cryptos, Equities, Equity Futures, Energy, Gold, GBPUSD and JPYUSD are all down while DXY, US Treasuries, VIX, Agriculture, EURUSD and CNYUSD are up. UK Prime Minister Liz Truss resigned today leaving the Conservative Party looking for its third Prime Minister in as many years . Chatter from Federal Reserve staff continues to point to a 75bps rate hike with a strong possibility of 100bps, Philadelphia Fed President Harker (not a current FOMC member) said today that he expects FFR to be well above 4% by year end (it's currently at 3%-3.25%) . Key Upcoming Dates: S&P US October Manufacturing PMI at 945am EST 10/24; US October Consumer Confidence Index at 10am EST 10/25; US September New Home Sales at 10am EST 10/26; 20th and Final GDPNow US Q3 GDP estimate 10/26; US Q3 GDP First Estimate at 830am EST 10/27; US September PCE Price Index at 8am 10/28; FOMC Statement at 2pm EST 11/02.*
Price is currently testing $19417 support for the fifty-third consecutive session as it retests the descending trendline from November 2021 for the first time since March 2022; this is a critical juncture that will influence whether BTC will retest $15k or breakout to $24k. Volume is on track to be both Moderate (high) and on track to favor sellers for a third consecutive session. Parabolic SAR flips bullish at $20k, this is mildly bullish at the moment. RSI is currently trending down slightly at 43.76 as it approaches a retest of 42.41 support, if it breaks below this level then the next support is at the uptrend line from January 2022 at ~35. Stochastic crossed over bearish in today's session and is currently trending down at 25 as it's still technically testing 29.70 resistance. MACD remains bullish for a fourth consecutive session but continues to trend sideways at -175 for what is now nine consecutive sessions; it's technically testing -232 minor support. ADX is currently trending sideways at 12 as Price is seeing selling pressure, this is neutral at the moment; if ADX begins trending up as Price continues to fall this would be mildly bearish, and if it falls as Price continues to go down this would be mildly bullish.
If Price is able to breakout of the descending trendline from November 2021 at $19417 resistance then it will likely aim to retest $24181 resistance ; it's important to be wary of a potential Bull Trap in this environment. However, if Price is rejected here, it will likely retest the uptrend line from March 2020 at ~$15.5k as support for the first time since September 2020. Mental Stop Loss: (two consecutive closes above) $19417.

ETH Daily TA Neutral BullishETHUSD daily guidance is neutral with a bullish bias. Recommended ratio: 60% ETH, 40% Cash.
*Cryptos are mixed with certain altcoins like ANKR ( hot off of APTOS integration news ), ATOM and MATIC up while the broader market is mostly flat. Equities, Equity Futures, Gold, EURUSD and 30yr US Treasury bonds are up while VIX, Energy, Agriculture, 10yr US Treasury bonds, DXY, GBPUSD, JPYUSD and CNYUSD are all down. Netflix beat Q3 expectations on both top and bottom lines . Russia continued its renewed attacks on Ukraine today and Ukraine reports that 30% of their power grid infrastructure has now been damaged . Key Upcoming Dates: US September Building Permits and Housing Starts at 830am EST 10/19; 19th GDPNow US Q3 GDP estimate 10/19; S&P US October Manufacturing PMI at 945am EST 10/24; US October Consumer Confidence Index at 10am EST 10/25; US September New Home Sales at 10am EST 10/26; US Q3 GDP First Estimate at 830am EST 10/27; US September PCE Price Index at 8am 10/28; FOMC Statement at 2pm EST 11/02.*
Price is currently trending up at ~$1315 after bouncing off of $1270 minor support as it looks to retest the 50 MA as resistance at $1427 resistance. Volume is currently High (low) and on track to break a two day streak of buyers dominance if it can close today's session in the red. Parabolic SAR flips bullish at $1371, this margin is bullish. RSI is currently trending down at 46 after forming a peak just below the upper trendline of the Symmetrical Triangle from February 2020 at ~49. Stochastic remains bullish, is currently trending up at 86 and is still technically testing 81 resistance. MACD remains bullish and is currently trending up slightly at -31, the next resistance is at 27.77. ADX is currently trending down slightly at 31 as Price is slowly rising, this is neutral at the moment.
If Price is able to continue up from here then it will likely retest the 50 MA as resistance at $1427 resistance . However, if Price breaks down here, it will likely retest $1270 minor support . Mental Stop Loss: (one close below) $1270.

BTC Daily TA Cautiously BearishBTCUSD daily guidance is cautiously bearish. Recommended ratio: 25% BTC, 75% Cash.
* SUNDAY SCARIES WATCH . As the world awaits Putin's next move on Ukraine and the West, the White House sent another $725m to Ukraine and Elon Musk reinstated free Starlink services to Ukraine today. Additionally, the White House's newly imposed sanctions on Chinese chipmakers is starting to be felt as many Chinese American workers are fleeing back to the USA and both supply + demand for Chinese chips is starting to see weakness. Key Upcoming Dates: US September Building Permits and Housing Starts at 830am EST 10/19; 19th GDPNow US Q3 GDP estimate 10/19.*
Price is currently trending down slightly at ~19130 as it continues to test $19417 support for what is now thirty one consecutive sessions; it's approaching the descending trendline from November 2021 which will likely coincide with the 50 MA at ~$19800 as resistance. Volume was Low (moderate) and favored sellers for a second consecutive session in today's session; Price continues to trade in the POC. Parabolic SAR flips bullish at $20280, this margin is neutral at the moment. RSI is currently trending up slightly at 45 after bouncing off of 42.41 support for the fourth time in the past month. Stochastic crossed over bearish today and is currently trending down at 10 as it approaches max bottom. MACD remains bearish for the second consecutive session and is continuing to trend sideways at -232.42 minor support for the sixth consecutive session. ADX is currently trending sideways at 15.5 as Price does the same at ~$19417, this is neutral at the moment.
If Price is able to bounce here and breakout above the 50 MA + the descending trendline from November 2021 at ~$19800 as resistance then it will likely aim to retest $24181 resistance . However, if Price breaks down here, it will likely retest the uptrend line from March 2020 at ~$15k as support . Mental Stop Loss: (two consecutive closes above) $19800.

ETH Daily TA Neutral BearishETHUSD daily guidance is neutral with a bearish bias. Recommended ratio: 40% ETH, 60% Cash.
* SHORT SQUEEZE WATCH . US September Retail Sales came in at $684b , virtually unchanged from August but still 8.2% above September of last year. This strong consumer data will surely influence the Federal Reserve to continue pondering raising FFR by more than 75bps on November 2nd. The 18th GDPNow US Q3 GDP estimate is 2.8% , down from 2.9% on 10/7. Preliminary results for the October UofM Consumer Sentiment Survey show an increase from 58.6 in September to 59.8 in October. Putin made more threats regarding a "global catastrophe" to NATO should they become directly involved in Russia's war against Ukraine. He also set the stage for reclosing the humanitarian corridors Russia agreed to allow Ukraine to use to transport grain and fleeing citizens; this could lead to more supply chain woes in the near future. Cryptos, Equities, Equity Futures, Commodities, GBPUSD, EURUSD, JPYUSD and CNYUSD are all down while DXY, US Treasuries and VIX are up. Key Upcoming Dates: US September Building Permits and Housing Starts at 830am EST 10/19; 19th GDPNow US Q3 GDP estimate 10/19.*
Price is currently testing $1270 minor support for the fifth consecutive session as it continues to trade in the largest trading zone (POC) on the chart for twenty three consecutive sessions now. Volume is currently High (moderate) and on track to favor buyers in today's session after favoring sellers in yesterday's session. Parabolic SAR flips bullish at $1389, this margin is mildly bullish. RSI is currently trending up at 43 after bouncing off of the uptrend line (also the lower trendline of the massive Symmetrical Triangle) from November 2018 at 36.91 support, the next resistance is the descending trendline from February 2020 at ~51.25. Stochastic crossed over bullish in today's session and is currently testing 46.76 resistance. MACD remains bullish and is trending up slightly at ~-35 as it continues to test -46.46 minor resistance for the ninth consecutive session. ADX is currently trending sideways at 31 as Price attempts to defend $1270 minor support, this is neutral at the moment.
If Price is able to defend $1270 minor support then it will likely aim to retest the 50 MA as resistance at $1427 resistance . However, if Price breaks down here, it will likely retest $1k minor support before potentially retesting $776 support for the first time since January 2021. Mental Stop Loss: (two consecutive closes above) $1270.

BTC Daily TA Cautiously BearishBTCUSD daily guidance is cautiously bearish. Recommended ratio: 35% BTC, 65% Cash.
* BULL TRAP WATCH . The FOMC Minutes confirmed what every investor should be aware of and that is that the Federal Reserve will remain committed to raising the federal funds rate to restrictive levels until a meaningfully sustained decrease in inflation is observed. FOMC members noted that despite a slowdown in the labor market, the economy is still in good enough shape to withstand more rate hikes. Cryptos, Equities, Commodities, VIX, GBPUSD, EURUSD and CNYUSD are flat or down while DXY, US Treasuries, JPYUSD and Equity Futures are up. CPI reports tomorrow and will likely send markets lower if it doesn't show signs of slowing. Key Upcoming Dates: September US CPI at 830am EST 10/13 ; September US Retails Sales at 830am EST 10/14; 18th GDPNow US Q3 GDP Estimate 10/14; UofM October Consumer Sentiment Index at 10am EST 10/15.*
Price is currently trending down at ~$19100 and is risking losing $19417 minor support. Volume broke a two day streak of seller dominance and finished today's session High (low), it's currently on track to favor sellers if it closes tomorrow's session in the red. Parabolic SAR flips bearish at $18500, this margin is bearish. RSI is currently trending down slightly at 43.75 as it approaches a retest of 42.41 support. Stochastic remains bearish and is currently completing a trough as it approaches a bullish crossover at 6.50. MACD is currently beginning to trend bearish at -232.42 minor support after 3 consecutive sessions of trending sideways at this level. ADX is currently beginning to form a trough at 13.50 as Price is beginning to trend lower and risk losing $19417 minor support.
If Price is able to bounce here, be leery of a potential bull trap as it approaches a retest of the 50 MA at ~$19700 as resistance which should also coincide with the descending trendline from November 2021 (as resistance). However, if Price breaks down here and loses $19417 minor support, it will likely retest the uptrend line from March 2020 at ~$15k as support for the first time since September 2020. Mental Stop Loss: (two consecutive closes above) $20k.

BTC Daily TA Neutral BearishBTCUSD daily guidance is neutral with a bearish bias. Recommended ratio: 48% BTC, 52% Cash.
* SUNDAY SCARIES WATCH . Cryptos are largely flat with some altcoins seeing buying pressure as we get halfway through the weekend. Someone has used a car bomb to explode the only supply line from Crimea to Russia and many presume it to be the Ukrainians , which reignites a whole new round of fears regarding the potential usage of chemical or nuclear warfare by Russia on Ukraine. Of course in this scenario, it would almost certainly result in NATO intervention and may finally be the event that gets the media to use the term World War 3. Because war is historically bullish for DXY, if rate hikes continue into 2023 and war escalates, you can almost assuredly bet that DXY will hit $120 like it did in the early 80's and 2000-02. And if DXY keeps going higher, "Risk-On" assets like Growth Stocks and Cryptos will likely keep going lower. Key Upcoming Dates: FOMC Minutes at 2pm EST 10/12; September US CPI at 830am EST 10/13; September US Retails Sales at 830am EST 10/14; 18th GDPNow US Q3 GDP Estimate 10/14; UofM October Consumer Sentiment Index at 10am EST 10/15.*
Price is currently testing $19417 support for the second consecutive session as it gets closer to retesting the descending trendline from November 2021 at ~$20200 as resistance. Volume is Low (low) and currently on track to favor sellers for a fourth consecutive session if it closes today's session in the red. Parabolic SAR flips bearish at $18.3k, this margin is mildly bearish at the moment. RSI is currently trending down slightly at 46.5 as it approaches a retest of the descending trendline from January 2021 as support at 42.41 support. Stochastic remains bearish and is currently testing 55.55 support with no signs of trough formation, the next support after that is at 29.70. MACD remains bullish and continues to trend sideways for the third consecutive session at -70, it's still technically testing -232.42 minor support. ADX is currently trending down at 15 with no signs of trough formation as Price is falling, this is neutral at the moment.
If Price is able to bounce here then it will likely retest the 50 MA at ~$20k as resistance before potentially retesting the descending trendline from November 2021 at ~$20200 as resistance . However, if Price breaks down here, it will likely continue to trend sideways until it reaches the descending trendline where it will either break out of the almost one year long descending trend or be rejected and fall to retest the uptrend line from March 2020 at $15k as support for the first time since September 2020. Mental Stop Loss: (two more consecutive closes above) $19417.

BTC Daily TA Cautiously BearishBTCUSD Daily guidance is cautiously bearish. Recommended ratio: 10% BTC, 90% Cash.
* US August Consumer Confidence rose for the first time after three consecutive months of decline and is now 103.2 , up from 95.3 in July. Meanwhile, Russia is furthering the WW3 narrative and the Federal Reserve is pushing the US into a recession... very 2022. Though Cryptos are mixed in price action today they are fairing better than Equities which have continued to plummet. Commodities, Equity Futures, EURUSD and Gold are all down while VIX, US Treasuries and DXY continue to go higher with DXY reaching a 22 year high of $112 in today's session. As long as DXY keeps going up, which it likely will if FFR keeps going up, it's going to suck liquidity from just about every other asset. Russia and China are currently wildcards that can either exacerbate or mitigate a financial migration to DXY as a safe haven asset. Key Upcoming Dates: September US Consumer Confidence Index at 10am EST 09/27; August US New-Home Sales at 10am EST 09/27; Final US Q2 GDP revision at 830am EST 09/29; August US PCE price index at 830am EST 09/30.*
Price is currently trending down at ~$18700 after being rejected by $19417 resistance for the third consecutive session. Volume is currently Moderate (high) and on track to favor sellers for three of the past four sessions if it closes today's session in the red. Parabolic SAR flips bullish at the 50 MA ($21.3k), this margin is neutral at the moment. RSI is currently trending down at 40 after being rejected by the descending trendline from January 2021 at 45 and breaking below 42.41 support. Stochastic remains bearish and is currently trending sideways at 15 as it attempts to crossover bullish. MACD remains bearish and is currently trending down at -571 with no signs of trough formation as it approaches -869 minor support. ADX is currently trending up at 24.34 as Price continues to fall, this is bearish.
If Price is able to bounce here then it will have to flip $19417 resistance to support if it is to test the descending trendline from November 2021 at $21k. However, if Price continues to break down here, it will likely retest the uptrend line from March 2017 at ~$15k as support . Mental Stop Loss: (two b2b closes above) $19417.

link usdt possible long entry price broke the level and retrace from the same level and now again following the bullish trend .
trade your levels according

ETH Daily TA Neutral BullishETHUSD Daily TA neutral with a bullish bias. Recommended ratio: 55% ETH, 45% Cash.
*Cryptos remained relatively flat but to the upside this weekend as US Equity Futures are currently up heading into the market open this week. Gold is down and DXY is up. Economic data is showing a slowdown in inflation and demand leading up to the August CPI print on 09/13 but the commitment by the Fed to getting FFR up to at least 4% by early 2023 presents an interesting dilemma going forward. This is because a stronger DXY and US Treasuries naturally puts a cap on potential near-term/medium-term alpha in Equities by attracting liquidity from investors whom are hedging against a global recession. Yes, USD is still king and it's being proven with DXY hitting highs last seen in 2000; Russian Ruble is also thriving but this is largely due to effects of sanctions. The Merge is set for launch on Ethereum's Mainnet on 09/14 . Key Upcoming Dates: 10th GDPNow US Q3 GDP Estimate at 830am EST 09/07; 6th Beige Book at 2pm EST 09/07; August CPI at 830am EST 09/13; The Merge (Ethereum) at 8am EST 09/14; FOMC meeting 09/20-09/21 (Statement Released at 2pm EST on 09/21).*
Price is currently trending sideways at ~$1575 for a fourth consecutive session as it attempts to retest the 50 MA at ~$1660 as resistance. Volume remains Low and fairly balanced between buyer and seller dominance over the last few sessions, it has also been shrinking for seven consecutive sessions which is indicative of an impending breakout or breakdown. Parabolic SAR flips bullish at $1621, this is bullish. RSI continues to trend sideways at ~47 for four consecutive sessions now, the next resistance is at 55.31 and support at 37. Stochastic remains bullish and is currently trending up at 75 as it defies a bearish crossover right below 81 resistance, if it can break above 81 then it will likely be bullish until max top. MACD remains bearish but is currently on the verge of crossing over bullish at -28 support. ADX is currently trending down at 16 as Price continues to consolidate in attempt to move higher, this is mildly bearish at the moment.
If Price is able to continue higher then it will likely retest the 50 MA at ~$1660 as resistance before potentially retesting $1711 minor resistance . However, if Price breaks down here, it will likely retest $1500 as support before potentially retesting $1427 support . Mental Stop Loss: (one close below) $1534.

ETH Daily TA Neutral BearishETHUSD Daily neutral with a bearish bias. Recommended ratio: 48% ETH, 52% Cash.
*JOBS REPORT WATCH. DXY and US Treasuries are dominating headlines again and pulling liquidity from markets as DXY hit $110 in today's session for the first time since September 2002. The 9th GDPNow US Q3 GDP estimate came in at 2.6% today compared to 1.6% on 08/26/22 ; this adds to the basket of recent bullish economic data leading up to tomorrow's Employment Situation. Cryptos are currently attempting to lead a corrective bounce in Risk-On markets after a Jackson Hole inspired sell off. Equities, Futures and Commodities are all down while DXY, US Treasuries, VIX and Cryptos are up. Something to keep an eye on regarding Cryptos next week is the due date for responses to the Biden Admin's Executive order on cryptocurrencies from market regulators and the US Treasury, Commerce and Justice Departments. Though mainly focused on the viability of a CBDC and its implementation, it will also help clarify which regulatory agencies are responsible for what in the cryptocurrency industry. Interestingly it will also discuss Proof of Work mining and its burden on ESG policies just days before Ethereum is set to transition to Proof of Stake. The Merge is still scheduled for launch on Ethereum's Mainnet 09/15/22 . Bitcoin Maximalist Michael Saylor is being sued by the Washington D.C. Attorney General for alleged tax evasion . Key Upcoming Dates: August Employment Situation 830am EST 09/02 ; 6th Beige Book at 2pm EST 09/07; August CPI at 830am EST 09/13.*
Price is currently trending up at ~$1566 and deciding between an Ascending Triangle breakout or a Bear Flag breakdown, the next resistance is the 50 MA (~$1640) which it has tested in the previous two sessions. Volume is Moderate and on track to favor buyers for a second consecutive session if it can close today's session in the green. Parabolic SAR flips bullish at $1683, this margin is mildly bullish at the moment. RSI is currently trending up slightly at 45 after successfully defending the descending trendline from 07/17/22 as support at 37 support. Stochastic remains bullish and is currently testing 47 resistance with no signs of peak formation. MACD remains bearish and continues forming a trough at -46 minor support, if it can break above -22 it would be a bullish crossover. ADX is currently trending down slightly at 22 as Price is trending up, this is mildly bearish.
If Price is able to continue higher then it will likely retest the 50 MA at ~$1640 as resistance for a third consecutive session. However, if Price breaks down here, it will confirm a Bear Flag formation which would likely have Price retest $1427 support . Mental Stop Loss: (two consecutive closes above) $1711.
