BTCUSD: $150,000 on a repetitive pattern.Bitcoin is neutral on its 1D technical outlook (RSI = 54.823, MACD = 486.400, ADX = 23.402) possibly going through the last consolidation before the next breakout to a new ATH. The whole 2023-2025 Bull Cycle has been on a repetitive pattern, bottoming on the HL Zone and peaking on the HH trendline, while forming clear wave structures. According to this, the next HH should be around 150,000 (TP).
## If you like our free content follow our profile to get more daily ideas. ##
## Comments and likes are greatly appreciated. ##
Cryptotrading

Is #BCH About to Fall or Will it Continue to Rise? Key LevelsYello Paradisers! Have you seen what’s cooking on #BCHUSDT lately? Let’s dive into the latest structure on #BitcoinCash and what may unfold next:
💎#BCH has been trading within a well-respected ascending channel since early April, consistently bouncing between dynamic ascending support and resistance levels. However, the current move into the $500–$505 resistance zone is showing clear signs of momentum exhaustion, as price stalls and volume fades.
💎The strong resistance area between $500 and $505 has rejected price multiple times, and this recent rejection aligns with both the channel resistance and a bearish momentum divergence in volume. Unless #BCHUSD can break and hold above this zone, bulls are fighting a losing battle.
💎The invalidation of the bearish setup lies above $555. Only a confirmed breakout and sustained hold above this level would negate the current bearish structure and open room for a larger bullish expansion. Until then, the risk of a deeper retracement is very real.
💎Currently trading around $490, #BCH looks vulnerable to a drop toward the moderate support zone near $393, with the strong demand zone between $335 and $340 being the high-probability area for a smart-money reaccumulation—if the market flushes weak hands first. This zone also lines up with previous high-volume nodes on the VRVP.
Trade smart, Paradisers. This setup will reward only the disciplined.
MyCryptoParadise
iFeel the success🌴

CTSI About to Detonate? Yello Paradisers! Are you ready before CTSI makes its next explosive move? Because this setup is flashing signals that most traders will only realize when it's already too late.
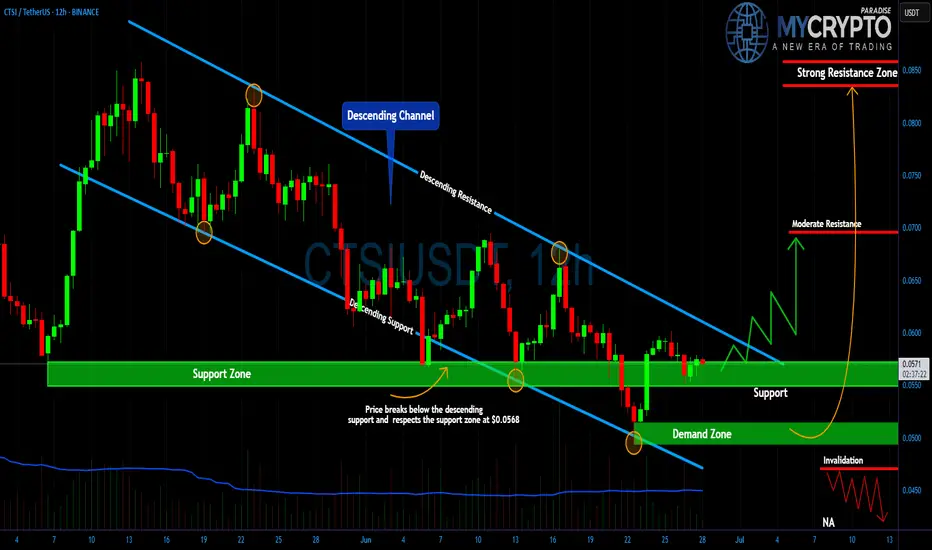
💎#CTSI/USDT has been trading within a clearly defined descending channel, consistently respecting both the resistance and support trendlines. What's important now is how the price has reacted after dipping into the lower boundary. After breaking slightly below the descending support, the price immediately rebounded from the key horizontal support area at $0.0552 a region that has repeatedly proven its strength over the last few weeks.
💎This recent price action confirms strong buyer interest at the current levels, and as long as the $0.0550–$0.0570 zone holds, #CTSI remains in a potential accumulation phase. The reaction here suggests that smart money might be stepping in early, preparing for a breakout move that could take retail traders by surprise.
💎If momentum begins to build and the structure breaks above the descending resistance line, the first technical obstacle will be around $0.0700 a moderate resistance that has capped price action before. A sustained move through this level would confirm the breakout, with the next key target sitting at the strong resistance zone near $0.0850. This would represent a solid bullish extension for those positioned early inside the channel.
💎However, the invalidation point is also very clear. A breakdown below the $0.0500 region, where the final demand sits, would invalidate the bullish setup and open the door to deeper downside. For now, though, the structure is favoring a potential reversal, and the market is giving us a clean range to work with.
Strive for consistency, not quick profits. Treat the market as a businessman, not as a gambler.
MyCryptoParadise
iFeel the success🌴
DOGEUSD: $1.100 is the minimum target.Dogecoin is bearish on its 1D technical outlook (RSI = 37.555, MACD = -0.00967, ADX = 29.193), suggesting that it is heavily undervalued in relation to the position it has during the same stage of the previous Cycles. All Cycles have smashed through the top red Mayer Multiple Band before pricing the Top. This means that by the end of the year, we can expect at least $1.100 for Doge (current projection of the Top Mayer Band).
## If you like our free content follow our profile to get more daily ideas. ##
## Comments and likes are greatly appreciated. ##

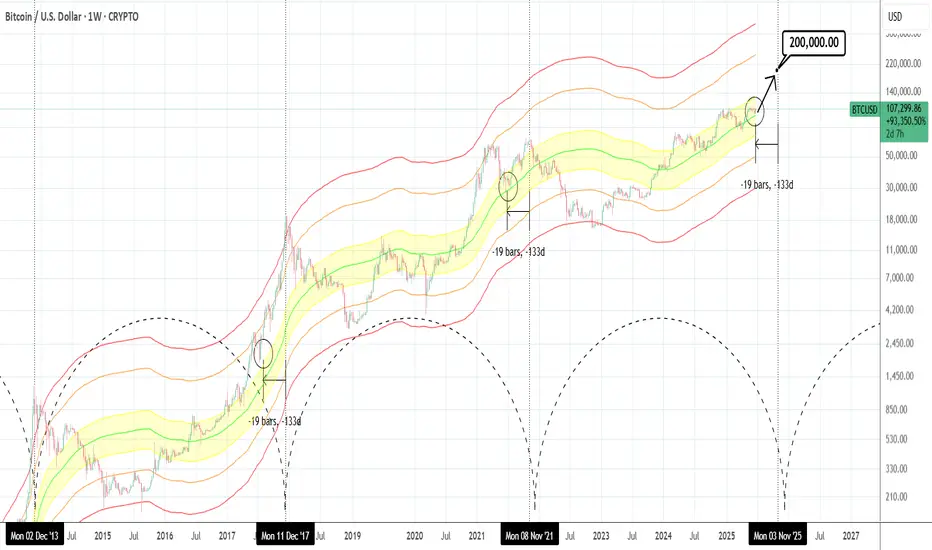
BTCUSD: Hasn't gone parabolic yet.Bitcoin is just now re-entering the bullish state on its 1D technical outlook (RSI = 55.820, MACD = 291.960, ADX = 15.180), being correcting/consolidating in the past 30 days. According to the Mayer Multiple Bands, it's stil inside the range (upper band) of the 1 Stdev Below-Mean-1 Stdev Above (yellow range). This suggest significant upside potential as being roughly 19 weeks before the Cycle tops, it matches the late June 2021 bottom inside that zone as well as the July 2017 bottom just over the top of that zone. The orange trendline has been the minimum target on every Cycle but looks unlikely to hit it by the end of the year. If however it goes parabolic as all Cycles had at this stage, $200,000 isn't at all far fetched before the Cycle tops.
## If you like our free content follow our profile to get more daily ideas. ##
## Comments and likes are greatly appreciated. ##
ETH 4H – Testing the 200W MA
ETH is trying to reclaim the 200-week MA on the 4H chart.
The last 4H candle closed right on top of it.
The first 4H bar from June 26 closed above the 0.5 Fib, but that level was eventually lost.
If the 200W MA holds as support, price may attempt to flip the 0.5 Fib into support again.
Always take profits and manage risk.
Interaction is welcome.

ETHBTC: Ethereum to outperform massively Bitcoin.ETHBTC turned neutral again on its 1D technical outlook (RSI = 41.566, MACD = -0.00033, ADX = 21.423) as in the past 4 weeks it failed to extend the rebound of the April 14th bottom. Ahead of a MACD Bullish Cross, a little further correction to make a Double Bottom (DB) would make the pattern more bullish, much like the December 9th 2019 DB. That was the start of Ethereum's bull season. Similarly, we expect it to start outperforming Bitcoin massively and approach the R1 level (TP = 0.0800).
## If you like our free content follow our profile to get more daily ideas. ##
## Comments and likes are greatly appreciated. ##

CHZ Bulls Are Getting Trapped Again —Another Nasty Drop Loading?Yello Paradisers did you notice how clean this CHZ rejection was? After a textbook touch of descending resistance, the price got slammed down again, and what comes next might catch many traders off guard. If you’re not prepared, this next leg could drain portfolios fast.
💎#CHZ/USDT continues to respect its well-defined descending channel on the 12H chart. Every time price attempts to rise, it's met with aggressive selling and this latest bounce was no different. Price failed to even reach the major supply zone between 0.03800 and 0.04200 before getting rejected at the resistance layer around 0.03600. This weakness suggests buyers are running out of steam and may not have the power to defend current levels for much longer.
💎The setup is straightforward #CHZ is trading within a strong bearish structure. The lower highs and lower lows pattern remains intact, and the most recent push up couldn’t break the descending resistance line. This latest rejection also aligns with the horizontal resistance just below the supply zone, which adds confluence to the bearish outlook. Unless the price breaks and closes above 0.04423 which would invalidate the current downtrend the path of least resistance remains to the downside.
💎The next level to watch is moderate support at 0.03026, but more importantly, all eyes should be on the major support zone down at 0.02562. That’s where significant liquidity is likely to be resting and that’s where smart money will be hunting for entries once retail panic sets in.
Right now, volume remains weak, and there’s no bullish momentum strong enough to break out of this channel. Until that changes, expect this to play out as another trap pushing late longs into losses before sweeping the lows.
MyCryptoParadise
iFeel the success🌴

INJ Long Swing Setup – Breakout Retest Opportunity at Key LevelIf the crypto market pushes higher and INJ flips current resistance into support, we’ll be looking to enter on a retest of the $11.60 zone. This level could act as a launchpad for the next leg up.
📌 Trade Setup:
• Entry Zone: $11.60 – $11.60 (Breakout Retest)
• Take Profit Targets:
o 🥇 $14.20 – $16.25
o 🥈 $19.80 – $23.00
• Stop Loss: Daily close below $10.70

OLUSDT Ready to Explode? Don’t Miss This SetupYello Paradisers, is this the calm before the storm? #OLUSDT has just bounced off a key support zone and is now grinding right under a critical resistance. If you’ve been following our recent plays, you know exactly how this pattern can end with an explosive move that catches the herd completely off guard. This chart setup demands attention right now.
💎What we’re seeing is a textbook descending broadening wedge formation, which historically leads to powerful breakouts when the price breaks through the upper trendline with volume. #OLUSDT has respected this wedge perfectly, with two touches on both the resistance and support lines, confirming its technical strength. At the time of writing, the price is testing this resistance again, and any sustained breakout above it could flip the current structure bullish and trigger a rally.
💎The recent bounce came directly from a strong support zone between $0.028 and $0.030, an area that has consistently absorbed selling pressure. This level is now acting as the foundation for a potential trend reversal. As long as the price remains above this zone, bulls remain in control of the narrative. However, a daily close below $0.028 would invalidate the current bullish setup, signaling that bears may still have fuel left to drive the price lower, potentially targeting the $0.024 region.
💎On the upside, if the resistance gives way, we’re watching three major reaction zones: the first is minor resistance at $0.037, then moderate resistance around $0.043, and finally, the strong resistance zone at $0.046 to $0.050, which would represent a full breakout completion and a 50% move from current levels. These levels are not just random numbers; they represent areas of high liquidity and previous heavy sell interest, so they must be approached with caution and strategy.
Stay ready. Stay focused. And always play the long-term game like a pro.
MyCryptoParadise
iFeel the success🌴

ETHUSD: Waiting for one last breakout.Ethereum remains neutral on its 1D technical outlook (RSI = 48.083, MACD = -39.26, ADX = 21.833), failing so far to close over its 2W MA50, where it's been rejected in the past 3 candles. The last Resistance before the price starts the parabolic rally is the P1 trendline. The price has been trading over it for the majority of this Cycle and only broke under it during the recent Tariff War. A breakout there, extends the Cycle to possibly at least a +346.99% rally from the bottom (TP = 6,200).
## If you like our free content follow our profile to get more daily ideas. ##
## Comments and likes are greatly appreciated. ##

Bitcoin - We have to see new highs now!Bitcoin - CRYPTO:BTCUSD - is now at the previous highs:
(click chart above to see the in depth analysis👆🏻)
It could really not be more exciting on Bitcoin at the moment. With the current "all or nothing" potential breakout or double top creation, we will either see a bullrun or a bear market. So far, bulls are still strong, so the chances of a breakout luckily remain higher.
Levels to watch: $100.000
Keep your long term vision!
Philip (BasicTrading)

BTCUSD: Minimum target for this Cycle is 150,000Bitcoin turned neutral again on its 1D technical outlook (RSI = 52.882, MACD = -410.600, ADX = 22.509) as it recovered the losses of the last 2 days thanks to the Truce announcement between Israel and Iran. The long term picture couldn't be more bullish however as it hasn't even hit the bottom red zone of the Logarithmic Growth Curves model. According to the Time Cycles that mark each Cycle High, the Top for this Cycle is estimated to be between October and December. By October 2025, the top of the first profit taking zone (lightest pink) would be $150,000. That is technically the bare minimum of Top that should be expected based on the current LGC model. Technically it can even hit $200,000 but fundamentals have to help a lot in this scenario (adoption, ETFs, rate cuts).
## If you like our free content follow our profile to get more daily ideas. ##
## Comments and likes are greatly appreciated. ##

Can #LTC Bulls Make Recovery or Bears will Continue to Dominate?Yello Paradisers! Are you ready for the next wave of #LTC that can catch many traders off guard? Let's see the latest setup of #Litecoin and what can happen next:
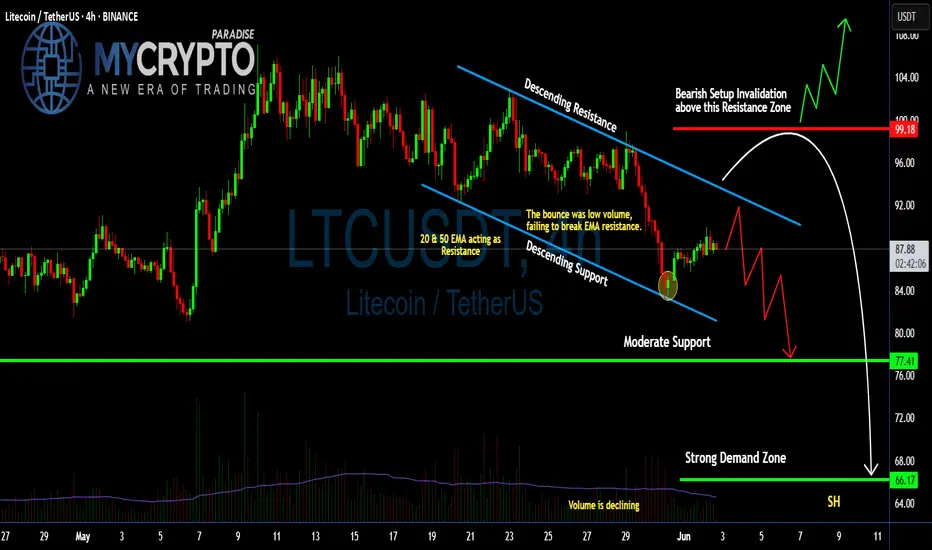
💎#LTCUSDT is currently trapped inside a descending channel, signaling sustained bearish pressure. The most recent bounce came with declining volume and failed to reclaim the 20 & 50 EMA — a clear sign that bulls are running out of steam. These EMAs are now acting as dynamic resistance, capping every upward attempt.
💎The #LTCUSD structure remains bearish as long as the price stays below the key resistance zone near $92.00, especially under $99.18, which marks the invalidation of the bearish setup. If that zone is broken convincingly with huge volume, we could see a short squeeze toward $104.00. Until then, the bias will stay on the downside.
💎Support at $77.41 might offer temporary relief, but if sellers break through that level, all eyes will shift to the strong demand zone at $66.17 — a region that has historically attracted high-volume buying and could serve as a potential bounce area.
💎Volume continues to decline, showing that momentum is fading with each bounce. This increases the probability of a breakdown continuation unless the trendline resistance is flipped with strength and backed by volume. Right now, the chart shows weakness, not reversal.
Stay disciplined. The next big opportunity will come to those who wait not those who chase.
MyCryptoParadise
iFeel the success🌴
Bitcoin Order Book - How To Trade ItBitcoin Order Book Analysis | Massive BTC Liquidity Zones You Need to Watch
In this video, we break down the Bitcoin (BTCUSD) order book and highlight the biggest buy and sell levels currently driving market sentiment. These are the exact price zones where whales and institutions are placing large orders—often creating powerful support and resistance that can trigger breakout or reversal setups.
In This Breakdown:
• Where major buy/sell walls are forming in the BTC order book
• How order book depth can predict short-term price direction
• Real-time liquidity pockets traders are watching now
• Key price levels to watch for possible long/short entries
This is a must-watch if you’re actively trading BTC and want to track where the smart money is stacking their positions.
⸻
Tools Featured:
• BTCUSD real-time chart
• Order book heatmap / depth
• Liquidity zone visualizations
• Volume profile overlays
• Sentiment Tool
⸻
Use this insight to position your trades around high-probability reversal or breakout zones. Comment your BTC target below, and follow for daily pro-level crypto insights.
⸻
#Bitcoin #BTCUSD #OrderBookAnalysis #BTCOrderFlow #WhaleActivity #LiquidityZones #CryptoTrading #PriceAction #CryptoTA #BitcoinStrategy

ETH - ORDER BOOK - BIG LEVELS Ethereum Order Book Analysis | Key ETH Levels Revealed (Real-Time Liquidity Zones)
In this video, we dive into the Ethereum (ETHUSD) order book to uncover major liquidity levels that could influence price action in the short and medium term. By analyzing real-time data, we identify where whales and institutions are placing large orders, which often act as strong support and resistance zones.
What You’ll Learn:
• How to spot large buy/sell walls on the ETH order book
• Why these levels matter for short-term traders
• Real-time reactions to major liquidity zones
• Potential long/short trade setups around key areas
This is essential viewing if you’re trading ETH intraday or swing, and want to anticipate where the next major move may come from.
⸻
Tools Used:
• ETHUSD price chart
• Real-time order book data
• Volume heatmaps
• Liquidity zone mapping
• Sentiment Tool
⸻
Stay ahead of the crowd by understanding how the market reacts to big players’ order placements. Don’t forget to leave a comment with your ETH target, and follow for more pro-level crypto analysis.
⸻
#Ethereum #ETHUSD #ETHAnalysis #CryptoTrading #OrderBook #ETHOrderFlow #LiquidityLevels #CryptoTA #PriceAction #WhaleWatching

Watching for a Double Signal on ETH ETH 4H – Watching for Dual Signal Confirmation
ETH is now trading above the BB center, with both the MLR and SMA also above.
PSAR hasn’t flipped yet, but if upside continues, we could see a bullish flip soon.
If PSAR flips while price holds above range low, that’s a potential dual signal (trend + structure).
Still, this is speculative—price could easily reject here and head lower.
Reminder: ETH remains under the 200MA on both the 4H and daily timeframes.
However, it’s currently holding the 5D 200MA. Idea on that coming soon.
Always take profits and manage risk.
Interaction is welcome.

QNT Is Breaking Down — Are You ReadyYello Paradisers, Have you seen what just happened with #QNTUSDT? After weeks of grinding higher, the structure has cracked and that crack could turn into a landslide if you're not ready. This isn’t the time for hope or guesswork. It's the time for strategy.
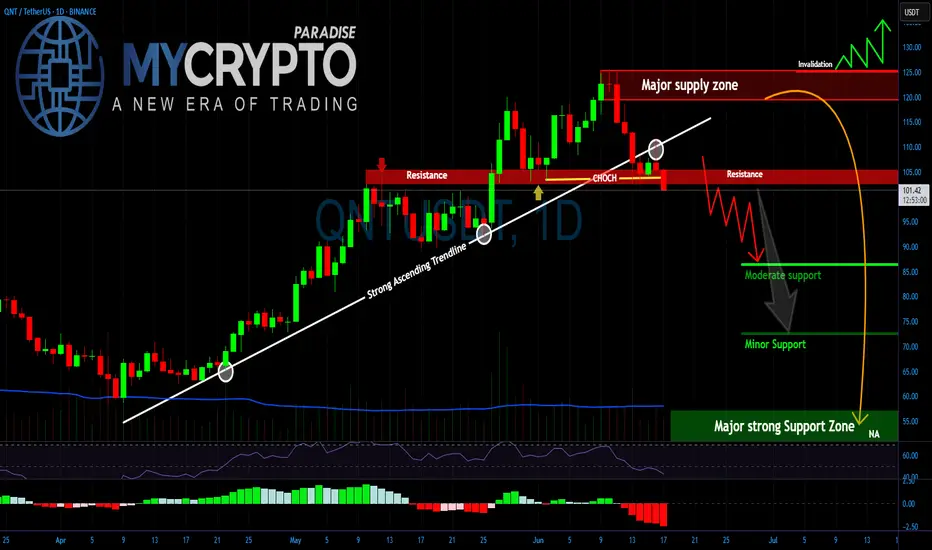
💎#Quant has broken below a major ascending trendline that’s held since April, marking a pivotal shift in its momentum. The market just printed a clean Change of Character (CHoCH) around the $105–106 level, right at the confluence of a key support-turned-resistance zone. That CHoCH level, once a strong foundation for bullish continuation, has now flipped into a headwind. As long as the price stays below this range, we remain in the danger zone.
💎 Adding fuel to the fire is the major supply zone looming above, from $122 to $128. This area has already triggered rejection in the past and will now serve as the final invalidation for any short-term bullish dreams. A reclaim of this zone is highly unlikely in the near term, given the structure and momentum.
💎Now with the trendline cleanly broken and the market unable to hold higher lows, all eyes are on the lower support zones. The $85 region may provide a temporary cushion, but the real magnet lies deeper. We are closely watching the $72–75 area for signs of temporary relief, but the main high-probability reaccumulation zone is sitting all the way down at $55–60. This zone will likely attract smart money accumulation if the market gets there, it will not be by accident.
💎 This isn’t the time to be catching falling knives. Unless #QNT can reclaim the broken trendline and push back above the $106–110 range with conviction, the path of least resistance is down. That also means every lower high that prints now is an opportunity for trained eyes.
Stay ready. Stay focused. And always play the long-term game like a pro.
MyCryptoParadise
iFeel the success🌴
ETH Weekly – Eyes on $1900When panic creeps in, zoom out.
ETH on the weekly has lost both the 200MA and the 0.5 Fib.
In my opinion, if the BB center doesn’t hold here, price could retest the 0.618 Fib level a zone it tends to flirt with often.
The $1900 area might become a solid buy zone.
Always take profits and manage risk.
Interaction is welcome.

ETH 4H – Testing Support, Rejected by Weekly 200MAOn the 4H, ETH is closing below the weekly 200MA but is trying to hold the last daily close as support—similar to what it did on June 5 at 20:00.
The difference: back then, the 4H 200MA acted as support; now it’s been clearly rejected and price sits well below it.
With the weekly close approaching, if ETH stays under the weekly 200MA, there's a strong chance it revisits the range low support.
However, if it manages to reclaim the 200MA before the close, a move toward the last two weekly closes may still be on the table.
Always take profits and manage risk.
Interaction is welcome.

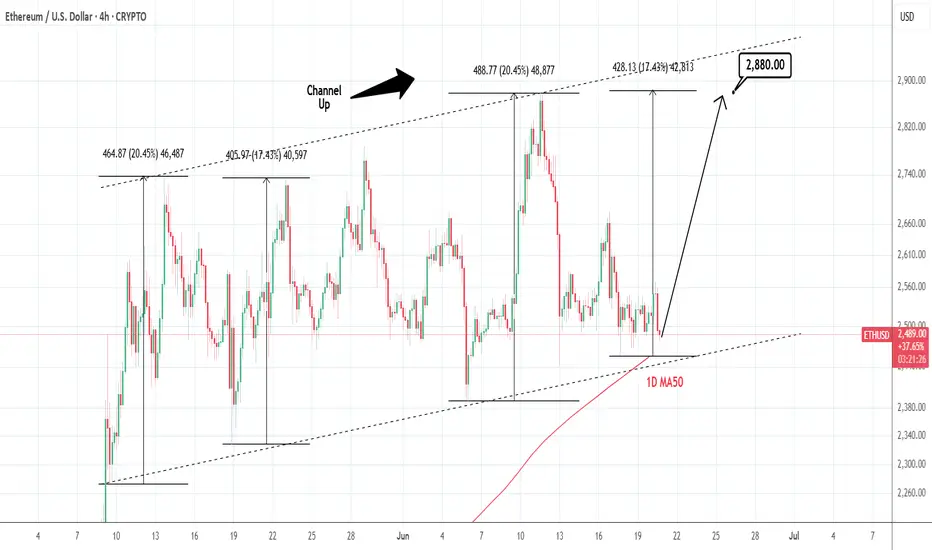
ETHUSD: Channel Up testing 1D MA50. Optimal buy.Ethereum is neutral on its 1D technical outlook (RSI = 47.020, MACD = 17.220, ADX = 20.205), consolidating for the past 3 days. This time it is about to test the 1D MA50, which is technically the long term Support. Since it is also almost at the bottom of the Channel Up, we see this as the most optimal level to buy and aim for the same +17.43% rise (TP = 2,880) it did in May.
## If you like our free content follow our profile to get more daily ideas. ##
## Comments and likes are greatly appreciated. ##
ETH/USDT Key Levels Reclaimed on 4HOn the 4H, price has closed above the 5D + 3D, and W resistance levels.
Will these levels hold and become a launchpad for new higher highs—and possibly counter the 200MA?
We can’t know for sure, but we can make educated guesses.
Always take profits and manage risk.
Interaction is welcome.

BITCOIN (BTCUSD): Strong Bullish Confirmation?!
Bitcoin has a high chance to rise more, following
a strong bullish reaction to a rising trend line on a 4H.
Goal - 108000
❤️Please, support my work with like, thank you!❤️
