AAVE Is on the Edge – Breakout Incoming or Another Drop?Yello Paradisers, is AAVE about to deliver a clean breakout... or is this just another trap to wipe out early bulls?
💎Currently, AAVE is tightly compressed within a falling wedge formation, right above a major support zone between $142 and $147. While this is typically a bullish pattern, nothing is confirmed yet. The MACD is showing bullish divergence, which is often an early sign of a shift in trend, but without a proper breakout above descending resistance, this setup remains incomplete.
💎We’re watching for a clean break and 4H candle confirmation above the wedge. Only then would we consider this a high-probability long setup targeting the $175–$180 resistance zone. Until that breakout happens, entering early would be gambling, not trading. This area has trapped many impatient buyers before.
💎On the other hand, if the price fails to hold above $140 and breaks below the structure, the bullish setup becomes invalidated. In that case, the next area of interest sits around $135, where further downside acceleration could occur.
Patience is key now. This is a moment where discipline will separate the pros from the crowd.
MyCryptoParadise
iFeel the success🌴
Cryptotrading


BTCUSD From Consolidation to DistributionThis BTCUSD 1H chart shows a clear bearish market structure following a prolonged consolidation phase. Price initially ranged sideways within a well-defined consolidation area, which later broke to the upside into a supply zone. That move marked distribution after which Bitcoin reversed and began trading inside a descending channel.
Within the channel, price respected lower highs and lower lows, confirming bearish momentum. A sharp breakdown occurred near the channel midline, accelerating price toward key downside levels. Two downside targets are highlighted:
1st Target (87,356) a short-term liquidity and structure target
2nd Target (84,499) aligned with a strong demand zone, where buyers may step in
Overall, the chart illustrates a classic consolidation distribution trend continuation setup, favoring further downside until demand is reached.

BTC Is Not Weak — It’s Just Quiet Before the Next Big WaveIf I look at BTCUSDT right now through the lens of someone who has lived through multiple market cycles, what I see is a market that is calm rather than weak.
Recent news hasn’t delivered a major catalyst, and that is actually a positive sign. There is no new macro pressure, no unexpected bad news, and capital is still staying within Bitcoin. In that context, the market naturally chooses accumulation over panic selling.
On the chart, BTC is far from losing control . Price remains above the Ichimoku cloud, and the medium-term bullish structure is still intact. The 88,000 USD zone is acting as a psychological buffer — a level where sellers are losing momentum and buyers are starting to wait patiently.
The current volatility should be seen as a short-term position clean-up, not a reversal signal . The market is digesting the previous rally, quietly rebuilding energy for the next move.
As long as BTC continues to hold this price base, the probability of a retest toward the 94,000 USD zone remains high. This is the kind of market that does not reward impatience, but favors traders who understand that sustainable uptrends always need a pause in between.

Don’t Panic With SOL – The Market Is Offering an OpportunitySOLUSDT currently looks like a deep correction within a broader uptrend, rather than a trend reversal. Recent news has mainly created short-term psychological pressure across the crypto market, while Solana’s fundamentals remain solid: institutional capital has not exited aggressively, staking levels stay high, and the ecosystem continues to show healthy activity.
On the chart, the recent drop came from a strong rejection at the descending trendline and the upper edge of the Ichimoku cloud. The key point, however, is that after the breakdown, price did not continue to collapse. Instead, it quickly formed a clear consolidation zone around 125 USDT — a sign that selling pressure is fading and buyers are starting to absorb supply.
The 125 area now acts as a critical support zone. As long as price holds above this level, I favor a scenario where SOL continues short-term fluctuations to build a base, followed by a recovery toward the 132–136 zone.
Overall, SOLUSDT is still following the textbook structure of a healthy uptrend: a sharp drop, base formation, consolidation, and recovery. For me, this is a phase that requires patience, because the market tends to reward those who wait for proper structure — not those who rush in.

SOLANA (SOL) Pullback to Demand Zone with Upside Recovery TargetThis is a 2-hour SOLANA (SOL/USD) price chart showing a transition from a strong uptrend into a corrective phase and potential recovery.
Price initially moves in a clear bullish structure, making higher highs and higher lows while respecting the Donchian Channel (blue bands).
SOL peaks near the 145–147 zone, where upside momentum weakens and price begins to stall.
A sharp bearish breakdown follows, with price decisively falling below the Donchian mid/upper levels, signaling a trend shift or deep pullback.
The decline finds support around the 125–127 demand zone, which aligns with the lower Donchian band and a rising long-term trendline.
Price is currently consolidating near support, suggesting accumulation and a potential bounce.
Two upside objectives are marked:
1st Target: ~135.31 (prior structure / resistance)
2nd Target: ~145.32 (previous high / major resistance)
Overall, the chart highlights a pullback within a broader bullish context, with defined support, resistance, and recovery targets.

XRP / USDT – Daily & 8H AnalysisThe previous bullish FVGs, formed by the aggressive upside move, are now fully filled, removing earlier upside magnets and shifting focus back to structure and key levels.
On the 8H timeframe, price remains within a bearish structure, with the current move up still corrective. Price is consolidating in a pennant formation, suggesting compression rather than confirmation.
The reaction from the 0.75–0.786 retracement zone is technically valid, but without a reclaim this setup leans toward continuation rather than reversal.
For any bullish continuation, XRP must break out of the pennant and reclaim the 2.00 level, preferably with strong 8H closes.
Failure to do so keeps the risk of a lower high and renewed downside liquidity open.
Key focus
Bullish FVGs filled
Pennant = compression, not confirmation
8H structure remains bearish
Reclaim required for continuation
Like & comment if this level gets reclaimed or rejected — structure decides the next move.
MrC

#PHA Ready For a Major Massive Move. Don't Miss this opportunityYello, Paradisers! Is this just another fakeout, or is #PHA about to explode after weeks of silent accumulation? Let's view the #PhalaNetwork trading setup:
💎#PHAUSDT has been trading inside a well-defined descending channel, respecting both the upper resistance and lower support lines for months. But that might be about to change. The price just broke out of the channel and is currently retesting the breakout zone while sitting right above the strong demand area between 0.024 and 0.030.
💎What gives this setup even more power is the clear bullish divergence on the MACD, signaling a loss in bearish momentum right as the breakout occurred. On top of that, we already saw a bullish MACD crossover, adding extra confidence to this move.
💎If buyers manage to hold this support and flip the 50EMA into support, we expect a clean continuation to the upside. The first key target is the moderate resistance at 0.0613, but the real magnet for price is the strong resistance zone between 0.090 and 0.093, where we expect significant supply and profit-taking.
💎However, if #PHAUSD loses the 0.024 support zone, this entire bullish setup gets invalidated. A break below that level would confirm a lower structure and likely trigger another wave of downside.
Trade smart, Paradisers. This setup will reward only the disciplined.
MyCryptoParadise
iFeel the success🌴

SKRUSDT – Structure Shifting, Dump Will Coming?SKR experienced a strong impulsive move upward and is now showing signs of exhaustion near the recent high. Price is consolidating below resistance, suggesting a potential short-term pullback before any continuation.
If sellers step in from this area, price could retrace toward the lower demand zone, which aligns with the next area of interest for buyers.
Entry: 0.0402
Stoploss: 0.0460
Targets:
0.0320
0.0280
As long as price remains capped below the current resistance, the pullback scenario remains valid. A clean break and hold above the high would invalidate this setup and shift bias back to continuation.

Why Does Bitcoin Often Top When Everyone Is Bullish?In the Bitcoin market, there is a familiar paradox:
The more people believe price will keep going up, the closer the market often is to a top.
This isn’t superstition or coincidence.
It’s the result of capital flow, crowd psychology, and how markets truly work.
1. When Everyone Is Bullish, New Buyers Are Running Out
Price can only continue to rise if there are new buyers willing to pay higher prices.
But when:
- Positive news is everywhere
- Social media is full of higher price targets
- “Buy the dip” becomes automatic
→ Most of the available capital is already in the market.
At this stage:
- Those who wanted to buy → already bought
- Those who haven’t → either lack capital or are unwilling to chase price
Demand weakens, while supply quietly starts to appear.
2. Smart Money Doesn’t Buy When Optimism Is Extreme
Large institutions don’t accumulate Bitcoin when:
- News is overwhelmingly positive
- Retail traders are FOMOing
- Price is far from its accumulation zone
Instead, they tend to:
- Buy during doubt
- Dustribute during certainty
When the crowd turns aggressively bullish, it often signals:
Smart money is reducing exposure, not adding to it.
3. Extreme Bullishness Creates Psychological Imbalance
Near market tops, you often see:
- No bearish scenarios considered
- Anyone questioning the trend labeled as “FUD”
- Stop losses ignored in the name of “conviction”
This is a psychological imbalance:
- Expectations are stretched
- Risk is underestimated
At this point, the market doesn’t need bad news.
A lack of new buyers is enough to trigger a correction.
4. Tops Form Quietly, Not in Panic
Many believe a top must come with a violent crash.
In reality:
- Tops often form through choppy price action and slowing momentum
- Volume fades
- Breakouts repeatedly fail
This is when:
Confidence remains high, but underlying strength is already weakening.
5. The Key Lesson for Traders
- Tops don’t form when the market is fearful
- They form when risk is ignored and confidence becomes one-sided
Understanding this helps you:
- Avoid FOMO when everyone is bullish
- Stay cautious when “everyone is right”
- Realize that market psychology matters as much as technical analysis
Final Thoughts
Bitcoin doesn’t top because too many people are bullish.
It tops because when everyone is bullish, the market runs out of fuel.
In trading:
The crowd is usually right in the middle of a trend — and wrong at turning points.
Keeping a calm, rational mindset while others are euphoric
is the true edge of a mature trader.

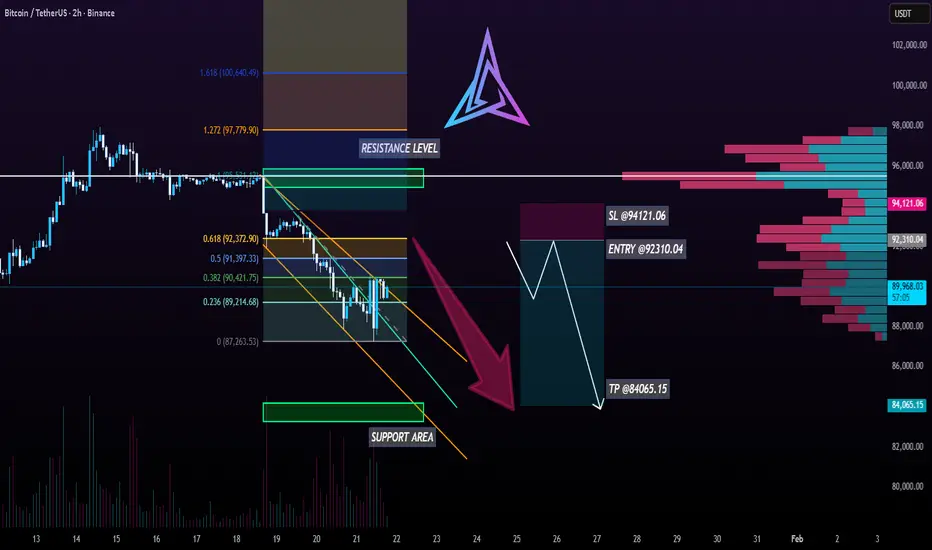
BTCUSDT 2H | Rejected at 0.382 Fib – Bearish ContinuationHello everyone,
BTC 2H chart shows clear rejection at 0.382 Fib retracement ($90,421) after brief rally attempt. Price now back below it (~$89,987 area), maintaining the descending channel structure with lower highs intact.
Key Technicals:
📌 Fibonacci Retracement (Swing High ~$95.5k → Low $87.3k):
0.236 broken, 0.382 rejected multiple times → strong overhead resistance.
📌 Next barriers: 0.5 ($91,397), 0.618 ($92,372).
📌 Descending Channel: Upper trendline capping rallies, lower highs pattern holding.
📌 VRVP: Heavy selling supply stacked $90k–$96k (dominant pink/red bars) → exhaustion on up moves.
Bearish Confluences:
✅ Multiple rejections at Fib + channel resistance despite momentum attempts.
✅ Low-volume zone = increased volatility risk on downside.
✅ Overhead supply from VRVP confirms selling pressure dominant.
SHORT Setup (High-Probability Wait):
Entry: ~$92,310 (confirmed rejection at 0.618 Fib $92,372) – look for long upper wicks, declining volume on approach.
SL: $94,121 (above key resistance) – Risk ~1.962%.
TP Range: $84,065 (1.272 to 1.618 Fib extension confluence + psychological support zone).
Why Wait for Confirmation?
Patience for rejection at resistance → tighter stop, higher probability. No clear signal = no trade.Invalidation: Clean close above $94,121 + volume breakout → bullish flip, reassess higher.
Monitoring next 24–48h for rally to $92k rejection or direct breakdown below $89k. Technical structure holds priority.
DISCLAIMER
Educational analysis documenting my trading process. Not financial advice. Crypto markets are volatile. Use proper risk management. Trade at your own risk!
ROSE/USDT Breakout Alert! Potential to make strong upward move!ROSE has been moving inside a long descending channel and is now pushing back into a key resistance zone area. Price is testing the upper boundary of the channel, which is an important area to watch.
If ROSE can hold above this zone and break out of the channel, the structure flips bullish and opens space for a stronger upside move 🚀
If it gets rejected, price may rotate back inside the channel again 🔻
Right now, this is a critical reaction zone. No rush — let the breakout confirm the direction ⚡️

BIO/USDT On Accumulation, Get Ready For Exploding Soon?#BIO
BIO has completed a long downtrend and is now moving sideways inside an accumulation base.
Selling pressure is slowing, and price is stabilizing after the breakdown phase
As long as this base holds, the chart favors a slow recovery.
A break above the descending trendline would be the first real sign of trend shift 🚀
If the price loses the bottom support, downside pressure could return

CTK Prepping for a Monster Move? Breakdown or Breakout Yello Paradisers! Are you about to catch one of the cleanest reversals of the month, or will you watch CTK take off without you?
💎#CTKUSDT is currently forming a textbook falling wedge pattern. The price has now reached the bottom of this wedge and is sitting directly inside the major support zone between 0.2300 and 0.2400. This is the same area where previous reactions triggered strong upside momentum, and once again, buyers seem to be defending it.
💎What makes this setup more interesting is the clear bullish divergence forming on the MACD. While the price has been making lower lows, the indicator is printing higher lows, which shows that bearish momentum is fading. This divergence, combined with the falling wedge support, gives us a strong probability of an upside breakout in the short term.
💎If the wedge breaks to the upside, the next target is the minor resistance level at 0.2813. That’s the first area where profit-taking might occur. But if bulls manage to reclaim that zone, the strong resistance cluster around 0.3673 to 0.3765 becomes the next magnet for price. This area aligns with previous supply zones and volume profile resistance, so it won't be easy to break, but if momentum carries, it could be a major move.
💎On the flip side, if CTK closes below 0.2124, the entire bullish setup is invalidated, and a deeper correction becomes likely. That’s our invalidation zone, lean, clear, and non-negotiable.
Strive for consistency, not quick profits. Treat the market as a businessman, not as a gambler.
MyCryptoParadise
iFeel the success🌴

FARTCOIN/USDT Forming a Bullish Pattern, Rebound or Broke here!#FARTCOIN is currently holding a major support zone after a long downtrend. Price is now forming an ascending triangle, showing higher lows while facing a clear horizontal resistance above
This tells us one thing: pressure is building. Buyers are stepping in earlier each time, but sellers are still defending the same area
If price can break and hold above this resistance, the structure shifts bullish and opens room for a strong expansion move 🚀
However, if the ascending support fails, price could dip back into the major support zone for another test

Will #XRP Finally Recover or Is This Just Another Trap? Yello Paradisers! Are you keeping your eyes on #XRP? While most traders are zoning out, the next move might catch the crowd sleeping. Let's view #Ripple trading setup:
💎Over the past few weeks, #XRPUSDT has been trading inside a textbook falling wedge pattern on the 4H chart. Just recently, we saw a liquidity sweep below the descending support trendline, an early signal that smart money could be accumulating before a breakout move.
💎The price is currently hovering just above a strong demand zone around $1.73, with a clear descending resistance capping price action. A clean breakout above that resistance, especially if followed by a successful retest and the 50EMA flipping into support, would significantly boost the probability of a bullish move.
💎If this scenario plays out, the first minor resistance for #XRPUSD stands near $1.95, which could act as an initial profit-taking zone. Beyond that, momentum could accelerate toward $2.1951, marked as moderate resistance. But the ultimate upside target is at $2.4175, a strong resistance level with a high volume node, where aggressive sellers are likely to show up.
💎However, caution is key here. If #XRP fails to hold above the current support zone and closes below $1.7366, the bullish setup would be invalidated. That would likely trigger more downside toward $1.70 and possibly lower, especially as weak hands start exiting the market.
Trade smart, Paradisers. This setup will reward only the disciplined.
MyCryptoParadise
iFeel the success🌴

Bitcoin Faces Risk-Off: Short-Term Pullback Ahead?In the current environment, BTCUSDT is under short-term corrective pressure as overall market sentiment shifts toward a risk-off stance. Ongoing economic and geopolitical concerns have prompted capital to temporarily move away from risk assets, and Bitcoin is no exception. This explains the price weakness seen over the past 24 hours.
On the other hand, capital inflows into spot Bitcoin ETFs remain positive, providing an important layer of support for the market. This factor has helped prevent aggressive selling, suggesting that the current move is more of a technical pullback than a broad-based sell-off following the previous rally.
In the short term, the higher-probability scenario is for BTCUSDT to move sideways to slightly lower, unless market sentiment clearly shifts back to risk-on. If price manages to hold key support levels, a technical rebound remains possible; however, a clean break below support could open the door to deeper short-term downside.

DAM/USDT: Analyzing the Accumulation Floor & Asymmetric UpsideThe Macro Context After a prolonged correction phase (-69% YTD), DAM (Datamine) appears to be establishing a definitive "Market Bottom" structure on the Daily timeframe. The aggressive selling pressure has subsided, leading to a period of stabilization and quiet accumulation.
Why this setup is on our radar:
Seller Exhaustion: The chart shows a classic "rounding bottom" formation. The lack of lower lows suggests that the capitulation phase is over.
Asymmetric Risk-to-Reward: Entering near historical lows offers a unique advantage. The distance to the invalidation level (zero or recent low) is minimal compared to the upside potential of returning to previous valuations.
Market Cycle : With altcoins showing signs of life (+21% in the last month), rotation into undervalued, bottomed-out assets often follows.
Technical Levels & Plan:
Buy Zone: We are looking to accumulate positions in the 0.027 - 0.028 region.
Invalidation Level: A weekly close below the swing low (~0.015) would compromise the structure. ( Note: Due to volatility, manage position size carefully).
Structural Resistance (Targets):
Short Term: 0.030 - 0.034 (Local Supply)
Mid Term: 0.052 - 0.067 (Break of structure)
Macro / Moonbag: If price discovery kicks in, we look towards 0.17 and higher (0.50+) as widely spaced psychological targets.
Risological Note: This is a "Position Trade," not a scalp. The thesis relies on the market pricing this asset as "oversold." Patience is the strategy here.
Disclaimer: This analysis is for educational purposes only. Crypto assets are highly volatile. This is not financial advice.

BTCUSD Facing Supply Zone – Demand Area as Next SupportBitcoin is currently trading inside a range after breaking the ascending channel structure. The bullish momentum has weakened, and price is now respecting a descending supply line, showing sellers are in control.
A clear breakdown from the range confirms short-term bearish bias. Price is likely to move toward the demand zone around 94,000 – 93,900, where buyers may step in for a reaction.
If demand holds, we could see a bounce. If it breaks, expect further downside continuation.
Key Levels:
Supply / Resistance: 97,600 – 98,000
Current Range: 95,000 – 96,200
Demand / Support: 94,000 – 93,900
Bias:
📉 Bearish below supply
📈 Bullish only if strong demand reaction appears
Risk Management:
Always wait for confirmation at demand zone.
Use tight stop-loss below demand to protect capital.
Never risk more than 1–2% per trade.

SUPER Trade Setup – Watching the RetestWe’re tracking SUPER closely as it approaches a major technical juncture. The price is pressing up against the daily descending resistance line, along with a key overhead resistance zone. We're not looking to chase the initial breakout. Instead, we want to see a clean break, followed by a constructive retest and hold above former resistance.
🔁 Trade Plan:
The entry trigger comes on a successful retest of the $0.23 level, turning it into support. That’s our confirmation for a long spot position. If the level holds on the pullback, it could open the door for the next leg up.
🎯 Targets & Risk Management:
Take Profit Zones: $0.28–$0.36 and $0.47–$0.55
Stop Loss: Just below $0.2050

Is #ETC About to Collapse or Explode? One Side Will Get Wrecked Yello Paradisers! Are you watching #ETC closely enough? While the crowd has been ignoring it due to the boring chop, a textbook falling wedge just completed, and the market might be about to catch them completely off guard.
💎For several weeks, #ETCUSDT has been trading within a clear falling wedge pattern. The price has now reached a critical point, hovering just above a strong demand zone between $12.00 and $12.50, where previous accumulation took place.
💎At the same time, MACD is flashing a strong bullish divergence, while price action continued making lower lows, momentum has been climbing quietly behind the scenes. Just recently, we saw a bullish crossover on MACD, reinforcing that momentum is shifting. This is exactly the type of setup we love: structure + demand + momentum convergence.
💎If this wedge breaks to the upside with conviction, we’ll be targeting $14.00 as minor resistance for #EthereumClassic. It will be followed by a potential move toward the $16.06 zone, which marks moderate resistance. Should the bulls sustain pressure above that, the next big magnet will be the strong resistance at $21.56, where sellers are likely to show up in force.
💎However, if #ETCUSD breaks below the support zone at $12.00, and especially if it closes under $9.17, the bullish thesis will be invalidated. That would open the door for a deeper move, as demand dries up and panic sellers take control.
Trade smart, Paradisers. This setup will reward only the disciplined.
MyCryptoParadise
iFeel the success🌴

ORDI Update – Key level reactionORDI has pushed back into a key resistance zone after a prolonged range.
Price briefly broke above resistance but failed to hold, showing signs of a possible deviation rather than a clean breakout.
This level is now critical:
Hold above resistance → acceptance and continuation higher
Failure to hold → rejection back into the range, potentially towards support
This area will decide whether this move has real strength or was simply a liquidity sweep.
Will the breakout hold and continue, or will resistance step in again?
MrC

BITCOIN: Huge Bear-Flag-Formation, Confirmation Incoming!Hello There,
welcome to my new analysis about Bitcoin from a more local timeframe perspective. Recently the price of Bitcoin has been forming a crucial formational structure that will be highly determining for the future outcome. Therefore, I spotted all the important levels and indications to consider in this pivotal determination. Also, this whole setup is corresponding to the bearish Wyckoff distribution I have spotted previously.
As it is seen in the chart, Bitcoin is trading within this massive descending channel formation. In this channel there is a strong resistance formed by the upper boundary of the channel. The fact that Bitcoin already bounced several times to the downside from there makes it a resistance zone, which should not be underestimated in any case. As Bitcoin is approaching this zone again, a pullback from there is highly likely.
There are also further indicators and formations that make the range between $100,000 and $105,000 a major resistance zone. The fact that there is also horizontal resistance from where Bitcoin bounced several times to the downside already in the past makes this an additional resistance. Also, the 100-EMA crossed already below the 50-EMA. This bearish crossover is, in most cases, a sure sign that the trend moves forward to the downside.
Considering all of these crucial levels and indications, we can watch now that Bitcoin is building this pivotal resistance cluster from where a pullback to the downside is highly likely. Several resistance factors come together within this resistance cluster: the upper resistance boundary of the descending channel, the horizontal resistance, and the EMA resistance. All of these levels confirm the bearishness of the cluster.
For the whole bear flag formation, this now means that the formation will be confirmed once the breakout below the lower boundary of the formation happens. As it is marked within my chart, this will provide the final bearish bear flag setup from where Bitcoin is going to continue to the downside. The main target zones of this formation are marked in my chart. Once they are reached, further considerations need to be made.
With this being said, it is great to consider the important trades upcoming.
We will watch out for the main market evolutions.
Thank you very much for watching!
