Is #ETC About to Collapse or Explode? One Side Will Get Wrecked Yello Paradisers! Are you watching #ETC closely enough? While the crowd has been ignoring it due to the boring chop, a textbook falling wedge just completed, and the market might be about to catch them completely off guard.
💎For several weeks, #ETCUSDT has been trading within a clear falling wedge pattern. The price has now reached a critical point, hovering just above a strong demand zone between $12.00 and $12.50, where previous accumulation took place.
💎At the same time, MACD is flashing a strong bullish divergence, while price action continued making lower lows, momentum has been climbing quietly behind the scenes. Just recently, we saw a bullish crossover on MACD, reinforcing that momentum is shifting. This is exactly the type of setup we love: structure + demand + momentum convergence.
💎If this wedge breaks to the upside with conviction, we’ll be targeting $14.00 as minor resistance for #EthereumClassic. It will be followed by a potential move toward the $16.06 zone, which marks moderate resistance. Should the bulls sustain pressure above that, the next big magnet will be the strong resistance at $21.56, where sellers are likely to show up in force.
💎However, if #ETCUSD breaks below the support zone at $12.00, and especially if it closes under $9.17, the bullish thesis will be invalidated. That would open the door for a deeper move, as demand dries up and panic sellers take control.
Trade smart, Paradisers. This setup will reward only the disciplined.
MyCryptoParadise
iFeel the success🌴
Cryptotrading

ORDI Update – Key level reactionORDI has pushed back into a key resistance zone after a prolonged range.
Price briefly broke above resistance but failed to hold, showing signs of a possible deviation rather than a clean breakout.
This level is now critical:
Hold above resistance → acceptance and continuation higher
Failure to hold → rejection back into the range, potentially towards support
This area will decide whether this move has real strength or was simply a liquidity sweep.
Will the breakout hold and continue, or will resistance step in again?
MrC

BITCOIN: Huge Bear-Flag-Formation, Confirmation Incoming!Hello There,
welcome to my new analysis about Bitcoin from a more local timeframe perspective. Recently the price of Bitcoin has been forming a crucial formational structure that will be highly determining for the future outcome. Therefore, I spotted all the important levels and indications to consider in this pivotal determination. Also, this whole setup is corresponding to the bearish Wyckoff distribution I have spotted previously.
As it is seen in the chart, Bitcoin is trading within this massive descending channel formation. In this channel there is a strong resistance formed by the upper boundary of the channel. The fact that Bitcoin already bounced several times to the downside from there makes it a resistance zone, which should not be underestimated in any case. As Bitcoin is approaching this zone again, a pullback from there is highly likely.
There are also further indicators and formations that make the range between $100,000 and $105,000 a major resistance zone. The fact that there is also horizontal resistance from where Bitcoin bounced several times to the downside already in the past makes this an additional resistance. Also, the 100-EMA crossed already below the 50-EMA. This bearish crossover is, in most cases, a sure sign that the trend moves forward to the downside.
Considering all of these crucial levels and indications, we can watch now that Bitcoin is building this pivotal resistance cluster from where a pullback to the downside is highly likely. Several resistance factors come together within this resistance cluster: the upper resistance boundary of the descending channel, the horizontal resistance, and the EMA resistance. All of these levels confirm the bearishness of the cluster.
For the whole bear flag formation, this now means that the formation will be confirmed once the breakout below the lower boundary of the formation happens. As it is marked within my chart, this will provide the final bearish bear flag setup from where Bitcoin is going to continue to the downside. The main target zones of this formation are marked in my chart. Once they are reached, further considerations need to be made.
With this being said, it is great to consider the important trades upcoming.
We will watch out for the main market evolutions.
Thank you very much for watching!

ICP/USDT – This Accumulation Breakout! Get Ready to FLY!ICP has finished its accumulation phase and is now reclaiming a major structural level after a prolonged downtrend. This is not a random move — this is a clear shift in positioning.
Price is holding above the reclaimed zone, signaling acceptance and intent to expand higher. As long as this level holds, upside continuation remains the dominant scenario.
This is where early positioning matters — not after expansion starts.
Entry: 3.78 - 3.3
Stop Loss: 3.05
Target 1: 5.70
Target 2: 7.24
Final Target: 9.37
Bias: Bullish continuation
Invalidation: Daily close back below 3.05

SOL/USDT – This Reclaimed Level Could Send SOL Flying Again#SOL has finally reclaimed a major resistance zone, now acting as strong support. This level previously rejected price hard, and the successful reclaim signals a potential trend continuation.
Momentum is clearly shifting bullish, and as long as price holds above this reclaimed zone, the upside scenario remains highly favored. This is the type of structure that often leads to fast expansions once liquidity above gets targeted.
Bias: Bullish continuation
Invalidation: Loss of the reclaimed support zone
📊 Risk/Reward: 1:2
⚠️ DYOR (Do Your Own Research)

HNT Bull Trap… or the Start of a Massive Move?Yello Paradisers, did you notice what just happened with HNT? While most crypto traders were panicking due to the lower lows, we spotted a hidden bullish divergence forming, and it appears the market is now waking up to it.
💎 After weeks of trending inside a clean descending channel, #HNTUSDT just gave us the first real sign of a potential reversal. The move began with a sharp liquidity sweep below the descending support, trapping late sellers and triggering fresh demand exactly inside the major support zone between $1.307 and $1.363.
💎Zooming in, the MACD is showing a clear bullish divergence, price making lower lows while the MACD formed higher lows. Right after that, we got a bullish crossover, confirming momentum is shifting back in favor of the bulls. These are the exact kind of high-probability signals we wait for, and they’re not common.
💎Now that the price has broken above the descending structure, all eyes are on the next key levels. If HNT can maintain this momentum, we expect a test of the $1.445 area as minor resistance, where a temporary pullback could happen. However, if that level is claimed with strength, the next zone to watch is $1.539, followed by the strong resistance range between $1.730 and $1.74. This is where we'll reassess everything and prepare for either a continuation or rejection.
💎On the flip side, if #HNT breaks down and closes below $1.258, this whole bullish scenario will be invalidated. At that point, we’ll consider this a failed breakout and prepare for downside continuation. Until then, the structure looks strong and healthy.
Discipline, patience, and strategy always win.
MyCryptoParadise
iFeel the success🌴

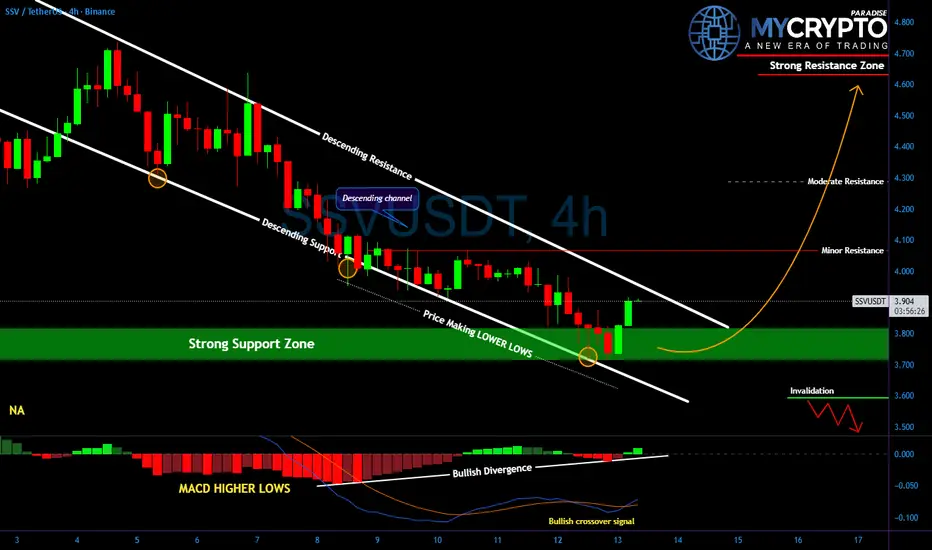
Traders Will Miss This SSV/USDT Reversal Until It's Too LateYello, did you catch that move off support on #SSVUSD? Because what just happened could be the beginning of a major shift, and latecomers might not get a second chance.
💎#SSVUSDT has been moving inside a clean descending channel, forming lower lows with each leg down, but now the price is bouncing right from the strong support zone that's held firm before. The reaction is already showing strength, and it's happening alongside a bullish divergence on the MACD, with higher lows forming while the price was making new lows. That’s a key early signal that momentum is shifting.
💎This type of confluence doesn’t happen by accident. The market is telling us that the sellers are exhausted, and smart money may already be loading up.
💎The structure is clear: if price breaks above the descending resistance, the next logical targets sit around 4.05, then 4.30, and ultimately 4.70 if momentum really kicks in. On the flip side, a clean break below 3.70–3.60 invalidates this reversal scenario and opens the path back toward 3.50.
Be patient, wait for structure to confirm, and stick to your plan. That’s what keeps you consistent while others chase.
MyCryptoParadise
iFeel the success🌴
BITCOIN (BTCUSD): Road to 100k
Bitcoin finally completed a bullish accumulation within
a huge ascending triangle pattern on a daily..
There is a high probability that the market will continue
rising now.
The next strong resistance cluster is 98800 - 101200 area.
I think that it will be reached soon.
❤️Please, support my work with like, thank you!❤️
I am part of Trade Nation's Influencer program and receive a monthly fee for using their TradingView charts in my analysis.

#VET Ready for a Major Bullish Move | Key Levels to Watch Yello, Paradiser! Is #VeChain about to trap all the late bears, or are we about to witness one more brutal shakeout? Let's view the #VETUSDT trading setup:
💎#VET is currently trading around $0.0116 on the 1D timeframe, and just completed a breakout from a textbook Falling Wedge, one of the most reliable bullish reversal patterns when combined with confirmation signals.
💎The breakout has already occurred, and most importantly, it is now retesting the descending resistance to validate this breakout. This is often a critical validation of strength and suggests the move is likely not a fakeout. In addition, we’ve already seen a bullish crossover on the momentum oscillator, which adds further confirmation to this bullish setup.
💎The Strong Demand Zone between $0.0094 and $0.010 is now acting as the base of this bullish structure. Holding above this level is essential. If bulls continue to defend this zone, we anticipate a potential push toward the first major resistance at $0.0138, followed by the strong resistance area between $0.019 and $0.020, where sellers are likely to step in more aggressively.
💎Below the structure, we’ve clearly marked Key Support at $0.0078 for #VETUSD. If price closes below this zone, it would invalidate the bullish scenario and open the door for further downside, potentially into illiquid areas where volatility could spike.
Be patient, wait for structure to confirm, and stick to your plan. That’s what keeps you consistent while others chase.
MyCryptoParadise
iFeel the success🌴

BTCUSD – The Uptrend Is Being ReinforcedAs the market waits for key macroeconomic data, BTCUSD is telling a clear and constructive technical story: price is building a solid base for a sustainable uptrend, rather than reacting in a chaotic way to short-term news.
Looking at the chart, Bitcoin continues to maintain a structure of higher lows, closely respecting a long-term ascending trendline. Each corrective move has stalled precisely within demand zones, confirming that active buying interest remains present. Most importantly, price is now holding firmly above the Ichimoku Kumo — a strong signal that the bullish trend is being accepted by the market, not merely forming a temporary technical rebound.
The 89,400 USD zone is acting as a key support level. Repeated positive reactions from this area clearly highlight it as a defensive zone for buyers. In a constructive scenario, as long as BTCUSD continues to hold above this support and absorb short-term volatility, the next upside objective points toward 94,900 – 95,000 USD, aligning with the upper supply zone and previous reaction highs.
When combined with the news backdrop, as long as CPI data does not come in excessively “hot” , Bitcoin has a solid foundation to extend its current bullish momentum. Technical structure remains supportive, while overall market sentiment is gradually stabilizing — a combination that favors continuation rather than reversal.

ZKP/USDT – This Accumulation Could Be the Next Big BouncePrice has been bleeding inside a clear downtrend, but the momentum is now slowing down. We are seeing strong accumulation at the base, right after price tapped the demand zone and reacted sharply.
The descending trendline is being pressured, and any sustained hold above this area increases the probability of a trend reversal rally. This is the type of zone where smart money typically builds positions before expansion.
If price continues to respect the accumulation base, the path toward higher liquidity becomes very clear.
Entry Zone: Current price area
Stop Loss: 0.1272
Target 1: 0.15427
Target 2: 0.17220
As long as the base holds, the bullish scenario remains valid.
Failure to hold the base invalidates the setup.

Is #IOTA Ready For a Major Bullish Wave or Will it Fall Further?Yello, Paradiser! Are you ready for what could be a brutal shakeout for bears or a golden entry for bulls on #IOTAUSDT? This falling wedge might not stay quiet for long. Let’s break down the #IOTA Setup:
💎#IOTAUSD is currently trading around $0.084 on the 4H timeframe and has just broken out of a textbook falling wedge pattern. This pattern typically signals a bullish reversal, but only when confirmed by proper retest and strength.
💎We’ve already seen a breakout followed by a retest of the descending resistance, which is a key early sign that momentum might be shifting. Adding to that, the 50 EMA is now attempting to turn into support, and if it holds, it significantly increases the probability of a strong bullish follow-through.
💎The demand zone between $0.080 and $0.084 is now acting as the make-or-break level for bulls. Holding above this zone keeps the bullish setup alive. If price continues to build structure above this area, we could see acceleration toward the first major resistance at $0.100, followed by a strong resistance near $0.120, where we expect sellers to become more aggressive.
💎However, as always, risk management comes first. The bullish thesis is invalidated if price breaks below the key support at $0.0717, where the structure would be compromised, and a bearish continuation toward lower liquidity zones could begin.
Trade smart, Paradisers. This setup will reward only the disciplined.
MyCryptoParadise
iFeel the success🌴

Bitcoin Under Pressure - H1-Bearish Flag (10.01.2026)📝 Description 🔍 Setup (Market Structure) COINBASE:BTCUSD
BTC/USDT - Bitcoin is forming a classic Bearish Flag pattern on the H1 timeframe after a strong impulsive sell-off (flagpole). Price is consolidating upward in a tight channel while staying below EMA and Ichimoku cloud resistance, indicating weak bullish momentum and a high-probability continuation to the downside.
📌 Trade Plan - Bearish Bias 📉
Wait for a clear breakdown below the flag support
Aggressive entry: breakdown candle close
Conservative entry: breakdown + pullback (retest of flag support)
📍 Support & Resistance Levels
🔴 1st Support: 88,670
🔴 2nd Support (Measured Move Target): 87,620
🟢 Key Resistance: Bearish flag upper trendline / Cloud resistance
🎯 Target Projection: Height of flagpole applied from breakdown point
#Bitcoin #BTCUSDT #CryptoTrading #BearishFlag #PriceAction #TechnicalAnalysis #CryptoMarket #TradingView #Kabhi_TA_Trading
⚠️ Disclaimer
This analysis is for educational purposes only.
Crypto markets are highly volatile — always use proper risk management and trade with a stop-loss.
💬 Support the Idea 👍 Like if you see the bearish continuation
💬 Comment: Breakdown or Fakeout? 🔁 Share with traders watching Bitcoin

ETHEREUM: Historical and Huge Triangle, +300% Breakout Incoming!Hello There,
welcome to my new analysis about Ethereum from a broader timeframe perspective. Although there are still crucial bearish signs on the local timeframe, which should not be underestimated, the longer-term perspective is rather differentiated. Before moving into this dynamic, it should be said that Ethereum did not break its established trend since 2020. The price action of Ethereum managed to form several higher highs within the structure. Now, there is a major underlying formation that could be the origin of historical price moves.
As when looking at my chart, we can watch Ethereum solidly stabilize within this major range between $1000 and $3000. The $1000 mark is a highly important psychological support level. Above this level, Ethereum is now continuing to finalize this gigantic ascending triangle formation. Within this formation, Ethereum is developing a crucial wave count, of which waves A and B have already formed. Now it is continuing to complete the wave C within this whole structure. Within the local frame of the wave C, Ethereum is forming a bear flag within the descending channel.
Once the price action reaches the lower boundaries of the gigantic triangle formation, there are major underlying supports. Also determined by the 100-EMA marked in green and the 50-EMA marked in blue. Once Ethereum reaches out to these zones, there is a bounce and stabilization highly likely. Especially when the whole wave count from A to C has finalized, this will confirm the origin of a stable bounce within this area. In this case it is highly necessary that Ethereum does not break below the lower boundary because this could invalidate the triangle.
For now it seems as though there will be no such invalidation. Once Ethereum has the ability to break out above the upper boundary of this huge triangle, it will confirm the continuation setup. In this case a mere 300% bounce and expansion into the bullish direction is highly likely. As seen in my chart, the bullish targets will be active once Ethereum has completed the whole triangle formation. Also, there are other factors that make such a price action likely, such as the growing institutional adoption. Besides, Ethereum reached record-high stablecoin transfers of over $8T.
The next times will be extremely decisive, and everything depends on how the environment of Ethereum continues to develop. This will be extremely important for the forthcoming of the whole formational structure. In any case, the historical and influential price changes should not be underestimated in any case.
With this being said, it is great to consider the important trades upcoming.
We will watch out for the main market evolutions.
Thank you very much for watching!

XRP - Descending Channel | Breakout or Breakdown? | Massive News
Hey TradingView community! 👋
XRP is at a make-or-break level right now. Let me break down what I'm seeing on the 45-minute chart.
The Setup
XRPUSD is trading at $2.09 inside a clear descending channel that's been in play since early January. Price has been making lower highs and lower lows, but we're now sitting right at a critical support zone around $2.10-2.18.
This is the moment of truth - either buyers step in here and we get a breakout, or we lose this level and continue lower.
Why This Level Matters
Descending channel support being tested RIGHT NOW
$2.10-2.18 zone has acted as support multiple times
Whale activity spiking to 3-month highs - smart money accumulating?
CNBC just called XRP the "new crypto darling"
Massive institutional news dropping (Ripple + BNY, FCA approval, Evernorth partnership)
The News is HUGE
Ripple just had a monster week:
BNY (Bank of New York) tapped Ripple Prime for tokenized deposits - this is massive institutional adoption
Ripple secured FCA authorization in the UK - clearing path for expansion
Evernorth + Doppler Finance partnership to boost XRP as yield-generating asset for institutions
South Korea announcing spot Bitcoin ETFs - XRP ETF momentum building
Analysts saying XRP could outperform Bitcoin on percentage gains
Key Levels I'm Watching
Resistance:
$2.18 - Upper channel resistance / breakout level
$2.32 - Major horizontal resistance
$2.50+ - Bullish target if breakout confirms
Support:
$2.10 - Current support zone (CRITICAL)
$1.90 - Lower channel support
$1.61 - 52-week low area
My Game Plan
This is a two-scenario setup:
Bullish scenario: If XRP holds above $2.10 and breaks out of the descending channel with volume, we could see a sharp move toward $2.32 and potentially $2.50+. The institutional news flow is extremely bullish - BNY partnership, FCA approval, whale accumulation. If Bitcoin pumps, XRP could explode.
Bearish scenario: If we lose $2.10 support and break below the channel, next stop is $1.90. The descending channel trend would continue until we see a clear reversal signal.
The Bottom Line
I'm cautiously bullish here. The news catalysts are incredible - Ripple is getting institutional adoption at a rapid pace. Whale activity at 3-month highs suggests smart money is accumulating. BUT the chart structure is still bearish until we break out of this descending channel.
Watch the $2.10 level closely. Hold = bullish. Break = more downside.
What's your take? Breakout or breakdown? Let me know in the comments! 👇

BREV/USDT Bullish Continuation ready to explode??BREV/USDT – Demand Reclaim Long Setup
Price has reacted strongly from the demand zone and reclaimed the key level above it. Structure is shifting bullish, opening the door for continuation toward higher liquidity.
Entry: 0.3968 – 0.4057
Stop Loss: 0.3648
TP1: 0.4542
Final TP: 0.5205
Bias remains bullish as long as price holds above the reclaimed demand zone

Bitcoin “Cools Off” as Macro Risks Loom Over the MarketBTCUSDT is now facing a clearer short-term correction risk, as both news flow and technical factors fail to support the bulls.
From a market sentiment perspective, Bitcoin remains under pressure during the Asian session as risk appetite continues to shrink. Rising geopolitical tensions across Asia and Latin America are pushing investors toward a more defensive stance, reducing exposure to high-volatility assets such as crypto. At the same time, markets are waiting for the U.S. Non-Farm Payrolls (NFP) data, reinforcing a “wait-and-see” mindset and leaving buying interest cautious and indecisive.
On the technical side, BTCUSDT has failed to sustain its early-year rebound and is starting to weaken as it approaches the upper resistance zone around 94,300. Recent rebounds appear to be mainly technical, rather than driven by a genuine return of strong capital inflows. Repeated rejections at higher levels signal that profit-taking pressure remains dominant. Meanwhile, 89,400 stands as the nearest support, and a break below this level could open the door to a deeper pullback toward 87,300, a previous consolidation area.
Overall, BTCUSDT is in a sensitive phase : the short-term bearish bias remains favored as macro risks have yet to ease and bullish momentum is still insufficient to trigger a reversal. The current pullback can be seen as a “necessary cleansing phase”, allowing the market to reset before Bitcoin can potentially establish a clearer trend in the next stage.

SOL / USDT – Weekly OutlookPrice is currently reacting around a key horizontal level (~135–140) that previously acted as both support and resistance.
On the weekly timeframe, this level is critical:
A weekly close above this zone → confirms a R/S flip, opening room toward 160 – 180.
Failure to hold → increases chances of a pullback toward 120 – 110 support.
Market structure is still range-bound, so patience is key.
Let the level confirm before committing — weekly closes matter here.
Bias: Neutral → Bullish only after confirmation.
What do you think — will SOL flip this level or reject again?
👍 Like & 💬 comment if this helps — follow @mrctradinglab for more clean level-based setups.
MrC

FHE/USDT ABOUT TO EXPLODE? This Setup Looks TOO CLEAN!After a long downtrend, FHE finally shows a strong reaction from a key support zone — and this is where things get interesting 👀
Smart money doesn’t buy highs… they position where risk is tight and structure starts to shift.
Price is now holding above support with a clear impulsive move, signaling potential trend reversal or continuation play 📈
As long as this base holds, upside expansion remains very attractive with a clean invalidation below.
This is the type of setup traders wait days — sometimes weeks — to catch.
Low risk, high reward, and very clear levels on the chart 🎯
I’ve mapped everything directly on the chart.
Now the only question is… will price respect the level or trap late sellers? 🤔
Not financial advice. Always manage your risk.
Drop your bias below — bullish or fake move?
If you like clean, no-nonsense price action & smart money setups, don’t forget to BOOST 🚀, LIKE 👍, and FOLLOW for more high-probability crypto ideas.
Let’s hunt the next big move together 💰🔥
#FHE #FHEUSDT #Perpetual #CryptoTrading #Altcoins #PriceAction

MYXUSDT Bounce from Major Demand Zone – Bull Reversal Loading?Traders, eyes on MYXUSDT.P! 📈
After a steep downtrend from highs, price has finally hit the key order block demand zone (green area ~4.80-5.16) on the daily/weekly structure.
We saw a classic liquidity sweep below (red zone ~4.56), trapping sellers, followed by a strong bullish candle reversal – this screams potential trend change!
Bullish setup:
Entry: Current levels or pullback to OB support (~5.00-5.16)
Target 1: $5.80
Target 2: $6.40-6.80
Extension: Back to $7.00+
Invalidation: Close below $4.56 (bear trap fails)
Higher timeframe aligns with accumulation – could be the bottom!
Are you bullish on MYX here or waiting for more confirmation? Share your thoughts below! 👇 🔥
If you like precise, no-hype analyses like this, smash that BOOST 🚀, LIKE 👍, and FOLLOW for more daily crypto setups. Let's catch the next big move together! 💰
#MYX #MYXUSDT #Crypto #PerpTrading #Altcoins

XRPUSD: Important Breakout
XRP violated a significant daily resistance cluster yesterday.
The broken structure turned into an important demand zone now.
With a high probability, the price will go up from there and reach 2.51 level soon.
❤️Please, support my work with like, thank you!❤️
I am part of Trade Nation's Influencer program and receive a monthly fee for using their TradingView charts in my analysis.

Bitcoin (D1) - Breaks The Channel - Liquidity Grab Complete ?📝 Description 🔍 Setup (Market Structure) BINANCE:BTCUSDT
Bitcoin was trading inside a well-defined descending channel on the Daily timeframe.
Price has now broken above the channel resistance, showing early signs of trend reversal.
Key confluences:
Multiple support reactions inside the demand zone
Breakout supported by EMA & cloud shift
Strong base formation near higher-timeframe support
Momentum gradually shifting from sellers to buyers
📍 Support & Resistance
🔴 Support Zone: 83,700 – 87,300
🟢 1st Resistance: 107,500
🟢 2nd Resistance: 118,000
#Bitcoin #BTCUSDT #CryptoTrading #PriceAction #ChannelBreakout #SupportResistance #TradingView #Kabhi_TA_Trading
⚠️ Disclaimer
This analysis is for educational purposes only.
Crypto markets are highly volatile — always manage risk and use proper position sizing.
💬 Support the Analysis👍 Like if you trade BTC 💬 Comment: Breakout confirmed or needs retest?

Can #SNX Recover From Here or Will it Continue to Fall?Yello, Paradiser! Are you prepared for the moment when #SNXUSDT finally decides whether it will punish late bears or wipe out impatient longs? Let's look at the #Synthetix trade setup:
💎#SNX is currently trading around $0.418 on the 4H timeframe and remains stuck inside a clearly defined descending channel, respecting both the descending resistance and descending support with high precision. This type of structure tells us one thing very clearly: the market is compressing, and a decisive move is getting closer.
💎Price is now sitting just above a key demand zone around $0.38–$0.39, where buyers have already shown interest multiple times. This zone is crucial. As long as #SNXUSD holds above it, bulls still have a chance to regain control. The chart also highlights that a clean breakout above the descending resistance, combined with a reclaim of the 50 EMA as support, would significantly increase the probability of a bullish continuation.
💎If that bullish scenario plays out, the first upside target sits at the moderate resistance near $0.51, followed by a much more important strong resistance around $0.60–$0.61. A move toward those levels would likely happen fast, as many traders are currently positioned defensively and would be forced to react to a breakout.
💎However, this setup comes with a very clear invalidation. If price loses the $0.38 support zone decisively, the bullish idea is off the table. A breakdown below this level would confirm weakness and open the door for a deeper move toward the $0.33 support zone, where the next significant liquidity sits. That scenario would likely come with increased volatility and emotional selling from inexperienced traders.
Trade smart, Paradisers. This setup will reward only the disciplined.
MyCryptoParadise
iFeel the success🌴
