ETHEREUM: Crucial Formation, Important Levels to Watch!Hello There,
on the short-term perspective Ethereum is forming crucial bearish pressure which could be decisive within the near future. While Ethereum remains the second largest cryptocurrency, it is recently forming crucial formations that should not be underestimated. In the past weeks, trading actions already showed major selling pressure occurred from whales dropping their ETH on the market. Now, there is an important formation forming, which could be the setup of a determined continuation. Especially when the levels confirm this will likely lead to an exaggerated price move.
When looking at the chart, we can see Ethereum is now trading within this major downtrend channel in which it already formed major bearish pressure. Furthermore, it formed a bearish EMA crossover to the downside, confirming the bearish trend. The several lower lows of the bearish trend mark the significance of this condition. Now, within the past few days, Ethereum set up to form a bear flag formation within the downtrend.
Within this bear flag formation, Ethereum already completed the initial waves A and B of the inner bear flag formation. Now with wave C, Ethereum is likely to move into the upper resistance zones. There is a major resistance zone within the upper boundaries of the channels. Several resistances come together, such as the upper boundary of the descending channel, the upper boundary of the bear flag, and the horizontal resistance line.
With a bounce into this area, which should be expected within the next times, Ethereum is entering a really crucial zone from where a pullback is highly likely. Especially when more and more whales enter the market and short sell, a pullback from this area will be an origin for bearish pressure towards the downside. The whole bear flag formation will be confirmed with a breakout below the lower boundary of the flag formation.
Once this formation has been completed, the targets as seen in my chart will be activated. From there on, a bearish continuation could also be likely if Ethereum does not manage to reverse in this area. In any case, this will be a highly important area to watch out for. Currently, it is important to consider the next phases of development and how Ethereum reacts to the resistance zones. The bearish price pressure should not be underestimated in any case.
With this being said, it is great to consider the important trades upcoming.
We will watch out for the main market evolutions.
Thank you very much for watching!
Cryptotrading

PUMP/USDT: Memecoin at Critical Resistance – Doji Pattern Signal🚀 PUMP-USDT is back in the spotlight — and it’s hitting something big:
✅ 5-MONTH RESISTANCE (since Sept 2025)
✅ DOJI Pattern forming at key resistance level — a true battleground of sentiment
✅ The overall trend is falling since beginning
📊 What’s a DOJI?
A Doji is that neutral, indecisive moment on the chart where bulls and bears are locked in a stalemate.
- No clear momentum.
- Sentiment is split — bullish hopes vs bearish caution.
- The market is “thinking”… waiting for a trigger.
💥 This is EXACTLY what we see now:
A Memecoin with wild energy
Trapped at its strongest resistance since launch
And now, a Doji / Spinning Top forming right at the top
⚠️ That’s not a signal to go long. That’s a warning sign.
When a memecoin hits multi-month resistance and forms a DOJI?
→ Bull retracement is exhausted.
→ Bear pressure is building.
🎯 Our call: SHORT PUMP-USDT
Wait for confirmation — a rejection candle or volume spike down — then enter.
This isn’t FOMO. It’s smart timing.
💬 What’s your take?
Are you riding the wave… or preparing for the drop?
👇 Drop your view below — let’s see who’s thinking ahead!

CELO at a Key Inflection Point | Price OutlookELO has been consolidating since mid-December after a steep 62% decline from November’s highs.
📅 Thursday’s upcoming event could be the catalyst to break this range.
🔼 Bullish Scenario:
Breakout above $0.1318 could target resistance near $0.1401, within December 15’s bearish weekly void.
Further upside may stall at $0.1438–$0.1463, overlapping multiple voids and October’s swing low.
🔽 Bearish Scenario:
First support sits at $0.1227 (Jan 3 daily void), with confluence from:
$0.1215 (Dec 30 rejection),
$0.1197 (Dec 22 weekly rejection), and
$0.1089 (Jan 1 swing low).
These are key zones where accumulation and stop defense may be active.

ENA – Daily UpdateFrom the higher timeframe, ENA is still trading within a broader bearish structure.
The recent bounce is a reaction from support, not a confirmed trend reversal yet.
On the Daily, price is still respecting the descending trendline.
At this moment, there is no valid long trigger.
What I want to see next:
Price needs to print a high and then reclaim the key resistance level, turning it into support.
That R/S flip is required to confirm a potential structure shift.
Until that reclaim happens, this remains a patience trade.
No reclaim, no confirmation = no trade.
Let price do the work first.
Are you waiting for the reclaim or staying sidelined for now?
MrC

BANANA GUN – Daily UpdateFrom the weekly perspective, price is still in a broader bearish structure.
The recent move is only a reaction after a prolonged downtrend — not a confirmed reversal yet.
On the Daily, price has broken the descending trendline, which is a first sign of potential change.
However, at this stage there is still no valid long trigger.
What I want to see next:
Price needs to print a higher high and then come back for a proper resistance → support flip.
Only after that reclaim would the structure shift be confirmed.
Until that happens, this remains a wait-and-see scenario.
No confirmation = no trade.
Patience first.
Let price prove itself before committing risk.
Are you waiting for the reclaim or already anticipating the move?
MrC

BONK – Daily UpdateAfter a long downtrend, price finally broke the descending trendline with a strong impulsive move.
This impulsive candle also created a Daily FVG, showing clear imbalance to the upside.
At the moment, price is extended.
I’m not chasing this pump.
My plan is simple:
I’m waiting for a pullback into the 0.5 Fibonacci level, which aligns perfectly with the Daily FVG.
That zone is my area of interest.
If price retraces into that area, I’ll drop to the lower timeframes and wait for a clean long trigger.
No pullback, no confirmation = no trade.
Don’t chase the pump.
Let the price come to you.
Are you waiting for the retrace or already looking for entries?
MrC

LPTUSDT About to Break Out or Break Down? Yello Paradisers! Have you been watching LPT sink deeper into the descending channel and wondering if it’s finally time for a reversal or if another trap is about to wipe out impatient traders again? This setup is shaping up to be one of those textbook opportunities where discipline will separate winners from losers.
💎#LPTUSDT has been moving inside a clear descending channel, with price action consistently printing lower lows and respecting both resistance and support lines. However, it has now reached a major inflection point. The asset is sitting right on a strong support zone, a level that has previously attracted demand and triggered significant reactions in the past. What makes this setup even more intriguing is the convergence of technical signals that could be indicating a short-term bullish reversal.
💎On the momentum side, the MACD is flashing a bullish crossover, and we’re also spotting a bullish divergence between the price and momentum. This is often one of the earliest signs of trend exhaustion in a downtrend. These signals become even more meaningful when combined with the current price position within the descending channel structure. If the support holds, and the divergence plays out, we could see a strong rally first into the minor resistance area near $3.00 and potentially into the major resistance zone above $3.10.
💎However, the invalidation level is clearly defined at $2.782. If the price is accepted below this level, the setup is no longer valid, and the idea must be abandoned immediately.
The market is full of noise, and fake breakouts are designed to punish the emotional and reward the disciplined. Be the latter. Stay sharp, Paradisers.
MyCryptoParadise
iFeel the success🌴

SOLANA: This Gigantic Formation is Going to Blast Through Roof.Hello There,
welcome to my new analysis about SOLANA on the weekly timeframe perspective. As a believer in the cryptocurrency revolution, I am sure the adoption of large-scale crypto networks is going to spread continuously throughout this year. We can already see more and more financial intermediaries adopting cryptocurrencies like SOLANA. This is also reflected by the SOLUSD price and crucial adoption factors such as Western Union also adopting this network. In my analysis I focus on the underlying factors that drive these changes in the financial ecosystem.
Especially at the beginning of 2026, there was a record high of whales accumulating more and more SOLANA to prepare for the major market disruptions that are likely to happen. Such actions are always made before the big public gets aware of it. Therefore, it is highly important, as a trader in the market, to appropriately prepare for any such significant and influential developments. Currently, SOLANA is already within the top 10 of cryptocurrency market cap coins. This can quickly change when more and more whales move into this market to push the bullish buttons before the large public gets aware of it.
The whitepaper already states that SOLANA is a high-performance blockchain that was designed to process up to 710,000 transactions per second, though real-world throughput typically ranges from 2,000 to 3,000 TPS. It is not unlikely that under such conditions more and more adoptions from smart money will happen in the next times. These factors are crucial for examining the actual real price action outcomes setting up for SOLANA at this moment. If this adoption goes forward in the upcoming times, we will see other whales also moving into the coin.
From a technical perspective, SOLANA is trading within this gigantic uptrend situation in which it is forming several crucial technical formations. The most important one currently is this massive bull flag formation. This formation is already in the middle to later stages of completion. The wave count within the formation is already forming the final wave C. This completion of the wave count will reach strong supports within the bullish confluence zone marked in my chart, supported by the lower boundary supports as well as the 200-MA.
Once SOLANA bounces in this area, it will be a highly determining move and crucial for the whole upcoming prospect, which should be expected. Especially when there are a lot of bullish acquisitions and the large wallets moving into the market, we can be sure that a bounce from this zone will likely confirm the whole bull flag formation. Such a confirmation will drive the price action into spheres never seen before. When considering an altcoin-focused approach in the market, this will definitely be an important underlying setup to consider.
With this being said, it is great to consider the important trades upcoming.
We will watch out for the main market evolutions.
Thank you very much for watching!

XRPUSDT – Trade ideaXRP has printed a market structure shift (MSS) and is consolidating above key support.
Price is currently pulling back into a local demand zone after a rejection from range highs.
Bias
As long as price holds above demand, a bounce and continuation higher remains likely.
This area offers a clean high RR long opportunity if buyers step in.
Invalidation
Acceptance below demand invalidates the bullish setup.
Let price do the work.

FETUSDT – Trade ideaFET has shown a local market structure shift (MSS) and is currently pulling back into a key demand zone.
This setup aligns with a TOTAL Market Cap MSS on the 4H, supporting a broader bullish continuation scenario.
Bias
As long as price holds above demand, a bounce and continuation higher is favored.
Confluence with TOTAL MC MSS (4H) increases the probability of this move.
Invalidation
Acceptance below demand invalidates the bullish setup.
Are you waiting for reaction at demand or already positioned? 📊👀
MrC

SUIUSDT – Trade ideaSUI is trading inside a broader downtrend but is currently reacting from a key demand area with multiple FVGs below.
Price already tapped the upper imbalance and may sweep lower liquidity before continuation.
Positioning
Already in the trade.
Looking to add more on deeper pullbacks into the lower FVG, aiming for a higher time-frame mean reversion move.
Bias
As long as price holds above invalidation, this remains a pullback-to-imbalance long setup.
Patience is key — let price fill the imbalance.
MrC

SOLUSDT 4hr – Trade idea Price is currently trading inside a range after a strong impulsive move down.
We are seeing multiple fair value gaps below and above, indicating unfinished business on both sides.
Context
Overall structure remains bearish
Price is consolidating near local support
Liquidity has been swept to the downside
Bullish idea
If price holds this support and reclaims the local fair value gap, a move towards the higher timeframe imbalance becomes likely.
Bearish idea
Failure to hold this area could lead to a continuation into the lower fair value gap, completing the downside move.
Are you expecting a range expansion up or further downside first?
MrC

GNO mid-term TAGnosis is having positive accumulation for mid-tern bullish run, as of now long-term is still in bearish area which keeps the risk higher so you need to be cautious but positive formation on mid-term may reduce the risk and continue bullish formation. Current long-term pivot for the resistance is around $150ish area, the top of this channel has to be broken and hold as a support for the uptrend continuation in the future.

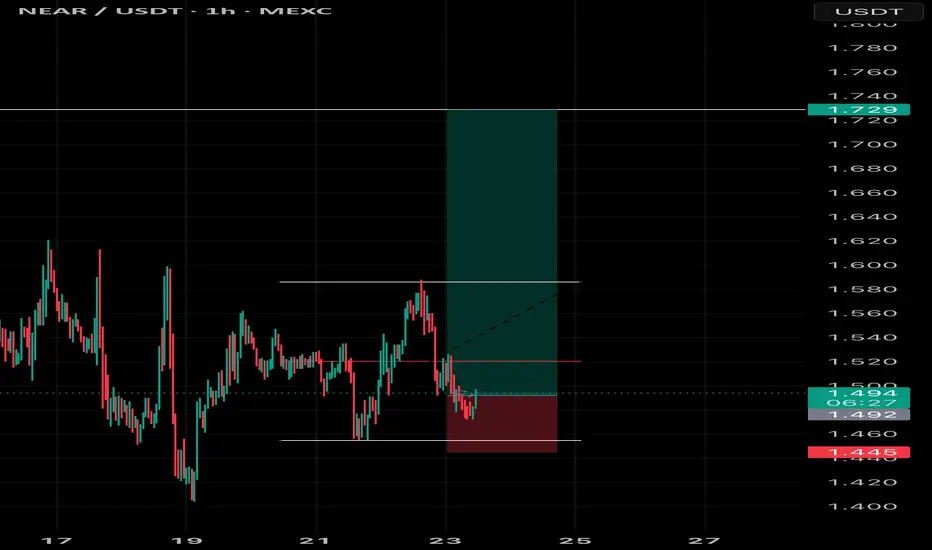
NEAR / USDT – Long IdeaPrice has retraced ~50% after a 4H MSS, which often acts as a premium entry zone.
On the 15M we now see a fresh MSS, confirming short-term bullish structure.
Key levels
• Entry: current / slight pullback
• Invalidation: below local low
• Target: previous highs & liquidity above
Why this setup
• HTF (4H) MSS → bias bullish
• 50% retracement → optimal entry area
• LTF (15M) MSS → confirmation
• Risk/Reward is very favorable
As long as price holds above the 15M structure low, upside continuation is expected.
What do you think — continuation toward highs or more consolidation first?

Happy New Year XRP: These Events Set Up Major Moves for 2026.Hello There,
welcome to my new analysis about XRP. In recent times a very important dynamic with XRP caught my attention. Throughout 2025, major events happened that are setting up an important foundation for XRP and the upcoming year. These events are building major cornerstones that will have an enormous effect on the price action. From a fundamental and technical perspective, XRP is about to write an epic future.
When looking at my chart, you can watch this gigantic uptrend channel in which XRP has already several times bounced within the bullish accumulation zone marked in green. This zone was also the origin of XRP shooting to the moon in October 2024, marking the all-time high of $3.66. This major breakout was already part of the completion of this gigantic bullish triangle formation. Such a formation already completed once for XRP, being the origin of the historical upthrust.
While the MA structure is holding this whole trend to the upside, there are also key fundamental signs that reveal an underlying bullishness for XRP. One of them is that XRP just ended its year-long battle against the SEC. This makes way for a financial framework that does not ignore the positive prospects cryptocurrencies like XRP bring to the monetary market. The winning of this case makes XRP much more attractive for further investments and volume into the market.
Also, the launch of the XRP ETF on the 18th of September 2025 at CME has pumped massive volume into the market. In some minutes, millions and millions of dollars were pumped into the XRP network. The key element of an ETF, which makes XRP a much better investment for institutions, is a major milestone. Such an ETF event could be the beginning of historical price moves never seen before, similarly to what has been seen with other cryptocurrencies.
Technically speaking, XRP is now just about to confirm this gigantic triangle formation. An important factor here is the bounce from the upper boundary of the triangle. As seen in my chart, such a price move is supported by the moving averages, the lower boundary of the gigantic uptrend channel, and also the lower boundary of the triangle formation. This level is extremely important to hold; however, currently there are no signs of invalidation.
It will be an interesting journey ahead. And it will be particularly important to consider how XRP reacts to the main zones of support. In any case, it will be compelling to watch how these major levels will be approached.
Thank you very much for watching.

BTCUSD Breakout From Range Bulls Taking ControlBitcoin (BTCUSD) has broken out of a prolonged consolidation zone, confirming a bullish structure shift. Strong momentum and clean candles show buyers stepping in after multiple rejections from the range low. As long as price holds above the breakout area, the upside target zone remains active, with continuation toward higher liquidity levels.
Watch for healthy pullbacks for continuation entries — trend favors the bulls.
Risk Management:
✔️ Invalidation below range support
✔️ Trade with confirmation & proper position sizing

QNT 1hr long idea QNT is currently on my active long watchlist, together with other longs I shared earlier.
Price printed a Market Structure Shift (MSS) After the MSS, we now see a healthy retracement back into a key support area.
As long as price holds above support, this zone offers a clean risk-to-reward long setup with upside toward previous highs
Not financial advice. Always manage risk.
👉 Do you think QNT will continue this bullish move, or do you expect a deeper retrace first?

BITCOIN: Major Wyckoff Distribution Ongoing, Look for the Signs.Hello There,
the bitcoin price in the recent weeks has been very volatile, increasing crucial bearish price actions. Following these dynamics, I have spotted important signs that reveal in what state the bitcoin price currently is. These signs are important hints on where the price action is likely to move within the upcoming times. Also fundamentally, these dynamics are supported by major events and underlying market sentiments.
When analyzing the bitcoin dynamic, I am also looking at historical developments and how the price action moved. Therefore, a smart trader can spot these patterns over time and position oneself appropriately in the market. Connecting the dots to the current state of the market, I have spotted a crucial underlying pattern, which is called Wyckoff distribution. This type of pattern is an almost sure sign that the market is undergoing a trend-changing bearish reversal.
Considering the volatile price action here, bitcoin just dumped massively since testing the $123,000 level. From there on, massive bearish developments pushed the price below the $85,000 mark. This is also an important sentiment for the market. Because below the $100,000 price level is now a huge resistance. With round numbers always being massive resistance levels.
This crucial resistance of $100,000 was also confirmed since the Preliminary Supply (PSY) and Buying Climax (BC) the bitcoin price formed earlier. As this resistance was confirmed several times, there is a high likelihood that it will hold in the near future as well. With further inflection points such as the major descending resistance, the major upper resistance angle is formed.
As Wyckoff distributions move in several stages till a much more pronounced bearish move pushes the price far below established supports, bitcoin is already in the later stages of this distribution cycle. With rising short open interest, this will give fuel to unfold a main bearish price action towards lower levels. The Wyckoff distribution for Bitcoin consists of the following completed, ongoing, and upcoming parts/phases.
Phase A:
The bitcoin prior uptrend has stopped, which was a hint towards a reversal likely to happen.
Preliminary Supply (PSY): First evidence of supply entered the market with bitcoin short volume increasing.
Buying Climax (BC): An abnormal move into bullish spheres, which can’t go on forever, signals that the trend is likely to reverse.
Secondary Test (ST): This is very crucial for Bitcoin in this dynamic, as Bitcoin did not establish substantially higher highs; the price was rejected from the local levels. Marking the phase B in the distribution with clear signs of weak hands pushed out of the market.
Phase B
UT in Phase B: The upthrust above previous resistance levels marks a last try for Bitcoin to form significant higher highs. This did not happen, and Bitcoin pulled back again into the range. It is the most critical bearish sign here.
Phase C
In the next phase, C, several Last Points of Supply (LPSY) will be expected. We see a lot of bearish pressure in the market as whales throw their bitcoin into the market. Bearish volume increases. Short increases. All these bearish signs support the last points of supply. A final push below the support is determined by a Sign of Weakness (SOW), which shows that the market is likely to continue in the bearish direction.
In any case, the bearishness of this whole constellation should not be underestimated. As it is unlikely that this level holds and Bitcoin has the ability to continue to form new highs, a major bear market is likely to enter. Once the Wyckoff distribution pattern is completed, the bear market will unfold in its full determination.
Therefore, thank you very much for watching.

Key Breakout Setup: #ZEC Eyes $475-$530 RallyIn this technical analysis, I break down the current price action using a multi-timeframe approach. Starting with the 4-hour chart, I then zoom out to capture the broader market structure and identify how price recently broke above local highs before pulling back to retest that level as new support—a classic bullish confirmation pattern.
Zooming back in, I outline the critical $400 level that's keeping the near-term outlook bullish. As long as price holds above this support, we're positioned for a potential breakout toward the $475 target area, which could then open the door to the $530s.
I also cover downside risk management, including the key levels to watch that would signal weakness and potentially trigger a move to new lows. Whether you're looking for entry opportunities or managing existing positions, this video provides the technical levels you need to navigate the current setup.

ETHUSDT – A Bullish Trend Is Starting to Re-emergeETHUSDT is entering a recovery phase as market sentiment gradually stabilizes after the previous corrective move. Recent news shows no new negative pressure, while speculative capital is beginning to rotate back into major altcoins as Bitcoin and gold hold firm at elevated levels. This environment creates favorable conditions for ETH to regain bullish momentum in the short term.
On the H4 chart, the price structure indicates that ETH is closely respecting an ascending trendline, consistently forming higher lows. The area around 2,920 is acting as a key support zone, where price has reacted positively multiple times. Holding above the Ichimoku cloud and maintaining the trendline suggest that selling pressure is fading, with buyers gradually reclaiming control.
In the near term, ETH is likely to consolidate above the 2,920 level before extending higher toward the 3,070 region. Any pullbacks that occur should be viewed as technical corrections within a newly forming uptrend, as long as the main support zone remains intact.

BTCUSD Below a Downtrend Line: Don’t Rush to Trust the BounceBTCUSD is still trading in a bearish-leaning environment , as neither the news backdrop nor the technical structure supports a clear bullish reversal yet. Profit-taking from large players, combined with cautious year-end sentiment, means recent Bitcoin rebounds are more technical in nature rather than the start of a new uptrend. In a thin-liquidity environment, the market tends to favor selling rallies instead of chasing higher prices.
On the chart, price remains below the descending trendline and capped by the Ichimoku cloud, confirming that sellers continue to control the primary trend. Upside attempts have been shallow and quickly sold into, reflecting a lack of conviction from buyers. The 89,500 area stands out as a key resistance zone, where price has tested multiple times without a decisive breakout.
In the short term, the most reasonable scenario is for BTC to rebound into resistance and then weaken, before revisiting support around 86,800. A clean break below this level could open the door for further downside extension. Conversely, only a strong breakout and sustained hold above 89,500–90,000 would truly invalidate the current bearish structure.

BTCUSD at Trendline Resistance – Breakout or Rejection?BTCUSD (BTCUSDT Perpetual) – 30-Minute Structure Breakdown & Decision Zone
Technical and Fundamental Analysis
Bitcoin is currently trading in a short-term corrective phase after printing a local high near the 90K region. The recent price action shows a clear shift from impulsive bullish movement into controlled bearish structure, characterized by lower highs and lower lows.
The chart highlights a descending trendline, which is acting as dynamic resistance, consistently rejecting price on each retest.
Trendline S/R Interchange (Key Concept)
One of the most important elements on this chart is the Trendline Support–Resistance Interchange:
Previous bullish support has now flipped into resistance.
Each pullback into the descending trendline attracts sellers.
This behavior confirms trend continuation pressure unless structure breaks.
This is a classic sign of market acceptance below resistance.
Mini Reversal Zone – Demand Reaction
Price recently dipped into a Mini Reversal Zone, marked by:
A previous demand imbalance
Strong reaction candles
Short-term liquidity sweep
The bounce from this area is technical, not impulsive — meaning it is likely a pullback, not a trend reversal yet.
Current Price Location – Decision Point
Bitcoin is now trading exactly at a key decision area, where:
Descending trendline resistance
Minor horizontal level
Short-term bullish pullback
all converge.
This zone determines the next directional move.
➡️ Market is neutral here — no blind entries.
Projected Scenarios
Scenario 1 – Structure Hold (Sell Setup – Higher Probability)
Price rejects from the trendline
Bearish candle confirmation appears
Continuation toward lower support zones
Sellers remain in control
Scenario 2 – Structure Break (Buy Setup – Conditional)
Strong 30m candle closes above the trendline
Follow-through volume confirms acceptance
Retest holds as support
Upside continuation toward higher resistance
As marked on the chart:
“If this structure follows → Buy | If rejection → Sell”
Volume & Momentum Insight
No aggressive bullish volume is present yet
Momentum remains corrective
Buyers must prove strength with structure break + hold
Without confirmation, upside moves are vulnerable to rejection.
Trading Mindset & Risk Management
This is a reaction-based trade environment, not a prediction zone.
Let price confirm direction
Avoid emotional entries at trendline
Wait for either rejection confirmation or clean breakout & retest
Professional traders trade confirmation, not hope.
Conclusion
BTC is at a critical technical junction. The trendline defines control. Until price decisively breaks and holds above it, the bearish bias remains intact. Smart traders will wait for the market to choose a side before committing capital.

NEAR / USDT – 1HNEAR / USDT – 1H
Bullish context remains intact.
On Total Market Cap we saw a clear 4H MSS close, followed by a clean 50% retrace.
NEAR is showing the same structure and reaction.
Price is currently reacting from the 50% retracement / discount zone, with support holding.
As long as this level holds, bias stays bullish
This looks like a continuation setup in line with HTF market structure.
What do you expect next: a small liquidity sweep below support or direct continuation to the upside? 📈