FIL | Swing Trade Setup from Key Support ZoneFilecoin (FIL) is hovering near a major support zone between $2.47 and $2.55, offering a high-probability swing trade opportunity. The recent pullback has brought price action into a known demand area, and while momentum has cooled off, the broader market structure remains bullish. If the level holds, FIL could rebound toward multiple resistance targets in the coming sessions.
🔹 Trade Setup
• Entry Zone: $2.47 – $2.55
• Take Profit Targets:
🥇 $2.67 – $2.80
🥈 $3.00
• Stop Loss: Daily candle close below $2.36
#FIL #Filecoin #CryptoTrading #SwingTrade #SupportAndResistance #Altcoins #TradingSetup #TechnicalAnalysis #CryptoIdeas
Cryptotrading

Ethereum Triangle Breakout Trap – Bear Market FocusEthereum (ETHUSD) has formed a symmetrical triangle pattern, but an early breakout has already taken place before the structure was fully completed. Historically, such premature breakouts during the end phase of a crypto cycle often hint towards a bearish trend continuation.
Looking at past bear market cycles, there is a possibility that Ethereum could enter a deeper corrective phase in 2026, aligning with historical crypto market patterns. The key support zones to watch remain at $3000, $2300, and $1800, which could act as major levels in the upcoming months.
On the upside, Ethereum faces strong resistance between $4700 and $4900, where short setups become more favorable. For risk management, a stop loss above $5200 is recommended. Long positions have already been closed, and the focus now shifts towards short opportunities at resistance zones.
📌 This setup provides a clear risk-reward strategy for traders who are closely monitoring ETH price action in relation to cycle completion and historical bear market patterns.
👉 Follow me on TradingView for more crypto market insights, technical analysis, and trading updates. Share your thoughts in the comments – your feedback helps shape future analysis!

Solana Price Forecast | SOLUSDT Market OutlookSOLUSDT has completed a strong upward cycle and is now unwinding through a structured retracement. This phase is not showing disorderly selling but rather a controlled reset, where liquidity is being cleared to prepare for the next expansion.
The chart reflects a market that is cycling through accumulation, breakout, and pullback phases with consistency. Current downside movement is shaping a foundation zone that could serve as the springboard for renewed upward momentum.
Overall, the asset is displaying a constructive trajectory: corrections are functioning as fuel rather than weakness, pointing toward continuation of its broader growth path once this reset stabilizes.

ETHEREUM (ETHUSD): Bullish Trend Continues
I see a nice bullish confirmation on Ethereum after a recent pullback.
The price formed a double bottom pattern and violated its neckline
and a resistance line of a falling wedge pattern.
With a high probability, the market will go up.
Goal - 4741
❤️Please, support my work with like, thank you!❤️
I am part of Trade Nation's Influencer program and receive a monthly fee for using their TradingView charts in my analysis.

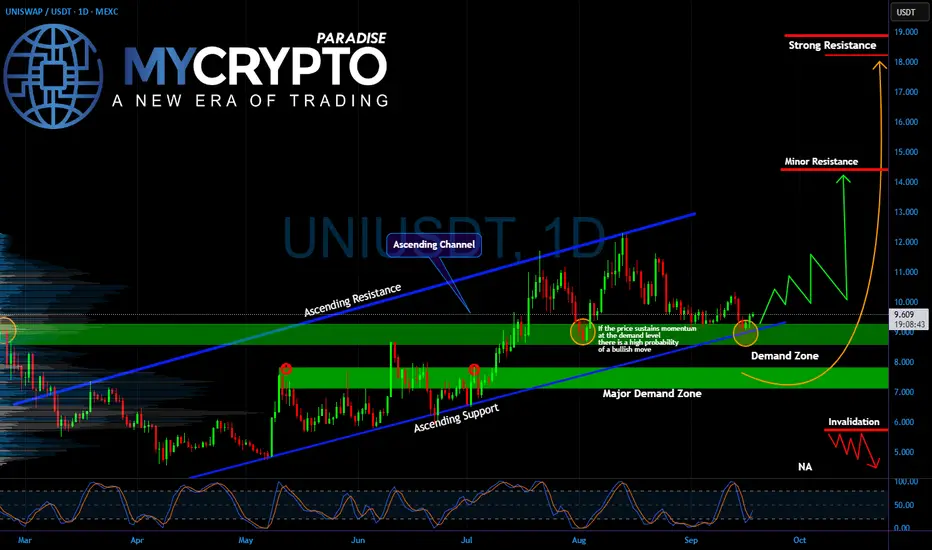
UNIUSDT About to Explode or Break Traders’ Dreams?Yello Paradisers, is #UNIUSDT quietly preparing for its next major rally, or are we sitting right on the edge of a painful trap for impatient traders? Let’s break it down.
💎#UNI has been holding within its ascending channel, bouncing consistently from its demand zone around $9–$9.50. Every retest of this area has brought buyers back into the game, showing strong defense by bulls. Right below, the major demand zone at $7–$8 remains the key level where long-term buyers are waiting, meaning this area acts as a foundation for continuation.
💎On the upside, if #UNI holds current structure and builds momentum, the first challenge is the minor resistance near $14. Breaking through this opens the door toward the strong resistance zone at $18–$19, where profit-taking will likely be aggressive.
💎However, there’s no free ride. A failure to hold the current demand zone could trigger a drop into the $7–$8 major demand area. If that level also gives up, the structure is invalidated, and UNI could revisit much deeper lows around $5–$6, wiping out weak hands before any real recovery.
💎Right now, #UNI is at a pivotal point: defend support and aim for $14–$18, or lose footing and fall into heavy liquidation territory.
Strive for consistency, wait for clear confirmations, and remember that discipline always beats chasing quick profits.
MyCryptoParadise
iFeel the success🌴
Rate Cuts, Liquidity, and BTC: Why 120K Is the Danger ZoneYesterday , while everyone was screaming about a Bitcoin dump, we caught the breakout of that resistance I showed you.
Today, I want to talk about the upcoming rate cut news , what could happen after it, and what we should do with our open positions.
Now personally, I’m still holding the breakout position we entered a week ago . I didn’t secure any profits, and honestly—I didn’t even want to. Because if the Fed cuts rates, we could kick off the next leg of this uptrend.
But keep this in mind: opening fresh positions around 120K IS NOT EASY AT ALL. Why?
Because there’s massive liquidity up there, huge volatility, and the chances of getting stopped out are very high. That’s exactly why I’d rather hold my position from earlier than be forced to open new ones in that zone.
👉 Let’s look at yesterday’s daily candle: it closed super bullish. This shows the market is leaning positive on the idea of a rate cut. But is this candle just front-running the news? Hard to say. We can’t exactly go ask every trader if they bought because of the Fed. So, better not overthink it.
I personally expect a short-term dip after the news drops. But more important than the cut itself are Powell’s words. If he signals more cuts are coming, markets could explode higher. If he says “not anytime soon,” we might get a pullback.
⚠️ My advice:
If you don’t already have a position, stay on the sidelines for a few hours. Any stop loss you put now has a big chance of getting hit.
But if, like me, you’re already in from the earlier triggers, just hold. It’s worth it.
For me, I’m also long on GBP/USD, and I didn’t secure profits there either—I’m waiting to see how it reacts.
👉 Quick look at BTC.D: dominance is rising with Bitcoin, which means it’s smarter to keep focus on BTC rather than altcoins. When dominance turns bearish again, that’s when we’ll shift back to alts.
This is why for the past few days I’ve been saying: stick with Bitcoin. Liquidity is flowing into it.
Ethereum? It gave back almost 70% of its recent move.
LONG STORY SHORT: don’t do anything stupid here. The best play, if you don’t have an open position, is to stay patient. Don’t FOMO.
Remember: the most important thing is not Bitcoin’s price itself. It’s stop-loss size, liquidity zones, and momentum. here in Skeptic Lab, that’s exactly what we dig into.
I’ll try to post another update after the Fed news drops.
Until then, stay safe. Peace ✌️

#XRP is Approaching a Breakout | Will It Hold or Collapse? Yello, Paradisers! Is #XRP about to confirm a real breakout from months of sideways pain, or is this just another trap? Let’s dissect what’s happening with precision so you’re prepared either way:
💎After weeks of compression beneath a well-defined descending resistance, #XRPUSDT is about to break out. The breakout above this key trendline is now increasing the probability of a bullish continuation, especially with the 50EMA acting as dynamic support and reinforcing the bullish pressure.
💎Currently, the price is trading around $3.00, right above the breakout zone. If the market successfully retests this descending resistance as new support and holds, this would signal strong momentum building up for the next impulsive leg.
💎If that happens, the first upside target is the moderate resistance level at $3.66. A confirmed break above that could send #XRPUSD toward the strong resistance near $4.17, which aligns with the upper boundary of the visible volume profile.
💎On the flip side, the support zone between $2.69 and $2.48 now becomes critical. A retracement into this area could provide a high-probability bounce, but any breakdown and daily close below $2.4849 would invalidate the current bullish setup. In that case, price could unwind sharply, as the bullish structure would be broken, and sellers could regain control.
Stay patient, Paradisers. Let the breakout confirm, and only then do we strike with conviction.
MyCryptoParadise
iFeel the success🌴

BTC Price Action: Bulls vs BearsBitcoin has shown a gradual recovery after a prolonged corrective phase, with market structure leaning toward a constructive buildup. Fundamentally, sentiment is influenced by global macro conditions—investors are watching U.S. monetary policy signals, while stable demand from institutions and long-term holders continues to provide a supportive backdrop. On-chain activity remains steady, with balanced exchange inflows and outflows suggesting no extreme directional pressure in the near term.
From a technical perspective, the market has shifted momentum from bearish flows into a developing bullish sequence. The recent break of structure on the 4H timeframe highlights strengthening upside intent, though price is still moving within a broader accumulation phase. Current flows suggest the possibility of a short-term dip for liquidity before continuation to higher levels, aligning with the overall constructive weekly outlook.

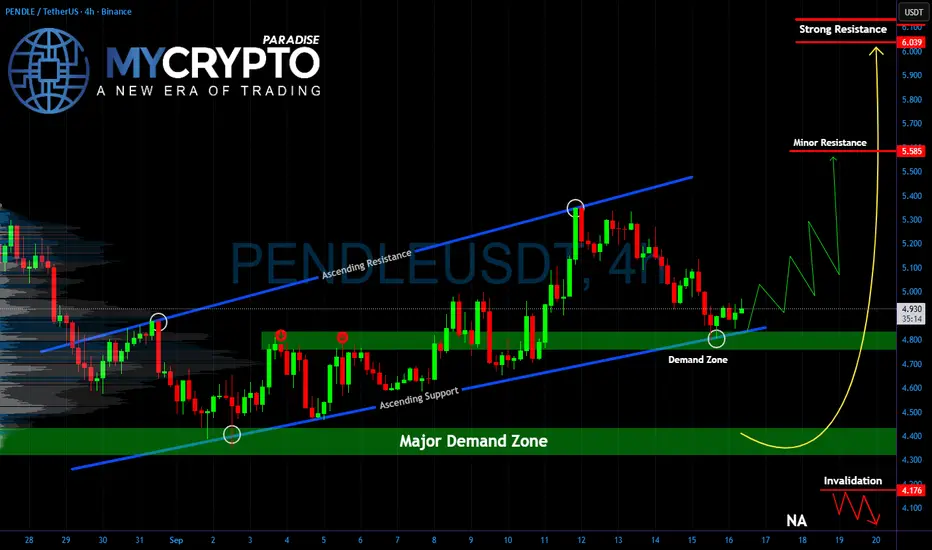
PENDLE At Critical Turning Point Before Explosive MoveYello Paradisers, can #PENDLEUSDT hold the line here, or is a painful flush waiting around the corner? After the recent selloff, the price has landed right inside a demand zone that previously triggered strong recoveries. This is the level where buyers need to step up, or the structure risks collapsing toward the deeper major demand area below.
💎Currently, #PENDLE is bouncing from the ascending support trendline after retesting it, showing early signs of strength. If momentum continues, the first big obstacle lies at the 5.58 minor resistance. A clean breakout above that level could open the way toward the strong resistance zone around 6.03–6.13, which has historically been a heavy supply area. That’s where aggressive profit-taking is likely to appear again.
💎On the downside, the invalidation level remains clear at 4.17. A close below this mark would signal that demand has completely failed, and it could invite deeper liquidation, dragging the price back into the major demand zone around 4.20–4.40. Until then, the bullish structure remains intact, but the next moves will be decisive.
🎖Strive for consistency, not quick profits. Treat the market as a businessman, not as a gambler. The next breakout or breakdown will shake out weak hands, but only disciplined traders will stay on the right side of the move.
MyCryptoParadise
iFeel the success🌴
Bitcoin to 105K? Stop Talking Sh*t, Here’s the TruthEveryone’s screaming about a Bitcoin dump … but where’s the proof? 🤔
In this video, I break down the weekly, daily, 4H, and even 15m to show you the real triggers that matter for Bitcoin’s next move. Spoiler: the big picture is still bullish AF.
We’ll also look at Wednesday’s Fed rate decision and how it could shake the market.
Stay skeptical. Don’t FOMO. Manage risk.
Boost if it helped.
(P.S. Sorry for the voice — I’m fighting through a nasty cold :/)

SHIB Breakout Incoming or Another Trap?Yello Paradisers, have you noticed how #SHIBUSDT has been quietly coiling at its demand zone while retail traders are completely distracted elsewhere? What looks like silence right now could easily turn into a violent move, and the next few candles will decide everything.
💎Price has been stuck inside a descending channel, repeatedly testing both support and resistance levels. Most recently, we’ve seen a classic double bottom formation at the demand zone, a structure that often signals the beginning of a larger bullish reversal if momentum follows through. As long as SHIB holds above this critical green zone, bulls have the upper hand.
💎The first confirmation would come with a clean breakout above the descending resistance, opening the road toward the minor resistance around $0.00001345. But the real target that could bring back FOMO is the resistance zone between $0.00001428 – $0.00001445. This area is packed with liquidity, and if taken out with strength, SHIB could trigger a sharp rally that leaves latecomers chasing.
💎On the flip side, the risk remains clear: if a daily close slips below the major demand zone, the bullish scenario gets invalidated, and SHIB could tumble toward fresh lows inside the channel. This is where inexperienced traders usually get trapped, overleveraged, and liquidated, while disciplined players quietly wait for the highest probability setups.
Stick to your plan, manage your risk, and don’t let emotions guide your entries. The market is designed to shake out the weak before rewarding the patient and prepared.
MyCryptoParadise
iFeel the success🌴

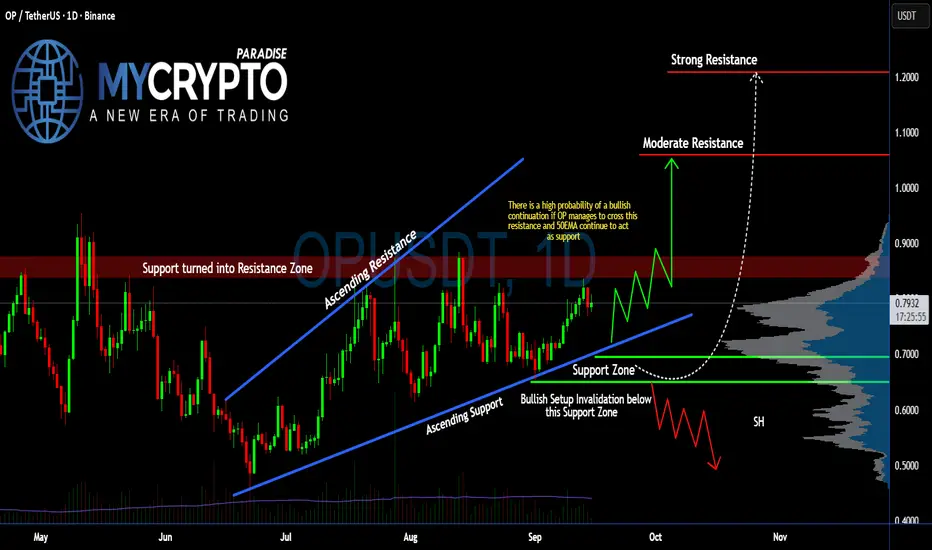
Will #OP Finally Explode or Is This Just Another Trap for Bulls?Yello, Paradisers! Is #Optimism gearing up for a breakout, or is this the final squeeze before bulls get dumped on hard? Let’s dissect what’s really happening on #OPUSDT:
💎After forming a clean ascending channel since mid-June, #OP has been respecting both the ascending support and ascending resistance zones. Price is currently sitting just below the key resistance zone around $0.83–$0.85, which was previously a support level before flipping into strong resistance. This makes it a major decision point for the next move.
💎If #OPUSD manages to break and close above the $0.85 resistance area with strong volume, and the 50EMA continues to hold as dynamic support, then we’re likely to see a push towards the moderate resistance around $1.059. If that level is cleared, the next logical upside target sits near $1.20, aligning with the strong resistance and peak on the volume profile.
💎As long as price holds above the Support Zone between $0.69 and $0.65, the bullish case remains valid. The structure continues to print higher lows, showing that buyers are defending the trendline support. A successful retest here could lead to a powerful bullish continuation.
💎However, if bulls lose control and #OPUSDT closes below the $0.650 support, the entire bullish setup would be invalidated. In that case, price could slide down toward the $0.50–$0.55 zone, especially if volume dries up. This would complete a potential head-and-shoulders pattern and trigger a shift toward a bearish structure.
Stay patient, Paradisers. Let the breakout confirm, and only then do we strike with conviction.
MyCryptoParadise
iFeel the success🌴
Ethereum at a Critical Resistance Zone – Will $4,800 Hold or Bre📝 Analysis:
Ethereum (ETH/USDT, 4H) is testing a critical resistance zone at $4,700–$4,800, where several technical factors converge:
1. Descending Channel:
Price is touching the upper boundary of the long-term descending channel.
2. Fibonacci Extension:
The recent rally has reached the 1.618 Fibonacci extension (~$4,720), which often acts as a potential reversal zone.
3. Resistance Cluster:
The $4,700–$4,800 area combines both static resistance and the channel top, making it a high-risk region for buyers.
4. Wave Structure:
The strong rally from ~$4,050 could be part of a corrective wave (possibly Wave D). If ETH fails here, we may see a sharp pullback.
⸻
📊 Scenarios:
🔸 Bearish Case (more likely):
Rejection from $4,720–$4,800 could trigger a correction toward:
• First support: $4,580–$4,600
• Key support: $4,100–$4,200
🔸 Bullish Case (conditional):
A daily close above $4,800 would confirm a breakout from the channel, opening the door for targets at:
• $4,950–$5,000
⸻
📌 Conclusion:
ETH is at a make-or-break level. Failure to hold above $4,800 could bring a strong correction, but a confirmed breakout may fuel a run toward $5,000.

IOTAUSDT: Will Bulls Break Free or Bears Take Full Control?Yello, Paradisers are you prepared for what could be the most decisive moment for #IOTAUSDT this quarter? Price action is tightening and the pressure is building, but only one side will win this battle. The question is: will it be the bulls or the bears?
💎For weeks, #IOTA has been respecting a broad symmetrical structure while staying firmly above the demand zone between $0.1700–$0.1800. Every dip into this area has attracted aggressive buyers, confirming it as a strong accumulation base. From here, price has been coiling tighter beneath the descending resistance trendline that has capped rallies since July.
💎Right now, #IOTA trades near $0.2000. A clean breakout above the trendline could unlock sharp momentum, with $0.2300 as the first resistance target and $0.2500 as the critical level that would confirm renewed bullish strength. Breaking these levels would shift sentiment decisively back into bullish territory.
💎But the warning signs are clear: if buyers fail to defend the current demand zone, sellers could drag the price back toward $0.1700–$0.1800. A breakdown below $0.1500 would give bears complete control, flipping the structure bearish and erasing months of accumulation.
💎From a fundamental perspective, #IOTAUSD continues to face a mixed outlook. While its technology is promising with use cases in IoT and feeless transactions, market adoption remains slow and competition in the smart contract and data-sharing space is intense. Current macroeconomic uncertainty and risk-off behavior in crypto also limit speculative inflows into smaller-cap projects like #IOTA. This means even technically bullish setups remain vulnerable to shifts in overall market sentiment.
The market is compressing, and the breakout is imminent. Timing and discipline will decide whether this move becomes a big win or a costly trap.
MyCryptoParadise
iFeel the success🌴

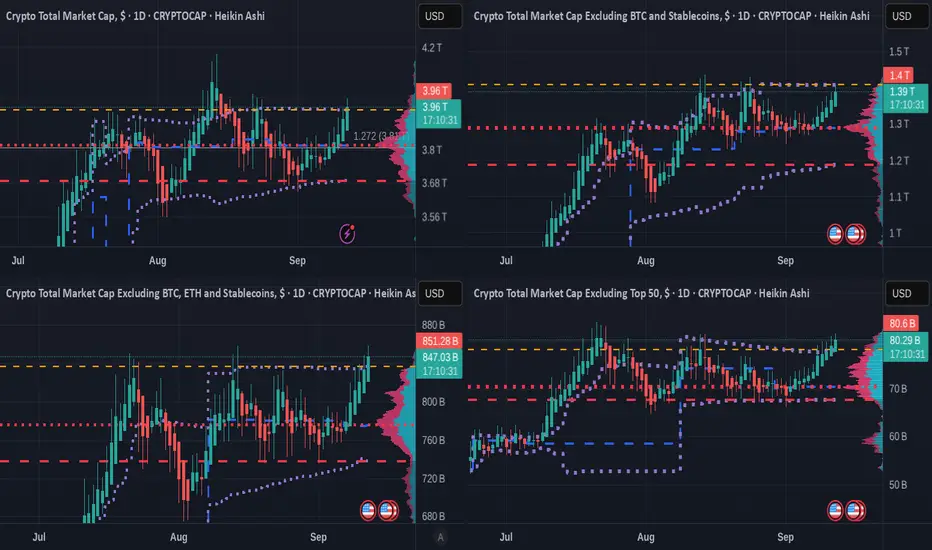
4 x TOTAL Crypto charts showing ALT Season has MomentumTop line - TOTAL Crypto Market Cap - TOTAL 2 (Excluding BTC )
Bottom Line - TOTAL 3 ( Excluding BTC & ETH ) - OTHERS ( Top 125 coins minus Top 50 by market cap )
TOTAL 3 is ALL ALT coins
OTHERS is Mid to Lower Cap ALT coins
These 4 Charts use the VRVP
he Volume Profile Visible Range (VPVR), is a technical analysis indicator on TradingView that displays the distribution of trading volume at different price levels within the currently visible range of a chart.
The Colour Key is below
Value Area High ( VAH ) - Orange Dashed Line
Value Area Low ( VAL ) - Red Dashed line
Point of Control ( POC ) - Red Dotted line
Developing POC - Blue Dashed line
Developing Value Area - Purple Dotted line
These lines can be seen as lines of support / Resistance.
The 2 Upper charts, we see that PA is being held back on the VAH line.
The 2 Lower charts show us that PA has Broken ABOVE the VAH line.
This shows us more Volume of training is happening on the lower Cap ALTS than the higher cap
It is as simple as that
But we should look at the BTC/Dominance chart
BTC.D is on Support and it has produced bounces in the past
We also see on the 2nd chart how we should have already have had the ALT season...so..It maybe short lived. But the dynamics of the market have changed......
So there we have it, The TOTAL charts for ALTS shows us that ALTS are breaking out but this could be Fragile but by no means does it mean they will crash right away.
But be careful, we are in uncharted territory.
ONDO Retest Setup – Spot Long Opportunity from SupportText (Description):
ONDO has been extremely bullish over the past few days, breaking out of a key resistance zone and showing strong momentum. Now, price is now retesting the breakout level, which could act as support — a classic continuation setup for a spot long entry.
🔹 Entry Zone: $0.98 – $1.00 (Support Retest)
🔹 Take Profit 1: $1.10 – $1.25
🔹 Take Profit 2: $1.40 – $1.55
🔹 Stop Loss: Below $0.95
🔹 Risk/Reward: Favorable setup based on trend continuation
#ONDO #Crypto #SpotTrade #SupportResistance #BullishSetup #TradingView #CryptoAnalysis #PriceAction

BTC & ETH Breakouts Explained (Simple Strategy)Bitcoin just printed a perfect daily breakout candle — and Ethereum is forming a massive structure. In this video, I’ll show you the exact triggers I use on Daily, 4H, and 15m to catch the next move before everyone else.
Drop your BTC analysis in the comments — let’s debate it together.
Want me to cover a specific coin in tomorrow’s update? Comment it below.

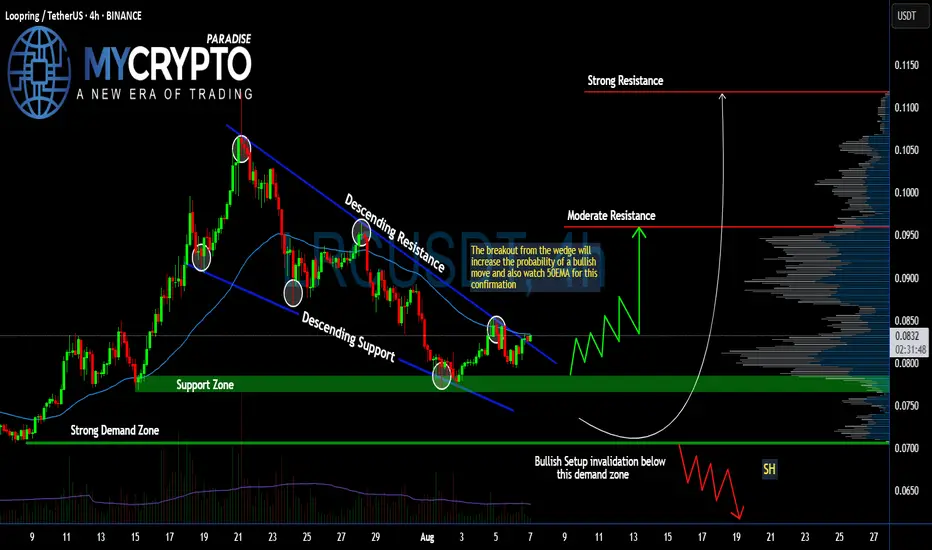
#LRC Ready for a Massive Recovery From Here | Must Watch Yello, Paradisers! Is #LRCUSDT finally ready for a breakout, or is it just another trap for early bulls? Let's break down the current structure of #LRC.
💎#Loopring ( CAPITALCOM:LRC ) has been moving within a descending wedge pattern for weeks, with price consistently making lower highs and lower lows—clearly respecting both descending resistance and support levels. However, we are now starting to see signs of change as it retests the upper trendline.
💎A breakout above the descending resistance is about to occur, and it’s doing so right around the 50EMA, which adds further confluence for a possible bullish move. This move is increasing the probability of a short-term trend reversal.
💎The support zone around $0.078–$0.082 is the key region to watch now. If bulls can hold above this zone and reclaim it as a base, we could see a breakout continuation toward the moderate resistance at $0.096. Should momentum build up from there, the next big target is the strong resistance at $0.1118—a level marked by historical seller interest and significant volume profile resistance.
💎However, if #LRCUSD falls below the strong demand zone at $0.0706, this entire bullish setup becomes invalid. That breakdown would suggest the market isn't ready yet, and could trigger another wave down toward fresh lows.
Stay patient, Paradisers. Let the breakout confirm, and only then do we strike with conviction.
MyCryptoParadise
iFeel the success🌴
BITCOIN (BTCUSD): Bullish Rally Confirmed?!
As I said yesterday, Bitcoin managed to violate a key daily
resistance cluster, and we have a confirmed bullish Change of Character CHoCH now.
Analyzing intraday time frames, I see a strong bullish confirmation
after a retest of a broken structure on an hourly time frame.
We can expect growth now.
First goal will be 115000.
❤️Please, support my work with like, thank you!❤️

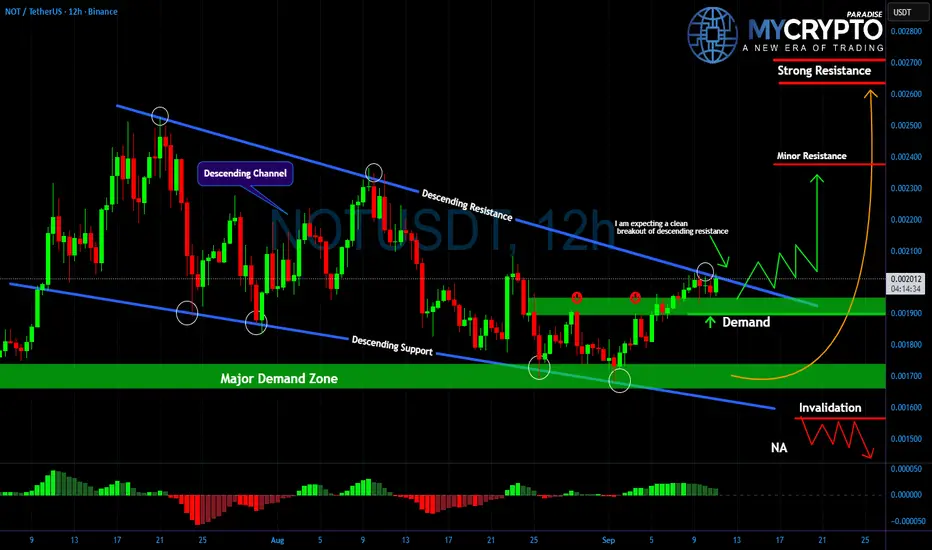
NOTUSDT: Silent Accumulation Before the Next Big BreakoutYello, Paradisers are you paying attention to what’s happening on NOT right now? While most traders are distracted, the price action has been quietly building pressure inside a textbook descending channel, and the breakout signs are now impossible to ignore.
💎After several weeks of heavy compression, #NOTUSDT finally pushed through descending resistance, signaling that sellers are losing their grip. For the last sessions, price has been retesting the breakout area, stabilizing right above the demand zone. This behavior often indicates silent accumulation before a more aggressive move begins.
💎As long as the demand zone holds, buyers keep the advantage. A clean breakout above the minor resistance around 0.0022 could open the path toward the strong resistance level near 0.0026, where significant supply is expected. If this level is reached, the momentum could accelerate sharply as short sellers begin to cover.
💎However, traders must also stay alert. A failure to hold the demand zone would expose price to the invalidation level around 0.0016. A breakdown below it would completely change the market structure and shift the bias back into bearish territory.
💎Momentum indicators are already showing encouraging signs of early accumulation, with every dip into demand quickly attracting buyers. If this continues, NOT could deliver a sharp breakout that leaves the majority of traders chasing late entries.
Strive for consistency, not quick profits. Treat the market as a businessman, not as a gambler.
MyCryptoParadise
iFeel the success🌴
BITCOIN (BTCUSD): Bullish Wave is Coming?!
Quick update for Bitcoin.
Earlier, I already warned about a potential bullish accumulation
after a test of a demand zone.
The price is now testing an important supply cluster and we may
see a breakout of that today.
In case of a daily candle close above 113600, a bullish reversal
will be confirmed, and we will expect a growth at least to 116800.
❤️Please, support my work with like, thank you!❤️
I am part of Trade Nation's Influencer program and receive a monthly fee for using their TradingView charts in my analysis.

BTCUSD POSSIBLE BUY SETUP 112,167 TO 120,000📊 BTCUSD – Potential Bullish Continuation Ahead
Description:
BTCUSD has recently shown a break of structure (BOS) and a clean break above the descending trendline. Price is currently forming higher lows, which suggests a possible continuation to the upside.
Support Zone: $110,000 – $111,000
First Target Zone: $113,000 – $114,000
Main Target Zone: $116,000 – $117,000
My Bias (plan):
I remain bullish as long as the price holds above $ 110,000.
Possible entry: retracement around $111K – $112K.
Stop Loss: below $110K.
Take Profit: $113K – $117K.
Risk Management:
⚠️ This is not financial advice. Manage your risk properly—never risk more than you can afford to lose.
Community Note:
I share analysis like this regularly. If you find it useful, feel free to follow me here on TradingView for more updates 🙌.

Litecoin — Liquidity Hunt from $111 PainSergio Richi Premium ✅
CRYPTOCAP:LTC #Crypto #Litecoin — Liquidity Hunt from $111 Pain | Liquidity Zone: $1.2M long liquidation at $111 | September 06, 2025.
Price (Sept 6, 2025) : $111.68
Institutional Accumulation & Funds:
Key players stacking LTC as a treasury asset, tightening supply (77% long-term held, miner reserves ~2M, MWEB 183K+ locked):
• Luxxfolio Holdings: Filing $100M CAD (~$73M USD) prospectus to accumulate toward 1M LTC by 2026; views LTC as "hard currency." Backed by Charlie Lee, positions as first LTC treasury company.
• MEI Pharma: Holds 929,548 LTC in treasury.
• Grayscale Litecoin Trust: Enables institutional exposure; SEC delayed ETF rulings to Oct 2025. Coinbase holds 214K LTC.
💡 Entry & Exit:
Entry: $111.68 (spot long)
🎯 Take Profit: $130.00 (+16.41%)
