PLAY Analysis (4H)It seems that the price is currently completing wave g of B. After this wave is completed, we can expect an upward move. The best area for wave g to complete is around the green lines marked on the chart, which represent our entry zones.
Please note that due to the high volatility of this coin, this setup is suitable for the spot market only, not futures
The targets are marked on the chart. A daily candle close below the invalidation level will invalidate this analysis.
For risk management, please don't forget stop loss and capital management
When we reach the first target, save some profit and then change the stop to entry
Comment if you have any questions
Thank You
Cryptotrading

BITCOIN (BTCUSD): Bullish Wave is Coming?!
Bitcoin is now testing an Order Block zone on a daily.
Its bullish breakout and a daily candle close above that
will be a very important event.
A bullish move will be expected at least to 116800.
Patiently wait for a breakout and get ready to buy!
❤️Please, support my work with like, thank you!❤️

ADA Buy/Long Setup (1D)Cardano, in our view, is currently within a major bullish structure, with wave D having just completed.
It now appears that the price is inside bullish wave E.
We have identified two specific entry levels for re-entering Cardano. At each entry level, you can take one step into a buy position.
The target is around \$1.20.
Please note that this analysis is based on the daily timeframe, so it may take some time to play out.
The invalidation level is the same as our stop loss. If this level is reached, the setup will be invalidated.
For risk management, please don't forget stop loss and capital management
Comment if you have any questions
Thank You

Moodeng Meme Coin sell-off happening as expectedMoodeng Meme Coin sell-off is happening as expected. It's taking some weeks and this meme coin is dropping as a reaction to the very strong supply imbalance in the bigger timeframes. This trade idea has been shared in the past and for those swing traders holding this meme coin it's time to manage the short positons.

Is $PENGU about to send?TL;DR
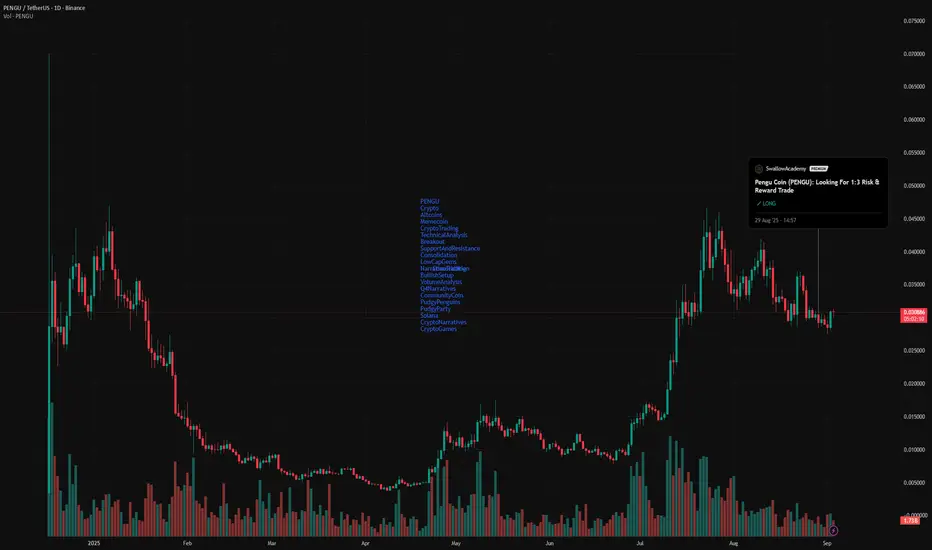
Pengu is holding up strong around $0.030 after a big run-up. It’s been consolidating here for a bit, and it’s starting to look like we might be gearing up for the next leg. Plus, the community is super active, and there’s a lot going on behind the scenes.
So what’s Happening?
Price is chilling around ~$0.030
Strong support holding at $0.029 and I've seen multiple bounces there
Had a big run-up to $0.07+, followed by a healthy cooldown
Currently in a classic consolidation phase
Volume looks solid buyers stepping in under $0.030 every time
Why Are People Still Bullish?
Pudgy Penguins just sponsored a NASCAR team. Actual race cars with penguins on them.
The Pudgy Party mobile game is blowing up. On-chain interactions, tournaments, great reviews, and people are actually playing.
X (Twitter) is full of believers stacking more at these levels. The meme game is strong, but so is the real use case stuff.
Some guy even said this in a post:
“In a few months we’ll laugh at these prices.” He might be right.
If you're thinking of jumping in, here’s a simple setup, but always do your own research first:
Buy Zone: $0.030–$0.031
Take Profit: First target at $0.036, second target around $0.045
Stop Loss: ~$0.028
Good risk/reward if you think the sideways chop is ending soon.
Final Thoughts:
Pengu has meme energy, but it also has a growing ecosystem. Between the mobile game, the merch, the community, and real brand exposure.
You don’t have to ape, but if you're watching this one… stay close. This penguin could be heating up!
Ethereum - Eyes 5,600–5,800 After Holding Strong Near HighsEthereum (ETHUSD) remains in a clear uptrend, consolidating just beneath its all-time highs. After printing a record high in recent weeks, ETH has shown strength by holding its gains—a typical behavior in a trending market.
🔍 Technical Breakdown:
Trend: Bullish structure intact with higher-highs and higher-lows.
Price Action: ETH is coiling within a key resistance zone (4800–5000)—often a precursor to a breakout.
Momentum: One of the top-performing assets since the April 7 market low.
📈 Targets:
Short-term: 5,600–5,800 zone is the next potential target if the breakout materializes.
Medium-term: Eyes on 7,000, with an extended move to 8,000 still on the table if momentum accelerates.
⚠️ Macro Perspective:
As price moves higher, sentiment and targets naturally expand, fueling further speculative momentum. Caution is warranted—bull markets can persist longer than expected, but parabolic moves often end abruptly.

Arbitrum’s Last Stand at $0.35?Yello, have you noticed how #ARBUSDT is clinging to its last major support, just as retail traders are starting to panic? This is exactly where the market usually decides whether to trap the impatient or reward the disciplined.
💎Price is currently testing the demand zone around $0.45–$0.50, aligning with the ascending channel support and the 200-day moving average. This zone is absolutely crucial. As long as #Arbitrum holds above it, the structure remains intact, and we can expect a potential rebound toward minor resistance near $0.60, with strong resistance waiting higher around $0.75.
💎However, a confirmed breakdown below $0.45 would shift the structure into dangerous territory. A deeper flush toward $0.35 would not only invalidate the bullish channel but also trigger panic selling across the board. That is where most weak hands will capitulate, while smart money prepares to reload.
💎The majority will chase every small move, but the real trade is about waiting for either a clean bounce with momentum or a decisive breakdown. Both outcomes will be violent, and both will clear out inexperienced traders.
🎖Strive for consistency, not quick profits. Treat the market as a businessman, not as a gambler. The next move on #Arbitrum will be a money-maker for some and a disaster for many make sure you are on the right side by staying disciplined.
MyCryptoParadise
iFeel the success🌴

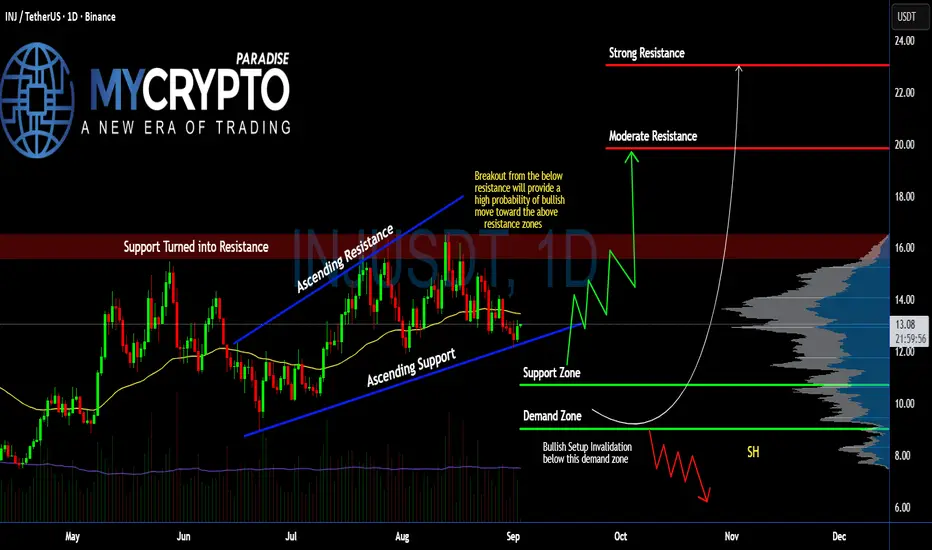
Is #INJ Ready for a Pullback or Bears will Drag it Down? Yello, Paradisers! Is #Injective gearing up for a major breakout, or is this the final shakeout before the next big trap? Let’s uncover what’s unfolding on #INJUSDT:
💎After forming a well-defined ascending channel, #INJ has been closely respecting both the ascending resistance and ascending support levels since early July. Currently, price is hovering just above the ascending trendline support, suggesting that buyers are still holding the line around the $12.80–$13 area.
💎We’re watching two major zones here: Support Zone around $10.72 and Demand Zone between $9.05–$10.72. As long as #INJ stays above this demand zone, the bullish case remains intact. A bounce from here could trigger a retest of the previous support-turned-resistance around $15.80–$16, which is now acting as a supply block.
💎If price manages to reclaim that zone with volume confirmation, we could see a move toward moderate resistance at $19.84. Beyond that, the next high-probability target stands at $23.03, which aligns with the strong resistance level marked on the volume profile. This would be a critical psychological zone for profit-taking and could trigger increased volatility.
💎However, if bulls lose the battle and #INJUSD closes below $9.05, the entire bullish structure will be invalidated. This would likely lead to a drop back toward the $7–$8 range, especially with weak volume participation. That’s where late longs might get completely wiped out, so risk management becomes key in this zone.
Stay patient, Paradisers. Let the breakout confirm, and only then do we strike with conviction.
MyCryptoParadise
iFeel the success🌴
BTC Breakdown Alert: Bears Eye $106K Next!
🔥 **BTC Bears Ready to Attack? 🚨 Target \$106K Incoming!** 🔥
📊 **Market Bias**
⏳ **Intraday → 4H**: 🟥 Bearish (⬇️ below EMA9/21/20SMA, 📉 MACD negative, 💥 sell volume)
📅 **Daily → Weekly**: ✅ Mixed-to-Bullish (📈 above 200 SMA ≈ 101.3k)
⚖️ → Tactical short only, ⚠️ size carefully.
🎯 **Trade Plan**
💰 Entry: **109,200**
🛑 Stop Loss: **110,800**
🎯 Take Profit: **102,400** (⚡ 50% at 105,900 / 50% at 102,400)
📏 Size: **1 BTC** (risk \~1%)
💪 Confidence: **60%**
⏰ Timing: **Market Open**
🧠 **Why Short?**
* 📉 EMAs/SMA bearish stack
* 🔻 Expanding negative MACD
* 🧊 Heavier sell volume
* 🎯 BB extension aligns w/ \~102.4k
⚠️ **Risks**
* ❓ Missing OI/liquidity data = squeeze risk
* 📈 Long-term bullish structure > 200 SMA
* 🌍 Macro shocks (ETF/reg headlines, DXY swings)
---
📊 **TRADE JSON (automation/record):**
```json
{
"instrument": "BTC",
"direction": "short",
"entry_price": 109200.00,
"stop_loss": 110800.00,
"take_profit": 106000.00,
"size": 1.0,
"confidence": 0.60,
"entry_timing": "market_open",
"signal_publish_time": "2025-09-01 17:02:46"
}
```
---
🏷️ **Hashtags:**
\#BTC 🚀 #Bitcoin 💎 #CryptoTrading 📊 #TradeSetup 🐻 #ShortTrade ⚡ #DayTrading ⏳ #RiskManagement 🛡️ #SwingTrade 🎯

Is #CAKE About to Crumble? Breakdown Alert Below Key SupportYello Paradisers! Are you watching what’s unfolding on #CAKEUSDT? Because if you’re not, you might get into a trap. Let’s break down #PanCakeSwap setup:
💎#CAKE has been respecting a clean ascending channel since mid-June, riding between dynamic support and resistance levels. However, after multiple rejections from the resistance zone near $3.00–$3.20, momentum has started to fade. The structure is now showing early signs of potential reversal.
💎A clear breakout below the ascending support has just taken place, and this opens the door to a potential bearish leg—especially if we get a successful retest of that broken support, which would now act as resistance. This is a crucial signal that smart traders are watching.
💎The bearish setup invalidation sits above $3.09. Only a clean breakout and hold above this level would invalidate the short bias and reintroduce the potential for a bullish expansion. Until then, the market structure remains vulnerable.
💎Currently trading around $2.63, #CAKEUSD is eyeing the $2.33 support zone. If this level fails to hold, we expect a deeper move toward the strong demand zone at $1.79, which also aligns with key high-volume nodes on the VRVP—making it a magnet for smart money accumulation.
Trade smart, Paradisers. This setup will reward only the disciplined.
MyCryptoParadise
iFeel the success🌴

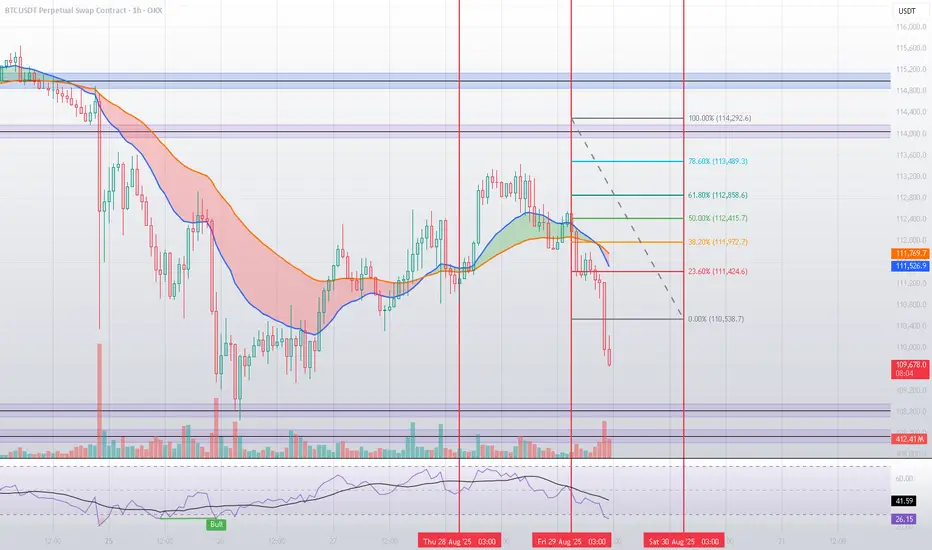
Technical Analysis for BTC/USDTBased on mathematical and statistical models, along with technical tools such as Fibonacci retracement levels and moving averages, Bitcoin is currently undergoing a bearish correction after failing to break through the key resistance at $114,046.
🔹 Interaction with Fibonacci Levels
In the previous analysis, we highlighted the importance of Fibonacci retracements in anticipating turning points. Recent price action confirmed this, as Bitcoin repeatedly reacted to these levels. The 61.8% retracement at $112,858 acted as a strong resistance, turning into a supply zone where sellers regained control.
Moreover, price failed to approach the 100% retracement at $114,292, reflecting a clear weakness in bullish momentum at higher levels. After that, Bitcoin broke below the 38.2% retracement at $111,972, triggering a sharper downside move — once again proving the reliability of statistical models in mapping market behavior ahead of time. 📉
🔹 Key Support Levels
$108,832: The first major support, aligning with a previous liquidity zone where price showed strong reactions. 🛡️
$108,353: A stronger support level. If broken, this could lead to a deeper bearish extension toward $107,500 or lower.
🔹 Technical Indicators
The RSI dropped to low levels (41.6 and even near 26.4 at certain points), signaling oversold conditions ⚠️, which may lead to a short-term rebound from the supports.
The 20 & 50 EMAs have crossed bearishly, confirming the downward bias.
🟢 Bullish Scenario
To regain momentum, Bitcoin must reclaim the $111,400 – $111,900 area and then retest the $112,800 (61.8% Fibonacci) level. Only a sustained breakout here would open the way toward the major resistance at $114,046. 🚀
🔴 Bearish Scenario
Failure to stabilize near current levels could push price down to $108,832, followed by $108,353. A breakdown below the latter would likely accelerate bearish momentum significantly.
✅ Conclusion
Bitcoin failed to reach the key resistance at $114,046 and gradually lost strength as it broke through crucial Fibonacci levels. The market is now testing critical supports at $108,832 and $108,353, which will determine whether a rebound is possible or if further downside is ahead. At this stage, caution is essential ⚖️, with close monitoring of liquidity and momentum.
Is AAVE About to Explode Above or Collapse? Key Levels to WatchYello Paradisers! Is #AAVE quietly prepping for a major breakout… or is this just another setup to wipe out the impatient bulls before the real move begins?
💎#AAVEUSDT is moving in a textbook ascending channel, respecting both trendline resistance and support beautifully. The structure is clean, but deceptive. While many may assume this is an easy path higher, seasoned traders know better — especially with what’s happening near the critical resistance zone.
💎The red resistance zone ($270–$280) that was previously a major support during the last cycle is now acting as heavy resistance again. #AAVEUSD is currently battling this zone after several failed attempts to break through. But the structure still leans bullish as long as we stay within the ascending channel.
💎Both the 50 & 200 EMA are now acting as dynamic support. This is key — if the price remains above these EMAs and the lower channel boundary, momentum favors the bulls. A decisive breakout above $280 could trigger a parabolic rally toward the $375–$410 range, a level where serious resistance and profit-taking are expected.
💎However… if bulls get lazy and we see a strong breakdown below the ascending channel, especially below $237, the setup gets shaky fast. A complete invalidation of the bullish case occurs if AAVE loses $209 — from there, expect a breakdown structure to unfold with a likely test of much lower levels and a possible retest of the $150 zone.
Trade smart, Paradisers. This setup will reward only the disciplined.
MyCryptoParadise
iFeel the success🌴

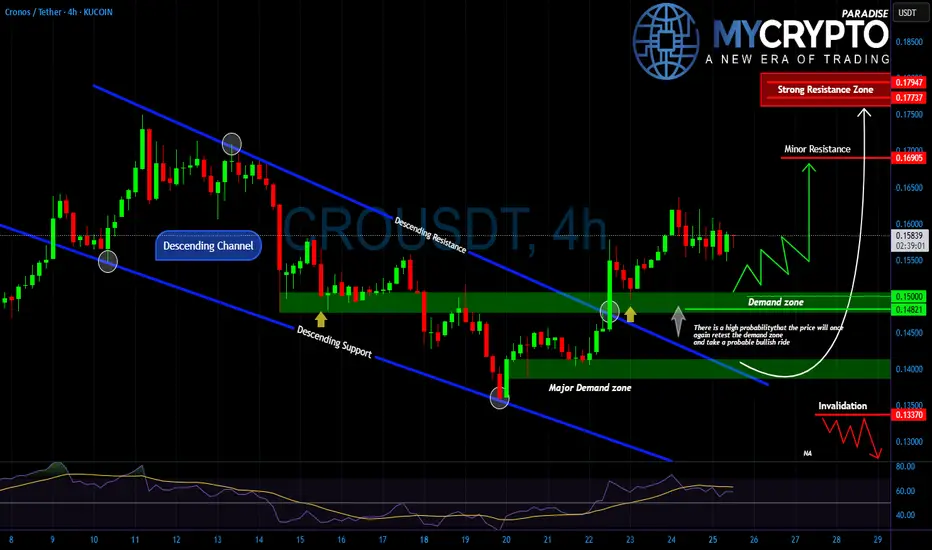
CROUSDT Ready for a Bullish Rebound or a Brutal Trap? Yello Paradisers, is #CROUSDT about to give us a clean bullish rebound from demand or is this just another setup to wipe out impatient buyers?
💎After a prolonged descent within a clear downward channel, #CRO finally broke out, reclaiming strength above the major demand zone around $0.1400–$0.1450. This level acted as a turning point, pushing price back toward the $0.1550–$0.1600 region. Currently, GETTEX:CRO is hovering above minor demand and showing signs of retesting the zone near 0.1500.
💎That region, however, represents a heavy resistance cluster where profit-taking could easily trigger sharp rejections.On the flip side, if demand fails to hold and price breaks below 0.1480, the invalidation level near 0.1330 comes into play. A breakdown into that zone would trap late buyers and likely fuel another wave of panic selling before any real recovery attempt.
💎The key here is patience. Price is at a crossroads where both traps and opportunities are equally possible. Only disciplined traders who wait for confirmation at demand or rejection from resistance will avoid getting caught in the whipsaw.
🎖Strive for consistency, not quick profits. Trade with patience, protect your capital, and let the market show you the highest probability setups. That is how you stay in the winner’s circle.
MyCryptoParadise
iFeel the success🌴
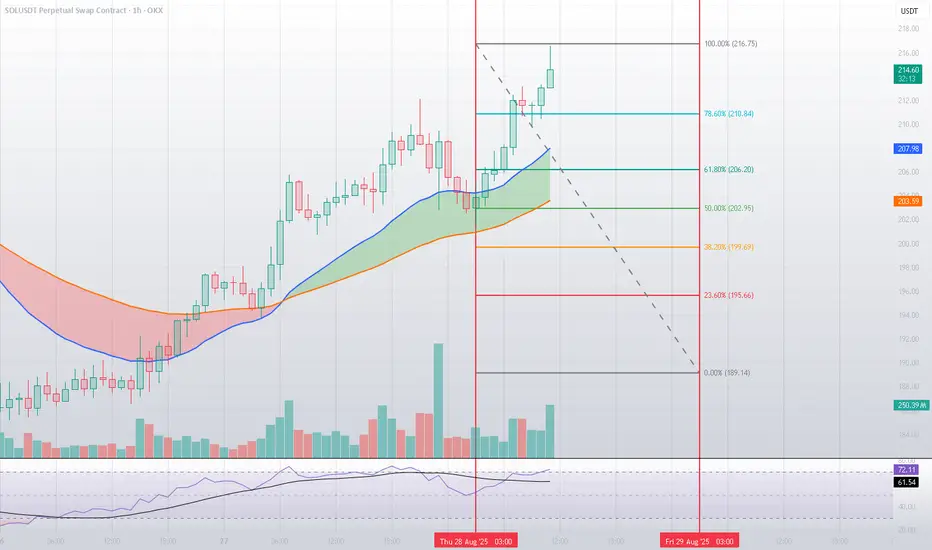
Technical Analysis for SOL/USDTBased on mathematical and statistical models, along with technical tools such as Fibonacci retracement levels and moving averages, Solana (SOL) continues to show strong bullish momentum after breaking key levels and trading around $215.
🔹 Resistance Levels
$216.75: The first major resistance, derived from the 100% Fibonacci extension. A confirmed breakout above this level would likely trigger a new impulsive move upward. 🚀
$225.61: A critical resistance zone. Surpassing this level would further validate the bullish trend and open the door for an extended rally toward $230+.
🔹 Support Levels
$213.38: The first support level. Holding above this zone reflects buyers’ strength, while a break below it could lead to a short-term correction. 🛡️
$210.84: A stronger and more decisive support aligned with the 78.6% Fibonacci retracement. Losing this level would weaken bullish momentum and potentially push the price down toward $206 – $202.
📈 Indicators
The RSI is hovering around 72, signaling overbought conditions ⚠️, which may trigger short-term corrections before any further upside.
The 20 & 50 EMAs remain in a bullish alignment, confirming the upward trend as long as price holds above key support levels.
🟢 Bullish Scenario
A successful breakout above $216.75 will pave the way toward $225.61, with potential continuation toward $230+ if momentum persists.
🔴 Bearish Scenario
Failure to clear resistance and a corrective pullback could test $213.38 first, followed by $210.84 as a decisive support level to avoid a deeper trend reversal.
✅ Conclusion
Solana stands at a critical juncture between strong resistances around $216 – $225 and solid supports near $213 – $210. A breakout or breakdown from these zones will define the next major move — either extending the bullish rally or triggering a deeper correction. ⚖️
Technical Analysis for BTC/USDTBased on mathematical and statistical models, along with Fibonacci retracement levels and moving averages, Bitcoin is currently trading near the $113,000 area. The recent bullish momentum has pushed the price upward, but the market now faces key pivot levels that will determine the next move.
🔹 Key Resistance Levels
$114,047.7: The first major resistance. A clear breakout above this level could fuel further bullish momentum. 🚀
$114,995.1: A critical resistance both technically and psychologically. Surpassing this level would likely open the way towards $115,800 – $116,000, confirming the strength of the current uptrend.
🔹 Major Support Levels
$108,829: A crucial support zone. If broken, short-term market sentiment may shift from bullish to neutral. 🛡️
$108,349: A stronger support level. A breakdown here could trigger a move toward $107,000 or even lower.
📈 Indicator Insights
The RSI is hovering near 66, suggesting the market is gradually entering overbought territory. This highlights the importance of the resistance zones, where profit-taking could occur.
The 20 & 50 EMA lines are showing a bullish crossover, supporting upward momentum as long as support levels hold.
🟢 Bullish Scenario
If the price breaks above $114,047.7 and then $114,995.1, Bitcoin could quickly advance toward $115,800 – $116,000 in the short term.
🔴 Bearish Scenario
Failure to sustain above $113,000 could lead to a pullback, with $108,829 as the first line of defense, followed by the stronger support at $108,349. A breakdown below this zone would turn the short-term outlook bearish.
✅ Conclusion
Bitcoin is at a decisive point: strong resistance lies between $114K – $115K, while robust supports are clustered near $108K. A breakout or breakdown from these levels will set the tone for the next major move. Until then, risk management remains essential. ⚖️

BTC Tactical Long | Enter 110.5K → Target 115.9K+
🚀 **BTC Trade Setup: Tactical Long @ 110.5K | Risk-Defined Mean Reversion** 🚀
📊 **Analysis Summary**
* 🔻 **Short-term:** Bearish pullback (1H/4H negative, under short MAs)
* 🔼 **Higher-timeframe:** Bullish (above 200 SMA)
* ⚖️ **Consensus:** Tactical long inside broader bullish trend (mean-reversion bounce expected unless <108.8K breaks).
🎯 **Trade Plan**
* 💵 **Entry:** 110,500 (range 110,000–111,000)
* 🛑 **Stop Loss:** 108,800
* 🎯 **Take Profits:**
* TP1: 113,200 (30%)
* TP2: 115,950 (50%, primary)
* TP3: 122,400 (20%, extended)
* 📦 **Size (example \$100k acct):** 0.59 BTC risk-sized (1% rule)
* ⚡ **Leverage:** Conservative (≈3x)
* 💪 **Confidence:** 65%
📌 **Management Rules**
* Scale out at TPs.
* Move SL to breakeven after TP1 hit.
* Invalidation: Close <108.8K with volume → exit, no revenge trade.
---
📊 **TRADE DETAILS (JSON)**
```json
{
"instrument": "BTC",
"direction": "long",
"entry_price": 110500.0,
"stop_loss": 108800.0,
"take_profit": 115950.0,
"size": 0.59,
"confidence": 0.65,
"entry_timing": "market_open",
"signal_publish_time": "2025-08-27 17:02:20"
}
```
---
🔥 **Hashtags for TradingView virality**
\#BTC #CryptoTrading #BitcoinAnalysis #LongBTC #CryptoSignals #MeanReversion #RiskManagement #SwingTrade #TradingSetup #CryptoStrategy

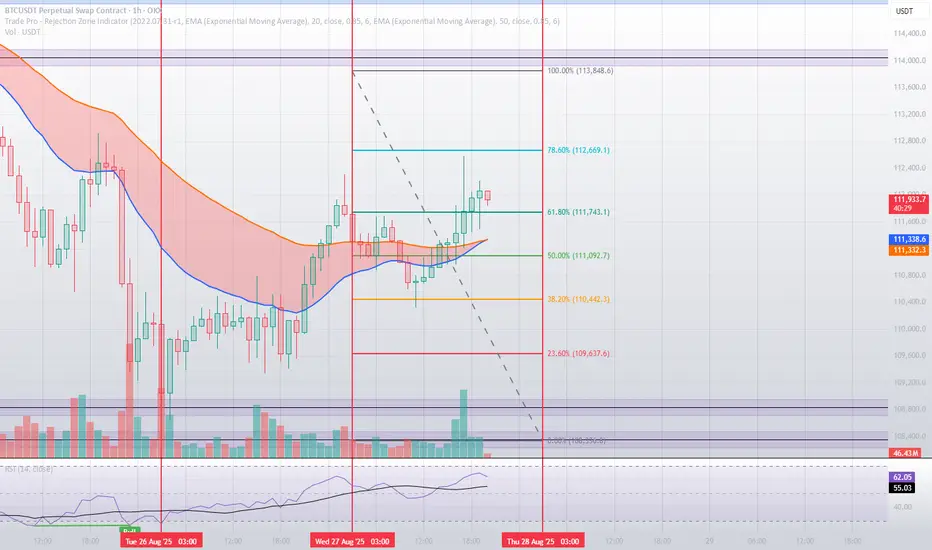
The Power of Mathematics & Statistics in BTC/USDT PredictionWhen comparing the previous analysis with the latest chart, we can clearly see how mathematical and statistical models helped anticipate Bitcoin’s movements with remarkable accuracy using Fibonacci retracements.
🔹 In the earlier analysis, we highlighted the 61.8% level at $111,743 as a decisive pivot. The new chart shows that the price indeed rallied into this zone, even pushing slightly higher towards the 78.6% level at $112,669 before facing strong selling pressure. This demonstrates the precision of mathematical models in mapping potential turning points before they happen. 📈
🔹 Support levels projected previously — such as $110,442 and $109,637 — remain intact as strong defensive zones, perfectly aligned with historical rebound areas.
⚖️ The Comparison
Mathematics and statistics are not just theoretical tools; they provide a real-time roadmap for traders:
Upside: Price climbed to the 78.6% Fibonacci extension as projected. 🚀
Downside: Key supports held firm, validating the statistical forecasts. 🛡️
🔍 Momentum indicators (RSI) also confirmed this move: rising from the neutral 52–54 range in the earlier chart to above 62 in the latest one, reinforcing the bullish swing towards mathematically calculated targets.
✅ Conclusion
From one chart to the next, it becomes clear: mathematical and statistical models are not only explanatory but predictive. Fibonacci levels acted as precise guideposts, allowing us to foresee both potential highs and lows. Their reflection on actual market action proves the strength of these models — a must-have tool for any professional trader seeking accuracy and confidence. 💡📊
RAY Breakout Alert! NASDAQ:RAY Breakout Alert! 🚨
NASDAQ:RAY is currently testing the red resistance zone 🔴
If price breaks out, the first target will be the green line level 🎯
A confirmed breakout would signal bullish continuation and could push price higher ✅

BONK Approaching Key Support – Potential Long Swing Setup
BONK is pulling back and approaching a major support zone, where buyers previously stepped in. With price action slowing down, this could present a low-risk, high-reward swing trade opportunity.
Trade Setup:
🔹 Entry Zone: $0.0000183 – $0.000016
🔹 Take Profit Targets:
🥇 $0.0000226
🥈 $0.000026
🔹 Stop Loss: Close below $0.0000155
#BONK #CryptoTrading #SwingTrade #Altcoins #TechnicalAnalysis

Ethereum Breaks $4K — Eyes on $5K and BeyondEthereum has been the top-performing asset since the April 7 low, breaking through resistance and solidifying its position as the backbone of the stablecoin ecosystem. The trend remains firmly bullish as long as ETH continues its pattern of higher highs and higher lows.
The breakout above the $4,000–$4,200 zone turned former resistance into new support, giving bulls the upper hand. Momentum now shifts toward retesting the former all-time high region at $4,800–$5,000, with upside potential extending into the next cycle.
📈 Technical Highlights:
✅ Short-term resistance: $4,800–$5,000 (former ATH)
✅ Medium-term target: $7,000 baseline
✅ Extended objective: $8,000 possible
🛡️ Key support: $4,000–$4,200 (new floor)
📣 Takeaway:
Ethereum’s structure remains a textbook bullish setup. As long as it holds above $4,000, the path favors further upside. Breakouts above $5,000 could fuel the next leg higher, while current levels may offer strong opportunities for trend-followers and long-term investors.
#Ethereum #ETH #Crypto #Trading #TechnicalAnalysis #EthereumPrice #Bullish #CryptoTrading #Altcoins #Breakout

Can #BAND Bulls Maintain this Momentum or Will Bears Win? Yello, Paradisers! Is #BANDProtocol breakout from the falling wedge legit—or are bulls walking straight into a trap? Let's dig into the latest setup of #BANDUSDT:
💎After trading for weeks inside a falling wedge, #BAND has finally broken out with solid momentum. The breakout above the resistance trendline at around $0.66 has already occurred, and the price is currently hovering near the $0.72 zone. While this move is promising, it’s now all about whether this breakout can hold or fake out.
💎The structure here is clear: #BANDUSD reclaimed the demand zone between $0.60–$0.66 after bouncing off strong support at $0.504. This zone now becomes the most important area to watch in the short term. A retest of this level would offer a high-probability continuation setup, especially since the 50EMA is now acting as dynamic support beneath the price.
💎If bulls can maintain control, we have a clear path toward the moderate resistance at $0.992. That’s where the next wave of selling pressure is expected. But the real prize is the strong resistance zone near $1.180. That’s the level where major distribution could occur, and it's where we’ll be watching closely for profit-taking signs.
💎However, the bullish thesis breaks down completely if the price drops back below the $0.60–$0.66 demand zone. In that case, our invalidation point sits firmly at $0.504. A close below that support would indicate bears are back in control, and we’d shift to a defensive stance, targeting lower re-entry zones.
Stay patient, Paradisers. Let the breakout confirm, and only then do we strike with conviction.
MyCryptoParadise
iFeel the success🌴

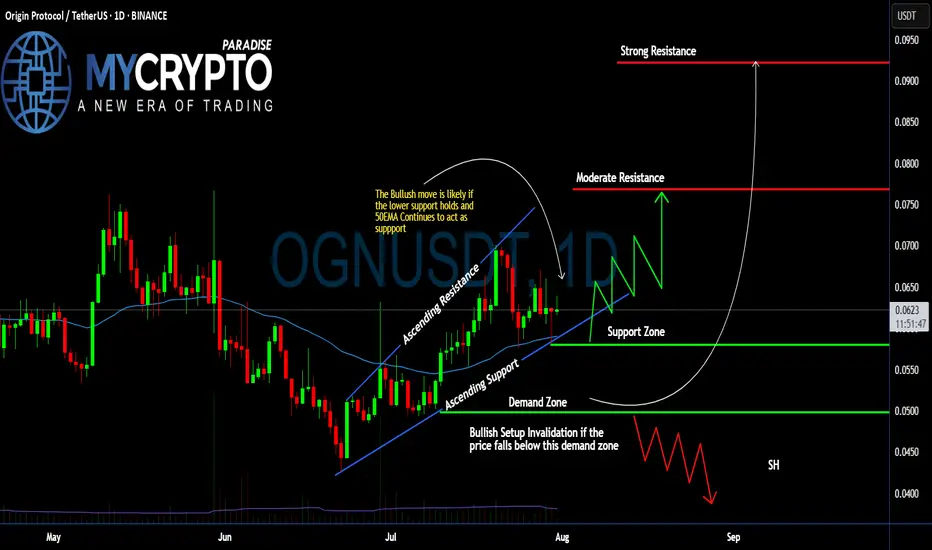
#OGN Ready For a Massive Bullish Move | Must Watch For BullsYello, Paradisers! Is #OriginProtocol about to explode to the upside, or is this a bull trap in disguise waiting to liquidate the impatient? Let’s break down what’s brewing on #OGNUSDT:
💎After forming a clean ascending channel, #OGN has been respecting both the ascending resistance and ascending support levels. Price is currently trading just above the 50 EMA, which has been acting as a dynamic support line since early July. This structure shows clear buyer interest around the $0.058–$0.062 zone—an area that aligns with volume cluster support.
💎The bullish scenario remains valid as long as #OGNUSD holds above the demand zone between $0.0499–$0.0580, and especially if it stays above the 50 EMA. As long as this structure is maintained, we could see a bounce toward the moderate resistance level at $0.076, where previous sellers stepped in and price stalled.
💎If buyers can break through that moderate resistance with strength and rising volume, the next key target lies at $0.092, which aligns with a strong resistance level and high-volume node on the visible range. This area is likely to trigger a reaction, so traders should remain agile.
💎However, if price breaks down below the demand zone, this would invalidate the current bullish setup and open the door for a potential move back toward the $0.045–$0.040 area. A broader shakeout would likely accompany this and could trap many late long entries.
Stay patient, Paradisers. Let the breakout confirm, and only then do we strike with conviction.
MyCryptoParadise
iFeel the success🌴
Bitcoin 4H Chart | Trend is My Best Friend – Smart Money Points Bitcoin 4H Chart | Trend is My Best Friend – Smart Money Points to 119K 🚀🔥”
Market Structure
The price recently rejected the key resistance zone (120,000 – 123,000 USD), which acted as a strong supply area.
After the rejection, BTC experienced a sharp decline forming lower highs and lower lows, indicating short-term bearish momentum.
Multiple Break of Structure (BOS) levels confirm bearish pressure, but the price is now approaching a significant demand zone.
2. Liquidity & Demand Zones
A clear liquidity sweep occurred near the 123,000 zone, where buyers were trapped before the drop.
The Demand Zone and Bullish Order Block (OB) around 112,000 – 114,000 USD serve as the primary area of interest for institutional buying.
This zone overlaps with previous support, strengthening its validity as a high-probability reversal point.
3. Entry & Targets
Entry Zone: Highlighted between 114,000 – 115,500 USD, where demand is expected to absorb sell orders.
First Target: 119,000 USD – this aligns with the chart’s projection and acts as a liquidity grab zone before further moves.
Second Target: If bullish momentum sustains, BTC may retest the 120,000 – 123,000 resistance range.
4. Risk Factors
If BTC breaks below 112,000 USD, the demand zone will be invalidated, potentially opening downside continuation toward 110,000 USD.
Strong rejection at 119,000 USD could also bring sellers back into control.
📌 Conclusion
BTC is currently in a bullish accumulation phase after a heavy correction. Price is sitting at a high-probability demand zone where institutional buying interest is expected. The next impulsive move is projected toward 119,000 USD, with potential continuation toward 120,000 – 123,000 USD, but rejection at resistance remains a risk.
