Look Beyond The Chop — Momentum Is Building From the 2-day time-frame we see price consolidating above a key horizontal level with MACD turning positive. As each candle completes we move closer to the Ichimoku Cloud support which itself can help push price above the horizontal (orange line)
ETHUSD's next resistance level is up at $450. A 20% move.
We continue to watch for new BUY signals from high performing strategies on the SparksterSignals platform (link below)
Note: SparksterSignals (including our technical analysis and our algorithmic backtested signals) are not provided as financial advice.
Crytpocurrency

SXP trend reversal 1st higher low printed - let's make a higher high from here and we will see +2$ again soon!

Alert: Bitcoin is showing bearish conditions!!!
Bitcoin show in Daily timeframe a consolidation on the trend. Right now, if you look out in H1 or H4 timeframe, the trend is become bearish if we applied the EMA 200, so that mean that Bitcoin is below of the EMA 200 in H4 and H1 timefrmame, that sign turn bearish!!!
Now, as we see a consolidation, we could proyect a formation of ABC pattern what Bitcoin is leading to the important support in Daily at $9,000 USD, that is an important support. Now, right now the key support line was candelled because is applied on the simetric triangle that Bitcoin formed in Daily timeframe or H4 timeframe.
And right now, in H4 and H1 timeframe too, we see a bearish rising wedge and we expect a possible entry around of $10,600 USD in average to make a short position until the $10,165 USD. If you apply the EMA 200, you can noticed it that BIitcoin is below, and that mean that bears are taking the control to leading the bearish sentiment of crypto-markets.
In minutes, I will going to analyze Ethereum!!!

Polkadot descending triangleDOT is forming a descending triangle -> bearish pattern!
When the green support zone of the triangle is broken, then it's very probable that we are heading towards the purple dotted support line.
We could see bounces from the green dotted lines as well, these are also fib. extensions.
Everything changes if we would break and close above the downwards red resistance line of the triangle, however this is less likely.

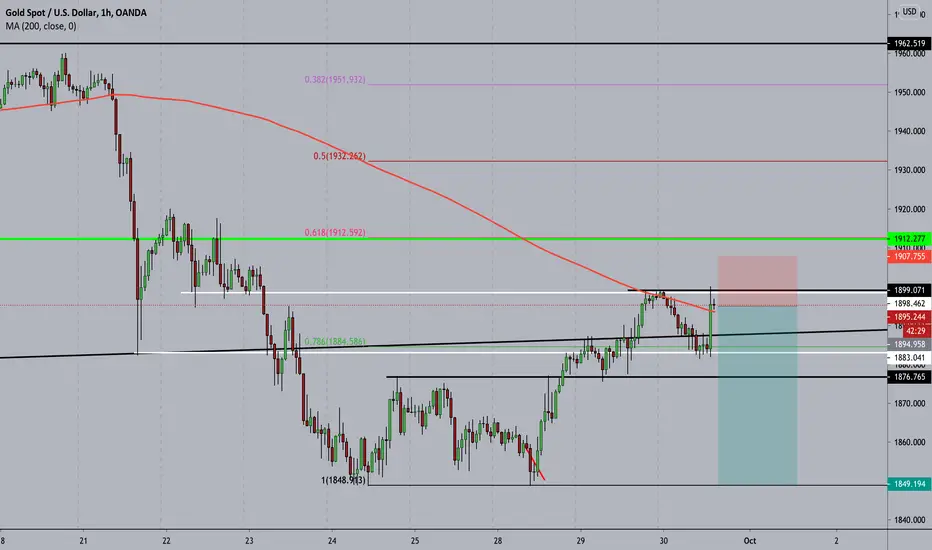
Gold SellRT region tested and rejected last night through Asia session, has come back up to retest and has hit a liquidity pool, potentially a fake downward move and now we'll see the real move, lets see for some more reaction.
Bitcoin Dump ImmenentThe 55 Day EMA has been a crucial indicator in forecasting large drops in the price of #BTC. Every time Bitcoin has dropped below the daily 55 EMA we have seen a large dump in price. For many reasons I think we have yet to make another higher low in price, and the 55 EMA highlights the crucial point we are at. If we loose this level I think it's safe to say we will see 8-9k again before resuming the uptrend. Not to fear, this dip will be great for buying ;)

LTO bounces and next leg up!A bounce from the 200 Day MA & Golden pocket from the 61.8 FIB retrace, plus MACD turning to bullish on the daily... good things are coming for LTO.

SERUM / USDT breakout of massive falling wedge... $3 next?Broke out of massive falling wedge ever since putting in the local high at 3.8
Next resistance zone to clear in green before heading even higher
21% + since point of entry, targeting 71% + at final TP level

DIVERSIFICATION IN TRADING|PART 4: SIGNAL AGGREGATOR Aren’t all signals fraud? How to choose a signal provider? What to expect?
Aren’t they all fraud? Lets get this out of the way: yes, most of them are
90-95% of signals out there are just a massive scam.
Our animal like desire for a MONEY BUTTON makes us an easy pray for scammers of every denomination.
How to know the guy is a scam? Well, you can’t know before you buy, actually, and that’s the problem.
But there are ways to tell with certain degree of probability that the guys is a real/scam
Red flags:
(1)The most obvious one is when you are promised unrealistic returns. The average trader makes 5-10% of deposit a month with 1% risk per trade.
You can potentially increase returns by increasing risk. But when you are promised to turn 100$ into a million in 6 months- that’s a scam
(2) Unknown guy. No track record. Well, this one is self evident.
(3) No public record. If you can’t see someone’s performance out in the open, but still being promised profitable signals.
That should make you question the validity of the guy. Most people on Tradingview are good from that perspective, as you can’t edit or delete your old ideas, so you see both bad and good trades.
But the key indicator as with anything, is Reputation. Buying a product from someone reputable gives you a high chance to get what you paid for.
Now, there is an interesting question:
The signal provider is a human being too, right?
So all the fallacies of ours that I talked about are applicable to the signal provider too?
Thats right!
The signal provider might have a loosing streak, get sick or sad or just stop trading for a while.
So is this real diversification? How about buying several signals then?
But that must be expensive, and how do I find several decent signal providers,If finding ONE is already a challenge?
Here, I present you A SIGNAL AGGREGATOR!
A Signal Aggregator is guy who already selected the best signal providers for you, purchased their signals and put them all together for you for a fraction of a cost!
- No need to go through hundreds of offers on the market
- All signals are already tested and vetted
- The price is LOWER than any signal individually
- All signals in one palace. No need to be in multiple groups.
- True diversification
- Multiple strategies combined
-Peace of mind
Wanna know more? LIKE and SUBSCRIBE!
PREVIOUS PARTS IN THE LINKS BELOW!

Ethereum appears very bullishI anticipate a breakout of $400 with low volume could result in a nice bid up - entailing a higher price.

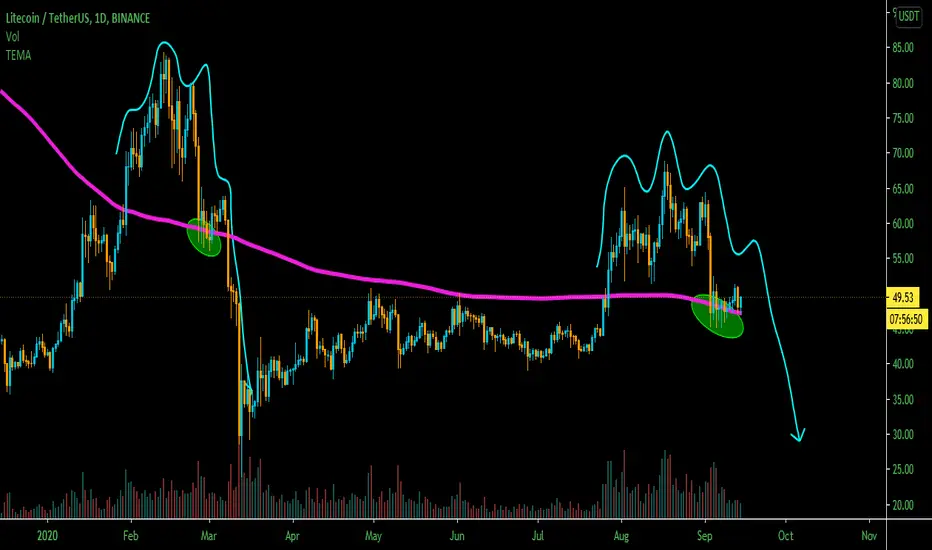
Litcoin price Daily Fractalsprice holding 200 ema and fractals looks the same let's see how this behaves.
Icon looking Bullish. Watch MACD crossoverFor over a month now, ICXBTC is trading above the Ichimoku cloud. Beginning of the month it perfectly bounced back of the support of the cloud which is a bullish signal.
Now we are also seeing a MACD crossover incoming. When the MACD crossover is realised, I will be very bullish on Icon.
Another bullish signal is a rise above the Kijun Sen (blue line).
My targets will be:
1st: 0,00005526
2nd: 0,00006825

iExec breaking out. Big pump possible Currently RLCBTC is gaining a lot of momentum.
SMA 100
RLCBTC has tested the 100 SMA quite extensively over the last month. After it broke out downward of the Ichimoku cloud beginning of september we were negative on the performance of iExec. But the SMA 100 was succesfully tested.
Potential MACD crossover coming up
A bullish crossover occurs when the MACD turns up and crosses above the signal line. The Blue Line is now at equilibium and when it crosses the orange line iExec will gain a lot of momentum.
The Kijun Sen
The Kijun Sen (blue line) gives a bullish signal since it is now trading above it.
All and all the signals are looking good but RLCBTC first has to conquer the bottom of the Ichimoku cloud before it can go to its old highs.

Long QTUMXBTOscillator crossing oversold levels back into the bullish control zone, RSI EMA has a nice upward slope. Price action bounced nicely off of the 200 EMA, SSL has flipped Green, and VWAP has just crossed back about the mid line while money flow is in the positive. Looking for another small move, but mostly testing out a new strategy. Lets go!

$SPX under $3350 zone ~ bearish for $BTC (bitcoin)below $3350 and looking bearish ~ imo
$BTC will fall with $SPX


$LINK / $USD - (the road back to $20)Good morning (please hit that like button if you like the visuals and perspective i'd painted in this TA)
My visuals for $LINK / $USD.
Post an update on this chart tomorrow or the next day with progress.

Bitcoin entry in Re-accumulation's cycle marketIn the long-term, Bitcoin show a interesting cycle of re-accumulation to continue bought throught the 2020, and also we could to formed a consolidation between the $10,191 USD and $12,000 USD, that is a data that I could to show you and believe it.
But remember that technical analysis in micro-trend we could to experiment and know what Bitcoin do in short-term while the candlestick's studies and supply and demand zones.
Also guys, I invited you to look out my old technical analysis of the future of Bitcoin, it's so interesting to know the model that I prepared for you!!! And the Gold.

Bitcoin close to 10000,00Firstly, please support our work by clicking like button & or following! These really assist us to reach more investors & traders like you! Bitcoin slides below 10K. At current levels technicals are on the side of bears.

Ethereum is continue bullish: Updates!!!
Maybe as learing, that could be to put a buy order limit at $418 USD, that is the strategy but as I entry so up in the $425 USD, Ethereum take my SL and then, while I sleeping in the 3 am in the US Eastern Time, in the New York session, this hour I am sleeping, but I re-entry and recover all my net loss.
But, the proyection is that Ethereum is goes to the $$440 USD and I'm in long.

Bitcoin lead to EthereumHello, in this analysis, Ethereum show a bearish signal, we have the same situation of what Bitcoin do. I see a bearish BAT, also, more interesting to make it. Ethereum is into this descedent triangle in formation
It's seem a possible reversal of the trend and then, we could see an Ethereum on the $338 USD in short-term.
So, I put another short position in this cryptocurrency.
I'm in short in Ethereum and Bitcoin, because we could see a drop, more important is to watch about more Bitcoin price action

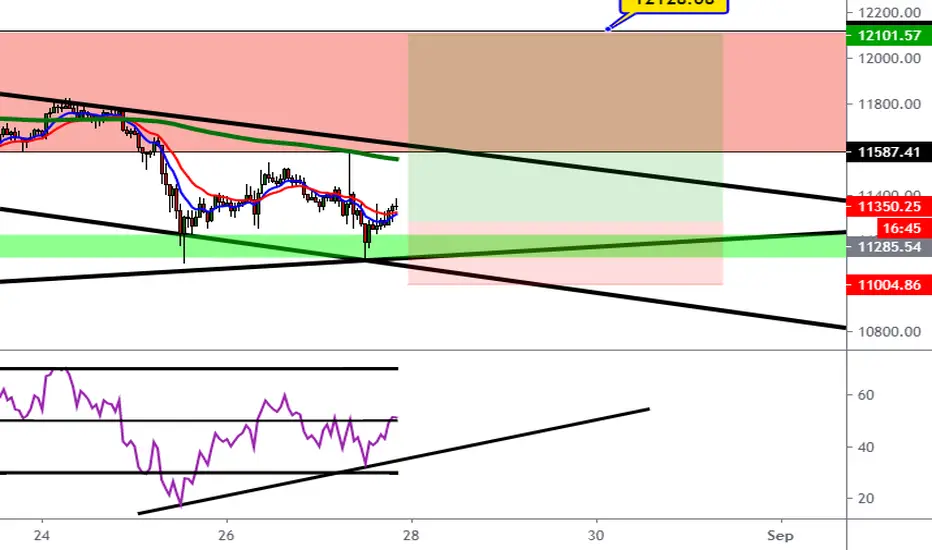
Updates: Bitcoin show a momentum change of sentiment: Bullish!!!Hello, in this updated we see that Bitcoin show a support at the levels of $11,100 above, that mena that boughters are here defend the zone to make a Bitcoin continue in this trend. Also, as updated in my technical analsyis, I identify a formation of ascendent triangle in H4 timeframe, that in the pass was a bearish rising wedge, now a bullish channel, also, there will be a possible formation of bullish divergence so positively and double top, that is a bullish signal to buy and then, closed up shorts position to put long order above of $11,300 USD, I put my buy order limit at $11,320 USD.
As we are in this little descendent channel, the expectative is so bullish of then
Also, there are a good signal in the Hourly timeframe, that is H4 and H1 timeframe show us a bullish divergence so perfectly!!!
Well, in conclusion I believe that Bitcoin want to make a up of $12,000 USD, and then, we need to look out if Bitcoin could to pass above of $!2,000 USD, that is a indication of bull signals.
I zoom out, buf if you want, you can to zoom up to see so nearly in your eyes, I put it to watch so better for you!!!
So, the short position I will closed up manually!!!
Elliott Wave VIDEO: Is Bitcoin Ready For A Deeper PullbackGood morning traders,
We have seen some reversal down from the high in the last few days, so I am wondering if BTCUSD is maybe headed down for a deeper pullback.
Hope you will enjoy the video. And please press like and leave us a comment below to support our work.
Trade well,
Grega
