CTSI About to Explode or Fakeout Incoming?Yello Paradisers is CTSI finally ready to break out, or are we looking at another trap to wipe out emotional traders?
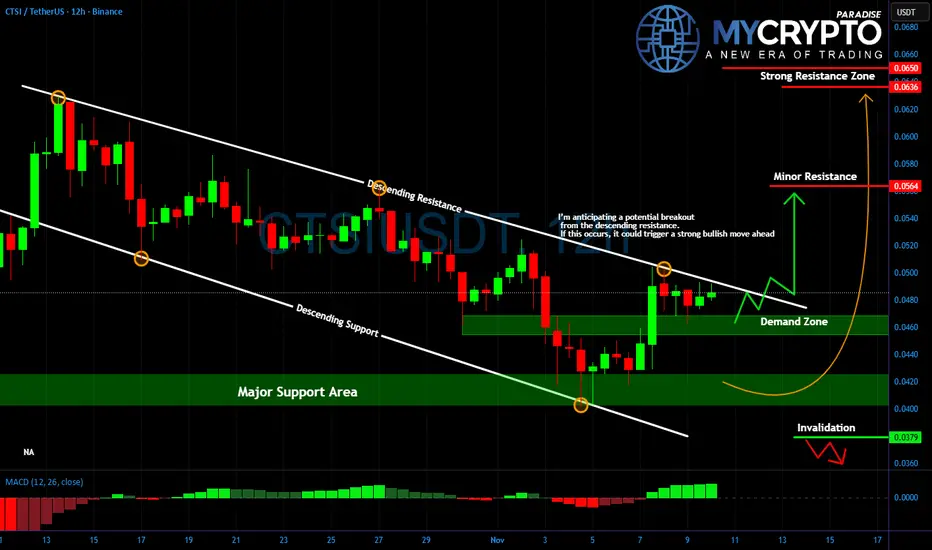
💎#CTSIUSDT has been moving inside a clean descending channel, respecting both support and resistance levels. The price recently bounced strongly from the key demand zone around $0.041 to $0.044, showing clear signs of accumulation. Now, price is approaching the descending resistance, where a confirmed breakout could change the game entirely.
💎A clean break and daily close above the $0.050 level would likely trigger bullish momentum, with short-term upside toward the 0.056 area. If this level gets cleared, the real target lies at 0.063 to 0.065, which marks a strong resistance zone and a likely exit area for smart money.
💎However, it's important to stay focused. Until the breakout is confirmed, this move remains unverified. Many traders get caught in fakeouts by rushing in too early. A move below $0.0379 would invalidate the bullish setup entirely, and at that point, the bias shifts back to the downside.
Discipline, patience, robust strategies, and trading tactics are the only ways you can make it long-term in this market.
MyCryptoParadise
iFeel the success🌴
Ctsibtclong
CTSIUSDT Forming Bullish PennantCTSIUSDT is currently forming a bullish pennant pattern, a strong continuation setup that often signals an upcoming breakout. After a healthy upward rally, the price has entered into consolidation, creating a pennant structure with tightening price action. This type of formation, especially when supported by solid trading volume, typically precedes a sharp bullish move, making CTSIUSDT an exciting coin to watch in the short term.
The technical outlook suggests that once CTSIUSDT breaks out of this pennant, the price could surge significantly, potentially delivering 90% to 100%+ gains. Market participants are already showing interest, with volume remaining steady, a clear indication that buyers are positioning themselves for the next leg up. Historically, bullish pennant breakouts attract heavy momentum and can lead to rapid gains within a relatively short period.
Investor sentiment around CTSI is improving, as more traders recognize its potential during this consolidation phase. The tightening range is also reducing volatility, which often leads to a powerful expansion once the breakout occurs. If momentum continues to build, CTSIUSDT could target higher resistance levels quickly, validating the bullish pennant pattern and rewarding early investors.
Overall, CTSIUSDT is shaping up to be one of the stronger setups in the market right now. With a bullish pennant pattern, good trading volume, and increasing investor attention, the technicals align with the potential for a strong upside rally. Traders and investors should keep this pair on their watchlist as the breakout opportunity approaches.
✅ Show your support by hitting the like button and
✅ Leaving a comment below! (What is You opinion about this Coin)
Your feedback and engagement keep me inspired to share more insightful market analysis with you!

CTSIUSDT Forming Bullish MomentumCTSIUSDT has recently broken out of a long-standing resistance zone with a strong bullish impulse, confirming a breakout that has caught the attention of many traders and analysts. The price action reflects a clear bullish structure, and the breakout from the accumulation range is supported by significant volume—an early sign of strong market conviction. This technical development sets the stage for a potential rally targeting a projected gain of 90% to 100%+ in the coming weeks.
The momentum behind CTSI is building, and this rally isn’t just speculative—it’s backed by volume and structure. Price has pushed through previous consolidation levels and flipped them into potential support, which could act as a launchpad for the next leg up. With altcoins starting to gain traction across the market, CTSI is emerging as one of the more promising setups among mid-cap crypto pairs.
Market interest is clearly shifting toward CTSI as investors and traders begin to recognize its breakout potential. The chart structure, momentum, and renewed interest all suggest that this coin may be entering a new phase of price discovery. If the bullish momentum continues, we could see rapid gains and possibly a parabolic move in the short term.
✅ Show your support by hitting the like button and
✅ Leaving a comment below! (What is You opinion about this Coin)
Your feedback and engagement keep me inspired to share more insightful market analysis with you!

CTSIUSDT Analysis: Patience is KeyBuyers are currently active in CTSIUSDT, but it’s wise to wait for the blue box, which represents a meaningful demand zone.
Key Insights:
Active Buyers: Although there’s buying activity, the blue box offers a safer entry with better risk-reward.
Market Conditions: Waiting for lower levels is a calculated approach given current market risks.
Confirmation Checklist:
When trading the blue box, I will confirm using:
Cumulative Delta Volume (CDV)
Liquidity Heatmap
Volume Profile
Volume Footprint
Upward Market Structure Breaks on Lower Time Frames
Learn Advanced Trading Techniques:
Interested in mastering CDV, liquidity heatmaps, or volume profiles? DM me for personalized guidance.
Final Words:
Patience and discipline are key in current market conditions. Let’s trade smart and stay safe!
If you think this analysis helps you, please don't forget to boost and comment on this. These motivate me to share more insights with you!
I keep my charts clean and simple because I believe clarity leads to better decisions.
My approach is built on years of experience and a solid track record. I don’t claim to know it all, but I’m confident in my ability to spot high-probability setups.
If you would like to learn how to use the heatmap, cumulative volume delta and volume footprint techniques that I use below to determine very accurate demand regions, you can send me a private message. I help anyone who wants it completely free of charge.
My Previous Analysis (the list is long but I think it's kinda good : )
🎯 ZENUSDT.P: Patience & Profitability | %230 Reaction from the Sniper Entry
🐶 DOGEUSDT.P: Next Move
🎨 RENDERUSDT.P: Opportunity of the Month
💎 ETHUSDT.P: Where to Retrace
🟢 BNBUSDT.P: Potential Surge
📊 BTC Dominance: Reaction Zone
🌊 WAVESUSDT.P: Demand Zone Potential
🟣 UNIUSDT.P: Long-Term Trade
🔵 XRPUSDT.P: Entry Zones
🔗 LINKUSDT.P: Follow The River
📈 BTCUSDT.P: Two Key Demand Zones
🟩 POLUSDT: Bullish Momentum
🌟 PENDLEUSDT.P: Where Opportunity Meets Precision
🔥 BTCUSDT.P: Liquidation of Highly Leveraged Longs
🌊 SOLUSDT.P: SOL's Dip - Your Opportunity
🐸 1000PEPEUSDT.P: Prime Bounce Zone Unlocked
🚀 ETHUSDT.P: Set to Explode - Don't Miss This Game Changer
🤖 IQUSDT: Smart Plan
⚡️ PONDUSDT: A Trade Not Taken Is Better Than a Losing One
💼 STMXUSDT: 2 Buying Areas
🐢 TURBOUSDT: Buy Zones and Buyer Presence
🌍 ICPUSDT.P: Massive Upside Potential | Check the Trade Update For Seeing Results
🟠 IDEXUSDT: Spot Buy Area | %26 Profit if You Trade with MSB
📌 USUALUSDT: Buyers Are Active + %70 Profit in Total
🌟 FORTHUSDT: Sniper Entry +%26 Reaction
🐳 QKCUSDT: Sniper Entry +%57 Reaction
📊 BTC.D: Retest of Key Area Highly Likely
I stopped adding to the list because it's kinda tiring to add 5-10 charts in every move but you can check my profile and see that it goes on..

#CTSI/USDT#Ctsi
The price has been moving in a descending triangle since April 2022
It adheres to its limits to a large extent, and we are now on the verge of breaking it higher
With upward momentum supporting this
And strong support areas
Current price 0.2272
First target 0.2855
Second target 0.3665
Third target 0.4545

$CTSI/#BTC [#Cartesi]: Resistance_BreakoutHey traders, Hey traders, Hey traders, we've identified a Resistance Breakout on the $CTSI / $BTC chart. The price has broken above a key resistance level, which can indicate a potential bullish trend. Taking in consideration the next resistance key levels are at 0.00000694 | 0.00000736 | 0.00000819 and the major support zones are respectively at 0.00000611 | 0.0000057 | 0.00000487. It is a bullish indication and we may consider entering at the current price zone at 0.00000689 and targetting higher levels.
Technical Metrics :
Current price: 0.00000689
24H Volume: 3.1871 Ƀ
24H Price change: 2.53%
- Pivot Points - Levels :
Resistance: 0.00000694 | 0.00000736 | 0.00000819
Support: 0.00000611 | 0.0000057 | 0.00000487
Indicators recommandation :
Oscillators: NEUTRAL
Moving Averages: STRONG_BUY
Technical Indicators Summary : BUY
- In-depth CTSIBTC technical analysis on > Tradingview TA page

CTSIUSDT Price Reversing From Its Major Support ZoneCTSIUSDT Technical Analysis Update.
CTSI price revering from its major support zone.
Buy zone : $0.142- $0.149
Stop loss : $0.125
Target 1 : $0.165
Target 2 : $0.190
Target 3 : $0.246
Always keep stop loss
Thanks
Hexa

CTSI Moon $5 Target EOY PREDICTION Charted this out couple weeks ago and it played out the wedge as I assumed it would. HOLDING THE .786 FIB will make $2 by end of month possible. If not I see CTSI breaking down too the .5 FIB which needs to be held if this coin will be anywhere in this bull run. The wedge of this coin on the weekly is insane so now the direction this coin now realize on the upcoming news announcement and catalysis.
TARGET 1: $2.5
TARGET 2: $3
Target 3: $4
Target 4: 5.4
Target 5: 6.25

ctsi/usdtThis is one of my favorite projects and I expect it not to break the dynamic trend line and move upwards.

Ascending Bullish triangle Ascending Bullish triangle already broken buying from 0.45 with SL below 0.37 would be enough to go through this scenario toward 1T 0.83 and we will follow up to see if we still target further levels

#CTSI/BTC Breaking out ready for Potential 85% Rally.Welcome to this quick altcoin setup.
CTSI is breaking out with all the strong fundamentals in the coming few weeks.
Expecting this one to perform well.
Technically it broke out of the triangle showing signs of accumulation at this price level.
ENTRY: 512 TO 540
TARGET:
687
715
845
937
SL : 467
DYOR before taking this trade.
Do hit the like button if you like my setups and 100% accurate BTC updates.
Thank you
#PEACE

CTSI breakout confirmed, Buy at RetestCTSI breaks the long resistance and now retesting it. CTSI is a Binance Launchpad project and we all see how launchpad coins are pumping. CTSI has very good fundamentals and a lot of developments and news are coming in the next few weeks. This is a good time to build your position in CTSI.
Buy Zone: 560-570
Target: 625-650-700-785-860-934-1035

#CTSI .. #Cartesi is forcing a breakoutPefect buy now...
We just retraced to golden ratio fib 0.618... we make breakout soon and we are ready for new ATH
Very good coin to just buy and hold...
Stacking is huge 189% APY
These prices will be history soon..
On 31 Mar big update for #CTSI
Now is 0.245$ .... easy 4x - 10x next weeks!!!
Enjoy!!!


CTSIBTCCTSI has ended its downtrend movement and recently its uptrend reversal has begun and we can expect a good growth of this coin from here.

#CTSI/BTC C& H Breakout 114% + Potential PROFITWelcome to this quick update everyone.
BTC Dominance is falling and this is a good opportunity to trade some altcoins.
CTSI is amonG the coins which haven't pumped much yet.
Currently it is breaking out of a Cup and Handle Pattern.
It also broke out of the long term Falling wedge pattern.
It also broke above 21D MA 50D MA and 200D MA.
ENTRY : 245 TO 271
Targets :
321
351
383
481
571
Stop Loss : 227
Do your own research before investing
Please hit the like button if you like my work and share your views in the comment section.
Stay safe
#PEACE

CTSI / BTC - Is Cartesi printing a double bottom?Relatively new coin on Binance, not much history to go on. Marketcap is at 7.2 mln USD, volume has been super low - less than a million per day, ~198 million coins in circulation.
Seems like this has a lot of room to grow, let's see if it happens, a little volume could go a long way and very quickly.

$CTSI looks like a BUY opportunity on CARTESIWhen Alts start to grow again after BTC consolidation, expect huge profits on this like gem.
Looks like a ascending channel with $CTSI on the bottom now. Testing and bouncing soon.

CTSI is Your Next Bitcoin Multiplier Long Cartesi 100% BTC GainCTSIBTC pairings went up post $12,000 BTC rejection. Great Sign. CTSI target is .00001 BTC

CTSI BULLISH CONTINUATIONafter nice btc run most alts dropper about 20-40%, those with strong bounces should have good future ahead, one of them is Cartesi which is binance DEFI IEO. Verry bullish, gives me personally Link vibes


CTSIUSDTWe are testing long time ressistance here.
We all know Ctsi has low MC.
We are just waiting for some good volume(news) to at least see %10 after breaking ress.
Btc pair moves almost same too.
We just need a little push to fallow other binance coins ^^
