Breakout - Cup & Handle Pattern!FATIMA Analysis
Closed at 162.15 (16-01-2026)
Beautiful Breakout from 155 - 156 level
Cup & Handle Pattern also appeared.
Upside Targets seems to be around 180+
& then around 210+
However, now if 152 is broken, we may
see a Good Support around 150ish.
Cupandhandlebreakout

Beautifully making HH HL.15-01-2026
Beautifully making HH HL.
253 - 255 is an Immediate Resistance,
crossing this level may lead it to our
old targets of 290 - 293.
Important Support zone 240 - 243

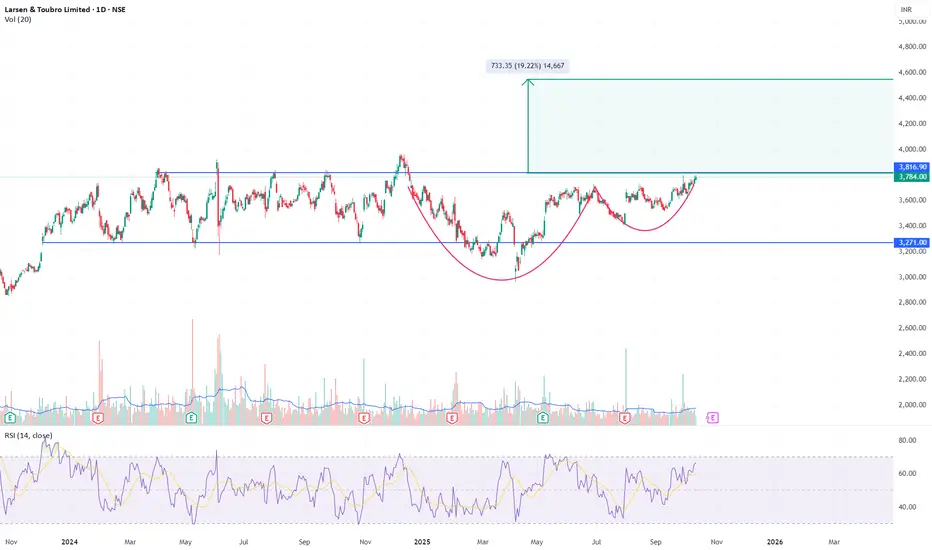
L&T - Cup and Handle Formation Near Breakout ZoneChart Structure:
Larsen & Toubro is forming a textbook Cup and Handle pattern that’s now testing its neckline around ₹3,780–₹3,800. The base extends nearly 10 months, creating a strong accumulation structure with a shallow handle - ideal for a breakout continuation.
Technical Highlights:
Cup Base: ₹2,950–₹3,000
Neckline: ₹3,780–₹3,800 (currently being tested)
Handle: Tight consolidation with declining volume, now showing early expansion
RSI: Rising towards 70, confirming strengthening momentum
Volume: Reaccumulation behavior - lighter on corrections, heavier on upswings
Trade Setup:
Breakout Confirmation: Close above ₹3,820 with strong volume
Target: ₹4,500–₹4,550 (≈19% upside from breakout)
Stop-Loss: ₹3,600 (below handle low)
Technical Verdict:
A sustained move above ₹3,820 would mark a major bullish continuation, potentially initiating a new leg in L&T’s long-term uptrend. Pattern reliability is high given the depth, duration, and structure of the base.
Disclaimer:
This analysis is for educational and informational purposes only and does not constitute investment advice or a recommendation to buy or sell any security. Markets involve risk, and past performance does not guarantee future results. Conduct your own due diligence or consult a qualified financial advisor before making investment decisions.
Beautiful Cup & Handle formation.ILP Analysis
Closed at 84.49 (09-01-2026)
Beautiful Cup & Handle formation.
Crossing & Sustaining 84 - 86 may lead it
towards 100 & then 120+.
Immediate Supports seem to be around 83
& then around 75 - 76.

TAOUSDT | Bullish Cup & Handle..Still in PlayHello traders,
This is a constructive price action. I'm expecting a perfect C&H formation here on TAO. I think price will tap the $305 range, then a small correction will follow.
As long as price holds above the support, structure remains valid.
Projected target = cup depth, which aligns with the $370–375
Good Luck
If you find value in this content, a like supports more than anything🙏📊
Also, leave your comments and thoughts below

$AES: Powering the AI Revolution with a Cup & Handle BreakoutThe Bull Case Description
Technical Setup: The Cup and Handle Breakout AES has spent the last several months building a large, rounded "Cup" base, followed by a tight, downward-sloping "Handle" that has successfully stayed in the upper half of the pattern.
Fundamental Bull Case: The "AI Power" Catalyst
Data Center Dominance: AES is the #1 global seller of renewable energy to corporations. It currently has 8.2 GW in signed power purchase agreements (PPAs), specifically targeting the exponential power needs of AI hyperscalers.
Clean Energy Pivot: The company is on track to triple its renewables capacity by 2027 and exit the majority of its coal generation by the end of 2025. This makes it a primary beneficiary of the "Clean, Firm, and Fast" power demand shift.
Financial Stability: Despite a higher debt-to-equity ratio, AES offers a strong 4.9% dividend yield and is projected to see an 8.4% EPS increase in 2026.
Institutional Support: High-tier analysts like Argus and Morgan Stanley have recently upgraded the stock to "Buy," citing its leadership in battery storage and energy transition.
The Verdict: AES represents a rare combination of Deep Value (P/E of ~9.0) and High Growth (AI energy demand). When the technical "Handle" breaks, the institutional rotation into "Energy for AI" should provide the fuel for a multi-month rally.

Struggling to Breakout.LUCK Analysis
CMP 497.31 (05-01-2026)
Struggling to Breakout.
Immediate Resistance is around 525 - 530
Crossing this level with Good Volumes may
lead it towards 550 - 560 & then 600.
However, breaking 420 may bring more selling pressure.
Good Supports seem to be around 480 - 485 & then 450 - 460

EURUSD breaks higher: Fed-ECB path to drive 3rd wave to 1.19?EURUSD is trading above 1.17 on the 4-hour chart after the dollar fell to a 2-month low following Wednesday's Fed rate cut. With a potential running triangle breakout in play and a dovish Fed facing a stable ECB, the pair is eyeing the 2025 high at 1.1920 and potentially new peaks into 2026.
In this video, we break down why Powell's dovish tone and a deeply divided Fed are narrowing the rate differential with the ECB, which might upgrade growth and proceed with no cuts in 2026. Then, we map out the wave structure: a potential 3rd wave impulse targeting 1.18–1.19, with buy-the-dip zones at 1.17 and 1.1650, and larger projections toward 1.2020–1.2220 from a cup-and-handle pattern.
Key drivers
Fed cut and Powell dovish: The Fed cut rates on Wednesday, where Powell emphasised a "wait-and-see" mode, pretty much ruling out hikes in 2026; markets now price two more cuts despite the official dot plot projecting only one.
Deeply divided Fed: The December dot plot showed four members see no cuts in 2026, four see one, four see two, and three expect rates below 3% by year-end 2026, while three actually wanted to hike — No consensus.
ECB stability and growth upgrade: ECB President Lagarde said the eurozone economy shows "remarkable strength" and the ECB may upgrade growth forecasts at the December 18th meeting, with policy in a "good position" (i.e., no cuts).
Rate differential narrowing: The Fed is at 3.50–3.75% and cutting, the ECB is at 2.00% and on hold. Markets now price only a 45% chance of an ECB cut by September 2026, narrowing the spread in favour of the euro.
Technical structure : EURUSD has broken out of a running triangle with a breakout level around 1.1580–1.1600. The current leg appears to be a third-wave impulse targeting 1.18–1.19, with a larger cup-and-handle projection pointing to 1.2020–1.2220.
Trade plan : Buy pullbacks into 1.17 (50% Fibonacci retracement) or 1.1650 (deeper support) with a stop below 1.1580, targeting 1.18, 1.19, and potentially 1.20+; invalidation below 1.1580 would suggest a corrective structure instead.
Trading the EURUSD breakout? Share your entry levels and wave counts in the comments and follow for more Fed-ECB divergence and technical trade setups.
This content is not directed to residents of the EU or UK. Any opinions, news, research, analyses, prices or other information contained on this website is provided as general market commentary and does not constitute investment advice. ThinkMarkets will not accept liability for any loss or damage including, without limitation, to any loss of profit which may arise directly or indirectly from use of or reliance on such information.

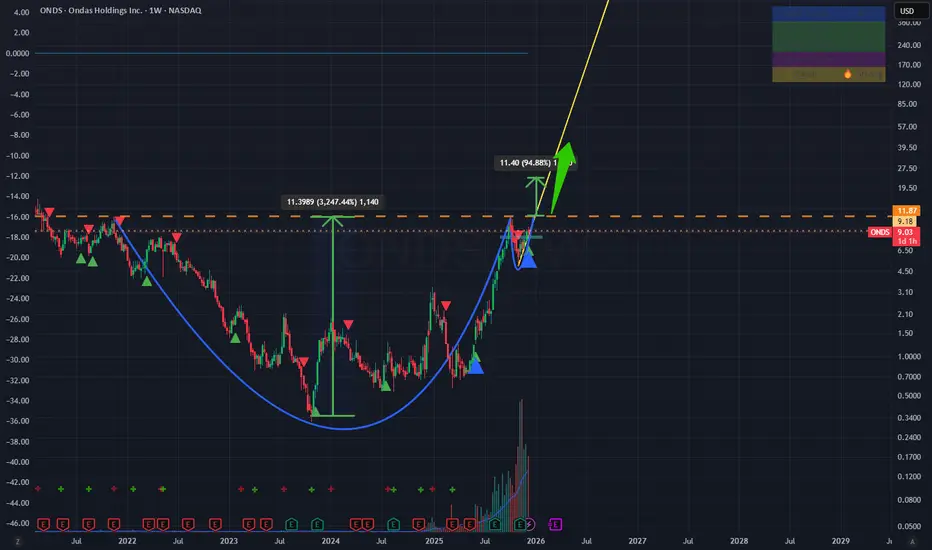
ONDS:Cup & Handle Breakout | Institutional Accumulation DetectedInstitutional Accumulation Detected: ONDS is Waking Up.
We are looking at a textbook technical setup on the weekly timeframe. After a multi-year consolidation phase, ONDS has completed a massive Cup and Handle pattern. This setup offers a highly asymmetric risk/reward opportunity.
Here is the professional breakdown of why this stock is primed for a major trend reversal.
1. The Technical Thesis: "The Perfect Storm"
The Structure: The stock has spent over 24 months carving out a massive base ("The Cup"). The recent pullback was the "Handle" – a classic shakeout of weak hands before the real move.
Volume Confirmation 📊: This is the most bullish signal. The breakout is supported by massive volume bars , indicating that institutions and "Smart Money" are accumulating shares aggressively. Price confirms, but volume validates.
Trendline Support: The stock is respecting a pristine ascending trendline (Yellow Line on chart). As long as price holds above this dynamic support, the bullish trend is intact.
2. The Fundamental Catalyst
Technical breakouts rarely happen in a vacuum. The market is pricing in a major shift in ONDS's business cycle – moving from R&D to commercialization . With the growing demand for autonomous drone solutions in defense and critical infrastructure, the market is realizing that this asset is significantly undervalued relative to its growth potential.
🎯 Trade Setup & Targets
Trigger: The breakout above the $9.00 psychological level is our confirmation.
Target 1 (Conservative): $13.00 (Testing historical supply zones).
Target 2 (Pattern Projection): $18.00 - $20.00 (Measured move based on the depth of the Cup).
Stop Loss (Invalidation): A weekly close below the ascending trendline (approx $7.50 ) would invalidate the bullish thesis.
💡 Conclusion
The charts don't lie. We have Price Action + Volume + Fundamentals all aligning at the same time. This is a high-probability setup for a substantial move upward.
________________________________________
Disclaimer: This idea is for educational purposes only and does not constitute financial advice. Always manage your risk.
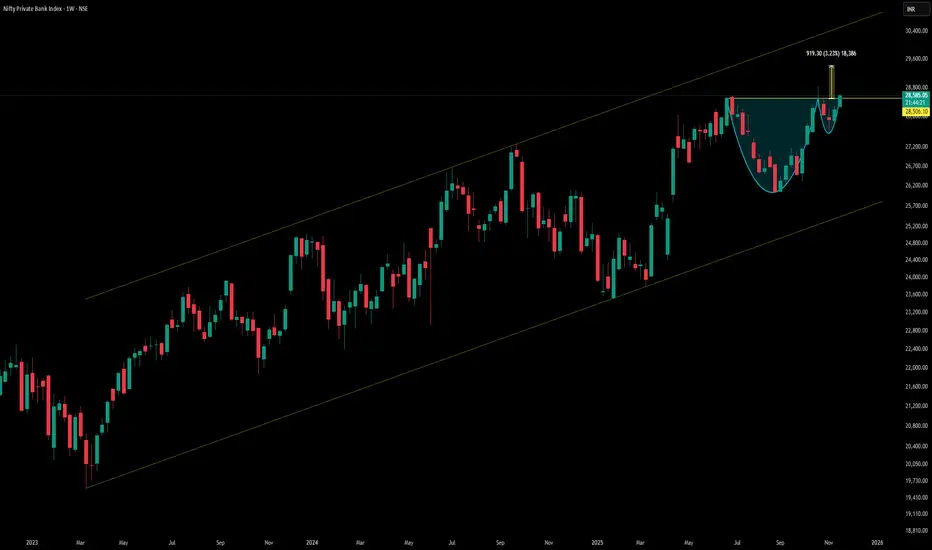
Nifty Private Bank confirms a classic Cup and Handle patternThe Nifty Private Bank chart shows a bullish Cup and Handle breakout — signaling upside in top private banks like HDFC Bank, ICICI Bank, Axis Bank, Kotak Mahindra Bank, and IndusInd Bank. These stocks are likely to lead the rally.
Cup: Rounded bottom formed over weeks/months, showing accumulation.
Handle: Shallow pullback or sideways drift, indicating consolidation before breakout.
Breakout: Above resistance with volume, projecting a 10.31% upside from the breakout level.
This setup is a strong bullish continuation signal, especially when backed by sector-wide momentum.
Top Nifty Private Bank Stocks to Watch
These are the official constituents of the Nifty
HDFC Bank & ICICI Bank: Largecap leaders with strong Q2 earnings and institutional flows.
Axis Bank & Kotak Bank: Showing breakout setups and improving loan growth.
IndusInd & IDFC First: Mid-tier banks with rising ROE and margin expansion.
⚠️ Disclaimer
This analysis is for educational purposes only and does not constitute investment advice. Market conditions can change rapidly, and chart patterns do not guarantee future performance. Please consult your financial advisor before making any investment decisions.
#BSE - Cup & Handle BO in DTFScript: BSE
Key highlights: 💡⚡
📈 Cup & Handle BO in DTF
📈 Volume spike seen during Breakout
📈 MACD Bounce
⚠️ Important: Always Exit the trade before any Event.
⚠️ Important: Always maintain your Risk:Reward Ratio as 1:2, with this RR, you only need a 33% win rate to Breakeven.
✅Like and follow to never miss a new idea! ✅
Disclaimer: I am not SEBI Registered Advisor. My posts are purely for training and educational purposes.
Eat🍜 Sleep😴 TradingView📈 Repeat 🔁

Silver forming a long-term “Cup and Handle” - as Gold didSilver seems to be repeating the same institutional “Cup and Handle” structure that we recently saw play out perfectly on Gold.
On Gold, the price completed the entire measured move — equal to the depth of the cup — before entering consolidation.
Now, Silver is building a very similar long-term formation, and this setup could define the market direction for the next several years.
🧠 Technical Context
On the higher timeframes (1W and 1M), Silver has formed a clear rounded base — the cup.
The current consolidation area represents the handle, and price is now approaching the upper boundary of that handle.
Once we see a decisive breakout above the handle resistance, institutions will likely defend that zone on the first retest.
This pattern is one of the most reliable continuation formations in long-term trends, especially when accompanied by rising volume near the breakout area.
There’s a very important condition: this pattern becomes active only after the handle breakout.
Before the breakout, it’s just an unconfirmed structure — the pattern is validated only once the handle level is broken.
🎯 Trade Plan
Breakout Level (Handle Resistance): around $50.0 – $51
Usually, the breakout happens on high volume, accompanied by several strong bullish candles
Retest Zone: $30 – $35.0
Target (long-term extension): $600.0+
Stop-Loss: according to your risk management strategy
📊 Summary
If Silver repeats the Gold scenario, we might see a clean breakout–retest–continuation structure with very limited pullbacks once the move begins.
This could mark the start of a multi-year bullish phase in silver.
I’ll be monitoring the breakout confirmation and volume profile closely before entering.
Once confirmed, the upside potential looks substantial compared to the risk.
This is not financial advice. For educational purposes only

Cup and Handle Breakout On Natural GasNatural Gas price formed a smooth rounded base, a classic cup pattern.
Then, the breakout came with a strong bullish candle, confirming momentum has shifted fully in favor of the bulls.
After this breakout, we can expect a brief pullback.
As long as price holds above the breakout zone, the structure remains bullish.
The next leg higher is anticipated to target the 4.100 area, completing the measured move of the pattern.
In short, buyers are in charge, and this breakout looks ready to extend further.

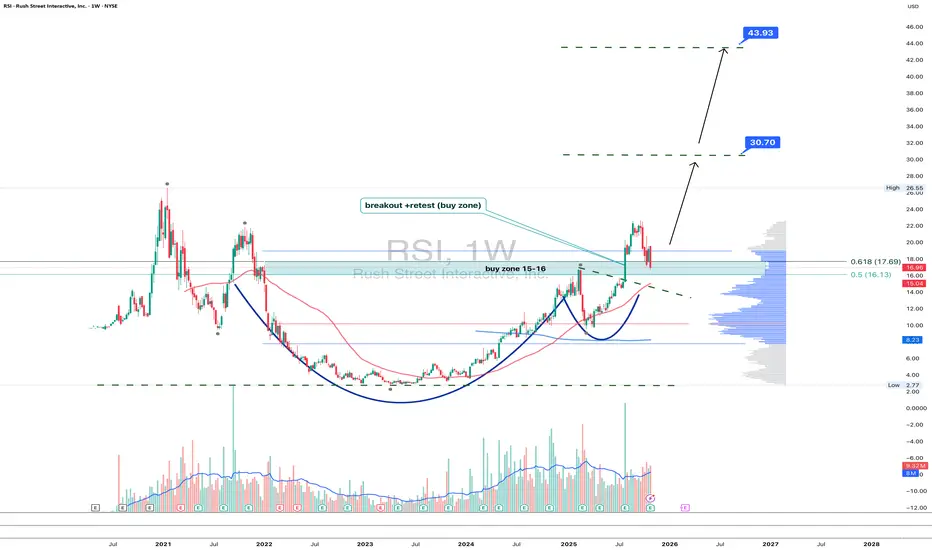
RSI 1W - gambling or smart retest?Rush Street Interactive (RSI) just confirmed a breakout above the 15–16 zone with a textbook retest - a classic bullish setup. The weekly chart shows a clean “cup and handle” structure backed by rising volume. Current pullback is forming right inside the buy zone, suggesting potential continuation.
Fibonacci extensions highlight 30.7 and 43.9 as key upside targets. As long as price holds above 15.5–16.0, the bullish bias stays intact. A breakout above 18.0 would confirm the next leg higher.
Fundamentally , RSI benefits from ongoing online gambling legalization across the US and improving profitability in core states, which could attract institutional inflows.
In the gambling world, luck rarely repeats - but this chart looks like the house might finally lose.
Beautiful Cup & Handle on Bigger tf.BWHL Analysis
Closed at 192.54 (25-09-2025)
Beautiful Cup & Handle on Bigger tf.
Crossing & Sustaining 196 may lead
it towards 300 - 350.
97 should be last hope that should not break in any case.

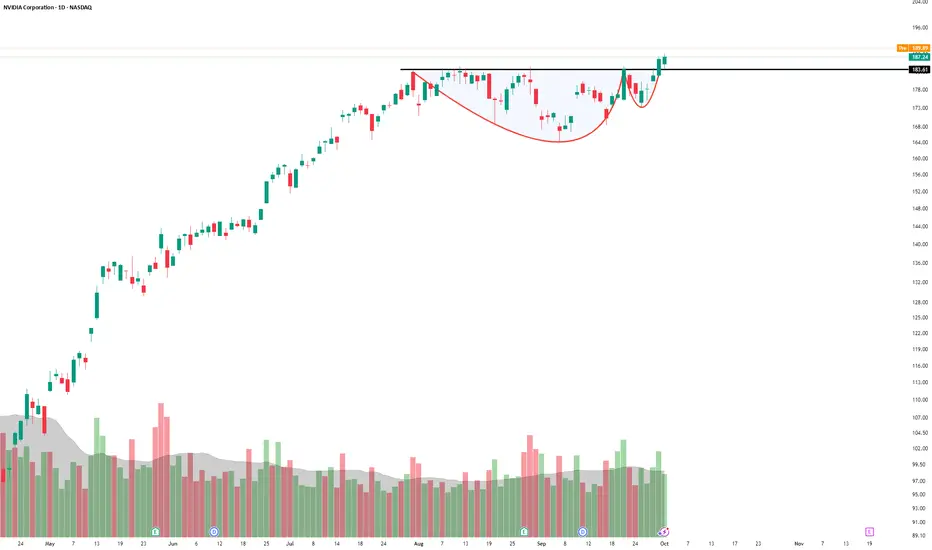
NVDA Breaking Out ... Yet Again!NASDAQ:NVDA is just unstoppable. It broke out again from this base which can also qualify as a cup and handle (C&H) continuation. Going by the size of pattern, it could very well he hitting 200 soon, though exact size comes at around 205.
Will Ethereum lead next Altseason? ETF & Fusaka update in focus!Ethereum ETFs have recently seen significant inflows, outpacing Bitcoin ETFs, just ahead of the upcoming Fusaka upgrade in November.
Ethereum recently broke above its previous record high, a move that was anticipated in earlier analysis, and is pulling back before shooting higher. For a sustained move higher, a strong breakout with increased volume and momentum is needed. There are signs of momentum exhaustion, so traders should watch for confirmation before expecting further upside.
A classic cup and handle formation opens the door to $6,200 if resistance is cleared, with key support at $4,115 (previous resistance now acting as support) and a deeper pullback exposing $3,500. But this would not necessarily change the long-term bullish outlook.
Indicators to Watch
Bitcoin Dominance:
Bitcoin’s market dominance is currently around 55%, suggesting the market is still Bitcoin-led, and a true “altseason” may be at its early stage.
Total Crypto Market Cap:
Watch for breakouts in the total crypto market cap (TOTAL3 - excluding Bitcoin and Ethereum) and the formation of bullish patterns for confirmation of a broader market uptrend.
Altcoin Season Index:
The index remains below the threshold for a full altseason but is rising, indicating that Ethereum and other altcoins are not broadly outperforming Bitcoin but are nearing breakout.
Short/Medium-Term Outlook:
Expect continued consolidation or a possible pullback before any sustained move higher if support above $4,115 holds firm.
Long-Term Outlook:
As long as Ethereum holds above the 50% retracement level, the long-term trend remains positive. A confirmed breakout above resistance could signal the next major upward phase.
This content is not directed to residents of the EU or UK. Any opinions, news, research, analyses, prices or other information contained on this website is provided as general market commentary and does not constitute investment advice. ThinkMarkets will not accept liability for any loss or damage including, without limitation, to any loss of profit which may arise directly or indirectly from use of or reliance on such information.

ENIC: Can You Ignore This Massive Cup And Handle?ENIC (Enel Chile S.A.) is a Chilean utility company primarily engaged in the generation, transmission, and distribution of electricity. A key player in the Chilean energy sector, the company focuses on serving residential, commercial, industrial, and government customers.
Technical Analysis
ENIC's chart exhibits a classic " cup and handle " pattern, a bullish continuation formation that signals a potential for a significant upward move.
Understanding the Cup and Handle Pattern
The cup and handle pattern, developed by William J. O'Neil, is a technical chart pattern that looks like a teacup with a handle. It is considered a bullish signal and is formed after an uptrend, indicating a period of consolidation followed by a continuation of the upward movement.
The "Cup": The cup is a rounded, "U" shaped formation that shows a price drop, a stabilization period at the bottom, and a rally back to the original price level. A rounded bottom is preferred over a sharp "V" shape, as it indicates a more stable consolidation.
The "Handle": The handle is a smaller, downward-sloping or sideways consolidation that forms on the right side of the cup. It represents a period of profit-taking by early buyers before the next leg of the rally.
ENIC's Current Setup
The chart shows the formation of a well-defined cup and handle pattern. The neckline, which is the resistance level at the top of the cup, is identified between $3.44 and $3.50.
Breakout Confirmation: Traders should monitor the price for a clean breakout above this neckline on strong volume. A breakout would confirm the pattern and signal a potential move to the upside.
Measured Move Target: The measured move of the cup and handle pattern, which is calculated by taking the height of the cup and adding it to the breakout point, sets a first target price of $5.80. This would represent a 70% return from the current levels if the breakout is confirmed.
Fibonacci Extensions: For potential longer-term targets, Fibonacci extensions provide additional price levels to monitor:
Fibonacci Extension No. 1: $6.22
Fibonacci Extension No. 2: $7.20
Historical Performance
Since July 2022, ENIC has shown strong momentum, generating a 250% return for long-term investors. This impressive performance, combined with the current bullish chart pattern, suggests the stock could be poised for another significant move.
Sector: Utilities
Country: Chile
Suitable for long term investors
Disclaimer: This is a technical analysis based on chart patterns and is not financial advice. All trading involves risk. It is crucial to conduct your own due diligence and consider your personal risk tolerance before making any investment decisions.

PLTR still bullish - Cup n Handle patternPLTR in Cup and handle pattern, broke out.
The price closed on Friday is $131.78 (05.30.2025).
Desired entry price $127.88.
Target $147.58/ 164.99/ 183.41.
Stop loss $119.41.
IMO.

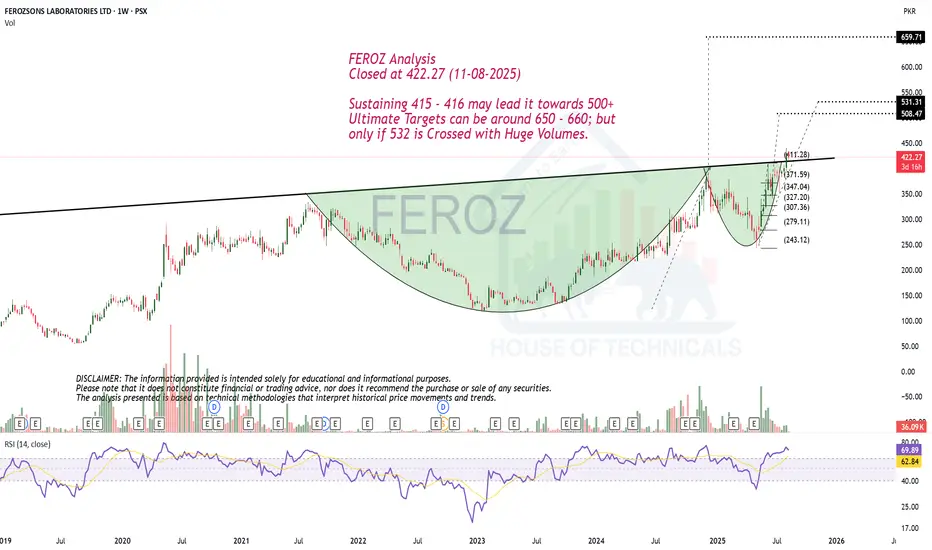
Beautiful Bullish PatternsFEROZ Analysis
Closed at 422.27 (11-08-2025)
Sustaining 415 - 416 may lead it towards 500+
Ultimate Targets can be around 650 - 660; but
only if 532 is Crossed with Huge Volumes.
BTC cup and handle: 128k soon?I see a nice cup and handle confirmed and broken up on the daily chart. If this is correct we could see 128k as a nice target. There’s still a resistance at 104k first, we’ll see after that.

Cup and handle patternBreaks cup and handle pattern and going up. Looks bullish. Make sure to do your own analysis and maintain your risk management. This is only for educational purposes
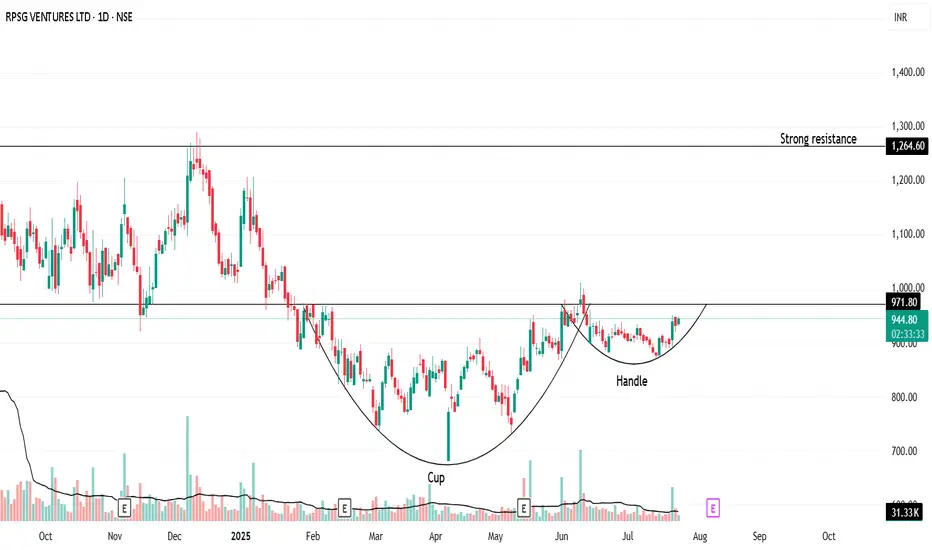
"Handle Tightening… Is RPSG Ready to Explode?"Once upon a trend, RPSG Ventures brewed a picture-perfect Cup & Handle—a structure born not out of coincidence, but crowd psychology and silent accumulation.
After nearly 9 months of consolidation, the stock crafted a deep, symmetrical cup (between November 2024 and May 2025). Traders forgot about it. Volumes dried. Hope faded.
But quietly, the handle formed—short, shallow, and tight. It’s not just a chart pattern—it’s a test of patience. And now, the breakout zone at ₹971.80 is like the rim of a boiling kettle: silent… until the whistle.
🧭 Possible Future?
If it breaks out: A rally toward ₹1,264 isn't just possible—it’s logical.
If it fakes out: Back to base, retest near ₹890.
💬 What makes this unique?
This isn’t just technical analysis. It’s a behavioral pattern. Fear, exhaustion, optimism—they're all baked into this structure. Cup & Handle isn’t bullish because of lines—it's bullish because it reflects crowd hesitation turning into confidence.
🚨 "Spill or Serve?" — comment below .
🧠 Watch the volume.
🛑 Don't jump the gun.
✅ Let the breakout come to you.
📜 Disclaimer:
This is not trading advice—this is pattern psychology in motion. Always consult your financial advisor before making real trades. This story is meant to provoke thought, not profits.