VITROX Cup & HandleTextbook Cup and Handle Setup.
Recent volume increasing. Expect breakout soon.
Prospect: In NVIDIA CEO Jensen Huang's keynote at COMPUTEX 2024, ViTrox was shown as a player of edge AI and robots in the factory ecosystem. We are proud to be an associate of the supply chain and are fully committed to delivering the most advanced, innovative and cost-effective vision inspection, AI and robotic solutions.
Disclaimer: Trade stock at your own risk. This post is for discussion purpose on technical analysis.
Cupandhandlepattern

Potential Cup & handlea cup and handle pattern in tata steel with good volumes
a target with 230 for short term


RTY / IWM Weekly: Cup & Handle Projection to $3280A classic Cup and Handle formation has developed on the weekly chart of the [b ]Russell 2000 (RTY) ; this structure is also visible on the IWM ETF.
My target is based on the depth of the Cup, which projects a measured move to $3280 . This represents a potential 24% upside from current prices.
Not Financial Advice. For educational purposes only.

Beautiful Cup & Handle formation.ILP Analysis
Closed at 84.49 (09-01-2026)
Beautiful Cup & Handle formation.
Crossing & Sustaining 84 - 86 may lead it
towards 100 & then 120+.
Immediate Supports seem to be around 83
& then around 75 - 76.

TAOUSDT | Bullish Cup & Handle..Still in PlayHello traders,
This is a constructive price action. I'm expecting a perfect C&H formation here on TAO. I think price will tap the $305 range, then a small correction will follow.
As long as price holds above the support, structure remains valid.
Projected target = cup depth, which aligns with the $370–375
Good Luck
If you find value in this content, a like supports more than anything🙏📊
Also, leave your comments and thoughts below

Breakout of Cup & Handle.NRL Analysis
Closed at 463.42 (08-01-2026)
Breakout of Cup & Handle.
It may retest its breakout level around 445 - 450.
Sustaining this range may lead it towards further
side targeting 500 & then 550+
Now it should not break 400, else we may witness
more selling pressure.

$AES: Powering the AI Revolution with a Cup & Handle BreakoutThe Bull Case Description
Technical Setup: The Cup and Handle Breakout AES has spent the last several months building a large, rounded "Cup" base, followed by a tight, downward-sloping "Handle" that has successfully stayed in the upper half of the pattern.
Fundamental Bull Case: The "AI Power" Catalyst
Data Center Dominance: AES is the #1 global seller of renewable energy to corporations. It currently has 8.2 GW in signed power purchase agreements (PPAs), specifically targeting the exponential power needs of AI hyperscalers.
Clean Energy Pivot: The company is on track to triple its renewables capacity by 2027 and exit the majority of its coal generation by the end of 2025. This makes it a primary beneficiary of the "Clean, Firm, and Fast" power demand shift.
Financial Stability: Despite a higher debt-to-equity ratio, AES offers a strong 4.9% dividend yield and is projected to see an 8.4% EPS increase in 2026.
Institutional Support: High-tier analysts like Argus and Morgan Stanley have recently upgraded the stock to "Buy," citing its leadership in battery storage and energy transition.
The Verdict: AES represents a rare combination of Deep Value (P/E of ~9.0) and High Growth (AI energy demand). When the technical "Handle" breaks, the institutional rotation into "Energy for AI" should provide the fuel for a multi-month rally.

BTC : This May Be Your Last Chance Before Exploding to Upside !!It can be said that if Bitcoin manages to break above 97k, it could easily reach 150k and begin new bullish waves.

Struggling to Breakout.LUCK Analysis
CMP 497.31 (05-01-2026)
Struggling to Breakout.
Immediate Resistance is around 525 - 530
Crossing this level with Good Volumes may
lead it towards 550 - 560 & then 600.
However, breaking 420 may bring more selling pressure.
Good Supports seem to be around 480 - 485 & then 450 - 460

Big Breakout Alert | IDBI BankIDBI Bank has formed a long-term Cup & Handle pattern since 2024 and has now confirmed a breakout with strong volume, indicating renewed bullish momentum.
Pattern: Cup & Handle (Long-term)
Breakout: Confirmed with heavy volume
Trend: Bullish structure intact
Key Support Zones:
Primary structure support near 90
Secondary support / breakout zone near 100
The breakout level may see a healthy retest if price shows short-term pullback.
Upside potential as per chart structure:
130
140–145 range
170 (extended target)
Weekly RSI has also given a breakout.
RSI is currently around 68, reflecting strong bullish strength and trend confirmation.

Cup & handle formation.SYS Analysis
CMP 170.45 (01-01-2026 02:19pm)
Cup & handle formation.
Important to Sustain 174 with Good Volumes.
Upside targets can be around 183 - 185 & then around 200.
However, breaking 160 may bring more selling pressure.

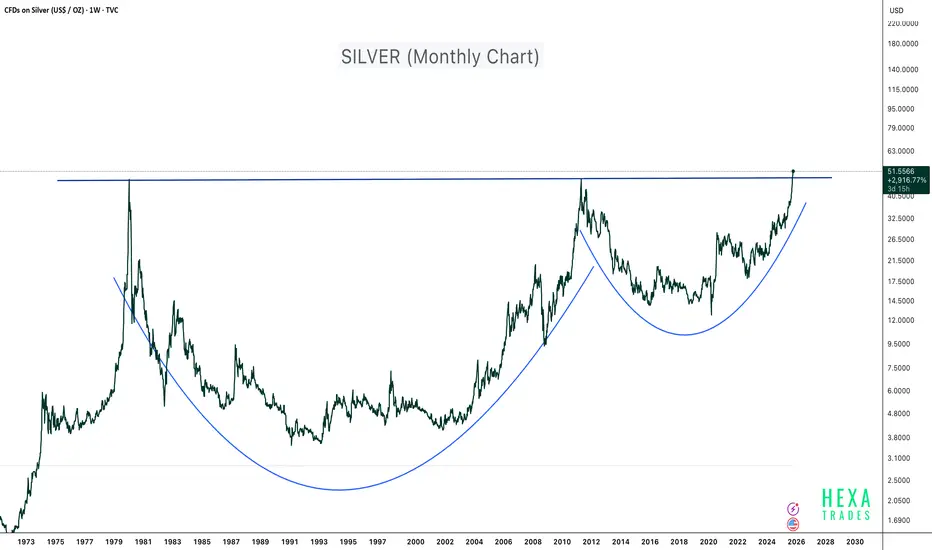
Silver - 45 Years of Breakout!Silver has just completed one of the largest and longest cup and handle patterns in financial history, spanning more than four decades. The metal has officially broken above the 1980 and 2011 highs, signaling a potential supercycle breakout on the monthly timeframe.
This type of long-term technical structure typically marks the beginning of a massive secular bull run, often driven by macroeconomic shifts such as inflation cycles, fiat currency debasement, and rising demand for hard assets.
Technical Highlights:
- Pattern: 45-year Cup and Handle formation
- Breakout Zone: Above $50 confirmed (Weekly chart)
- Structure: Deep base formation showing multiple accumulation phases (1981–2001 and 2012–2023)
Macro Perspective:
Silver is benefiting from:
- Increased industrial demand (especially in solar, EV, and electronics sectors)
- Inflationary monetary policies and growing global money supply
- Renewed investor interest in tangible and real assets
This breakout could mark the start of a multi-year bull run for silver. Long-term investors may view this as an opportunity to accumulate and hold for 10–15 years, aligning with the magnitude and duration of the pattern.
If the price experiences short-term pullbacks in the coming months, use DCA (Dollar-Cost Averaging) to build long-term exposure.
Conclusion:
After 45 years of consolidation, silver is finally breaking free. The chart points toward a historic structural breakout, potentially setting the stage for the next precious metals supercycle.
Cheers
Hexa
Disclaimer:
This analysis is for educational purposes only and does not constitute financial advice. Always conduct your own research and manage risk responsibly.
Silver likely to outperform Gold in coming decade upto 5-7X1. World Order Shifting
2. Cup and Handle pattern with Multiyear Breakout
3. Gold is mainly a monetary asset (central‑bank reserves, jewellery, investment), so its price is driven by interest rates, inflation expectations
Silver has a dual role: a precious metal plus a heavily industrial metal used in solar, EVs, electronics, data centres and other technology, so it benefits when both macro hedging demand and real‑economy demand rise together.
4. Silver is critical for photovoltaics and EVs: each solar panel uses roughly 20 grams of silver, and solar alone has grown to about 15–20% of total annual silver demand, with further growth expected through 2030.
5.EVs and high‑performance electronics use significantly more silver than internal‑combustion or legacy systems, so policy‑driven decarbonisation and AI/data‑centre build‑out act as structural demand tailwinds that gold does not enjoy.
6. China is one of the largest silver miners and the dominant refiner, and from 2026 it is introducing export controls that require licences to ship silver abroad, effectively tightening an already deficit global market
7. China contributes just 13% of overall silver production but one market study reports silver import growth of over 200% year‑on‑year from 2023 to 2024, and China hosts over 80% of global solar panel manufacturing and major EV and electronics capacity, so it absorbs a large share of the world’s silver used in photovoltaics, electronics and related technologies.
Cautions:
Silver is more volatile 1.5 to 2 times but historical returns are better than Gold.

BTC - Weekly Analysis. Preparing to go down Big TimeOn weekly time frame, historically BTC made a Cup And Handle formation (Nov 2021 ~ Sep 2024) then reached its peak in Oct 2025 which is very close to the depth of the Cup.
Weekly trend line has been drawn (black) and the price has dropped below it.
Price is testing EMA 100 which becomes critical on weekly analysis. Classical Head & Shoulder pattern has been drawn (classical has right shoulder lower than left) which if followed will likely to give a big drop equal to the height of the Head (around $ 23,000).
But in doing so it will give opportunity to trade.
For LONG Trade, Buying around $74,000 ~ $68,000 region and selling off around $96,000 to $98,000. And then taking a SHORT Trade for a few months to enjoy good profits (expected by end Sep 2026 to mid Oct 2026).
Then again Taking LONG trade by Buying at $26,000 to $24,000 region and ride it till the top of $120,000.
Also note that there various Support zones are marked as well and price me stay there for a bit more than usual.
Disclaimer: Kindly do your own research first before getting in to trade.

BPCL Weekly Chart — Classic Cup & Handle Breakout SetupThis study showcases a textbook Cup and Handle formation — a bullish continuation pattern that reflects long-term accumulation followed by a breakout-ready consolidation.
Pattern Anatomy:
Cup: A rounded base formed over several months, signaling gradual recovery and buyer buildup.
Handle: A shallow pullback in a downward-sloping channel, indicating controlled profit booking before breakout.
Neckline: Resistance zone connecting the highs before and after the cup, now acting as breakout trigger.
Targets:
🎯 Target 1: Based on neckline breakout projection
🎯 Target 2: Extended move aligned with weekly momentum
🧠 Strategic Insight
This setup reflects institutional accumulation, with breakout confirmation supported by volume expansion and volatility uptick. Traders can use pullbacks to the neckline as re-entry zones, with stop-loss below the handle base.

$PGAS - CUP WITH HANDLEPosition update: December 16, 2025.
Key factors:
1. The stock is in a confirmed Stage 2 uptrend.
2. Well defined and crisp entry points from the handle.
3. It has the fractal, small cup and handle on the actual handle.
4. It has VCP characteristic.
5. Displays high relative strength, outperforming sector and index benchmarks.
6. Volume has dried up, indicating less supply coming to the market.
7. More traction on my personal trades.
8. It has many positive news and sentiment.
Considerations:
1. Low relative strength line
2. No big volume on the breakout
3. Slow quarterly year-on-year earnings
4. Bad closed
Conclusion:
The stock trying to emerge today, and I have my initial position. I like
to see if it can hold up and continue moving upward.

Pour me a cup of SOLANA plzOn the weekly chart, I see a really nice cup and handle pattern.
This pattern is historically a bullish sign of good things to come.

TESLA analysis, Chart is speaking itself !!!It can be said that the price has completed this pattern, and whenever the cup and handle is broken, we should expect a growth equal to AB=CD.
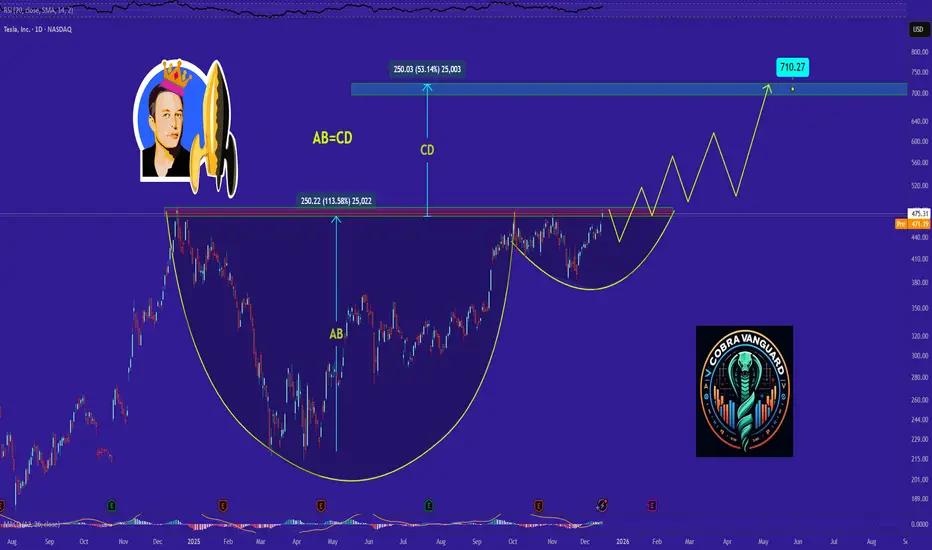
TSLA $625 Inevitable! Tesla aims at making a new all time high and with the main target being $761, I can easily see #TSLA reaching $625 within the next 6 months to a year. Leap options seem tasty.
Just sit back and enjoy the ride.
Calculate Your Risk/Reward so you don't lose more than 1% of your account per trade.
Every day the charts provide new information. You have to adjust or get REKT.
Love it or hate it, hit that thumbs up and share your thoughts below!
This is not financial advice. This is for educational purposes only.

Did you lose faith in the Bitcoin Miners??? WAGMI #WGMIThe Bitcoin miners ETF WGMI
has a lovely setup
you could be picking up cheap miners
slurping that blood!
For summertime profits... If you have the b@lls (& capital of course)
#CupandHandle
Clear as day
for all to see --- Yet sentiment is in the toilet.
Marvelous!
#CLSK
#WULF
#BITF #BITF.TO
#HIVE #HIVE.V
#MARA
#MIGI
#RIOT
#HUT
#GREE
#ARBK
#BTBT
#BTDR
#BTCM
#CORZ
#NILE
#IREN
#DMGI
#CIFR

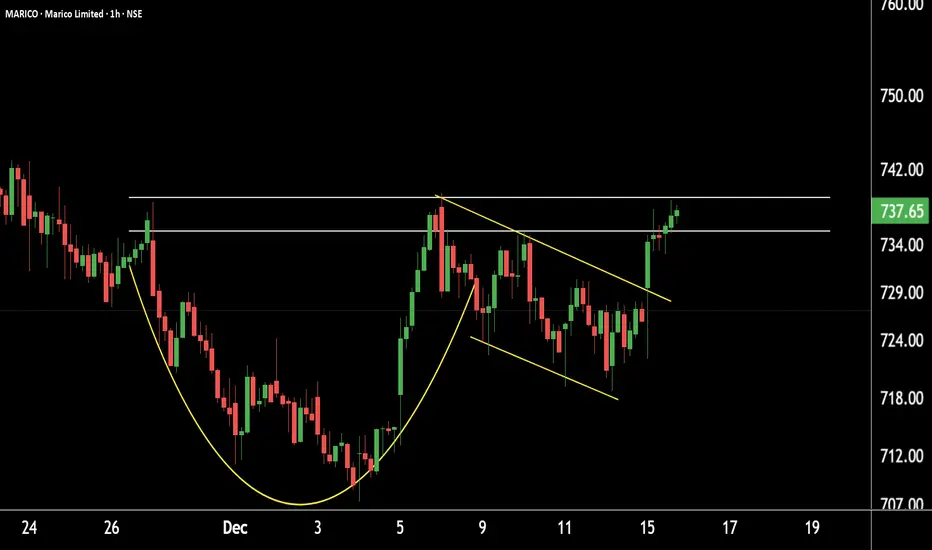
MARICO Technical Setup | Cup & Handle Pattern Developing .MARICO – Technical View (1-Hour Timeframe)
MARICO is forming a Cup & Handle pattern on the 1-hour chart and is currently trading near the key resistance zone of 740–745.
The stock has a strong support base around 700–710, indicating underlying strength.
Upside Scenario:
A decisive breakout and sustained move above 740 could open the door for an upside target near 770.
Confirmation and sustainability above resistance will be crucial for further momentum.
NPLNPL Stock – Trade Plan
Fundamentals:
Revenue growth supported by Omoda, Jaecco J6 & J7 launches.
Margins stable, cash strong, debt manageable.
EPS YoY disappointing → caution on fundamentals. Can turn around due car sales
Technical:
Pattern: Head & Shoulders + Cup & Handle.
Breakout confirmed.
Wait for retrace to zone 1 and 2 → take entry on HL
Stop-loss: below recent swing low.(if trading)
Target: 1:1:2 or use TP mentioned in charts. Book profits timely.
Notes:
Weak EPS may pressure price; vehicle sales are a short-term catalyst.
Monitor retrace volume for strong support confirmation.
