EUR/USD Daily Chart Analysis For Week of Jan 2, 2026Technical Analysis and Outlook:
In the New Year trading week, the Euro market exhibited a notable downward trend, followed by a brief upward trading momentum at the Mean Support level of 1.175.
Given the prevailing conditions in the currency market, a "dead cat" rebound is anticipated from the Mean Support level of 1.171, with a target price identified as the Mean Resistance level of 1.175.
Moreover, it is expected that steady to lower declining intermediate downward momentum will continue once the Mean Resistance level of 1.175 realigns with the anticipated market trajectory.
Currencytrading

Aussie Bull Run: Why AUD Futures Are the 2026 Trade to WatchThe March 2026 Australian dollar (A6H26) futures have emerged as a premier opportunity for currency traders. As of late December 2025, prices have surged to new contract highs, supported by a perfect storm of technical and fundamental catalysts. For the modern trader, the "Aussie" is no longer just a proxy for copper; it is a sophisticated bet on global technology and fiscal shifts.
Technical Mastery and MACD Momentum
The daily bar chart for A6H26 reveals a textbook bullish trend. Prices recently breached key resistance, establishing a solid floor for further appreciation. Technical analysts point to the Moving Average Convergence Divergence (MACD) , which remains in a strong posture. The MACD line sits comfortably above the signal line, with both trending higher.
The path of least resistance is clearly upward. A sustained move above the. 6729 contract high activates a buy signal for many institutional desks. Traders are now eyeing a primary price objective of 6950 . To manage risk, professional stops are typically placed just below support 6625 , ensuring a disciplined approach to this high-conviction setup.
Macroeconomics: The Fed’s Dovish Pivot
A primary driver for the Australian dollar's strength is the diverging path of global central banks. The U.S. Federal Reserve has transitioned toward a more accommodative stance to support labor markets. Lower U.S. interest rates naturally weigh on the Greenback, making high-yielding currencies like the AUD more attractive to international carry traders.
Conversely, the Reserve Bank of Australia (RBA) maintains a hawkish bias. Persistent domestic inflation and a resilient job market have forced Australian policymakers to keep rates elevated. This widening interest rate differential acts as a powerful magnet for global capital, fueling the "long Aussie" trade into 2026.
Geostrategy: Powering the AI Revolution
Australia’s geostrategy has shifted from traditional mining to securing the "Green and Digital" transition. The nation is a critical supplier of lithium, copper, and rare earths , the literal building blocks of AI data centers and renewable energy. As global demand for computing power explodes, Australia’s trade balance benefits from a structural "AI premium."
Furthermore, the Australian government is aggressively implementing blockchain-based supply chain tech . These innovations reduce friction at the border and enhance the security of resource exports. By leading in "High-Tech Mining," Australia ensures its currency remains a vital asset in the global technological race.
Professional Note: Success in AUD futures requires monitoring both the RBA’s tone and China’s industrial demand. While the technicals suggest a move to .6950, stay alert for any sudden shifts in global risk appetite that could spark short-term volatility.

EURUSD | 15M TIME FRAME BUY SETUP ANALYSISEURUSD — Trade Setup
📈 Bias: Bullish
🎯 Entry: 1.7100 / 1.7150
🛑 Stop Loss: 1.7000
🎯 Target: 1.7205
📊 Technical Reasoning:
EURUSD is maintaining bullish momentum after holding above a key support zone. The entry area is positioned where buyers are expected to defend price and continue the move higher. The stop loss is placed beyond the invalidation level to manage downside risk, while the target is aligned with a higher liquidity objective and continuation structure.
📌 Execution Plan:
* Buy from the marked entry zone
* Apply disciplined risk management
* Monitor price behavior as it approaches the target
❌ Invalidation:
A clear break and close below 1.7000 would invalidate this bullish setup.
💬 Do you expect continuation toward 1.7205, or consolidation before the next leg up?
⚠️ This analysis is for educational purposes only. Not financial advice.

Potential 600Pips on EURAUDWait for price to rally into the 1.7780 – 1.7805 region.
Confirmation:
A structural shift, confirmed by a break and close below 1.7690.
Possible Entries
Entry 1
Sell Limit @ 1.7885
Stop Loss @ 1.7838
Entry 2
Sell Limit @ 1.7870
Stop Loss: Refined on entry
Target Levels
T1: 1.7484
T2: 1.7330
T3: 1.7180
This move can be anticipated to develop between 19:00 UTC, 17th December 2025 and 02:00 UTC, 26th January 2026.
This setup offers a projected risk-to-reward of approximately 1:11 when executed from refined entries.
Trade Safe.
Patience is the Way!
Ieios

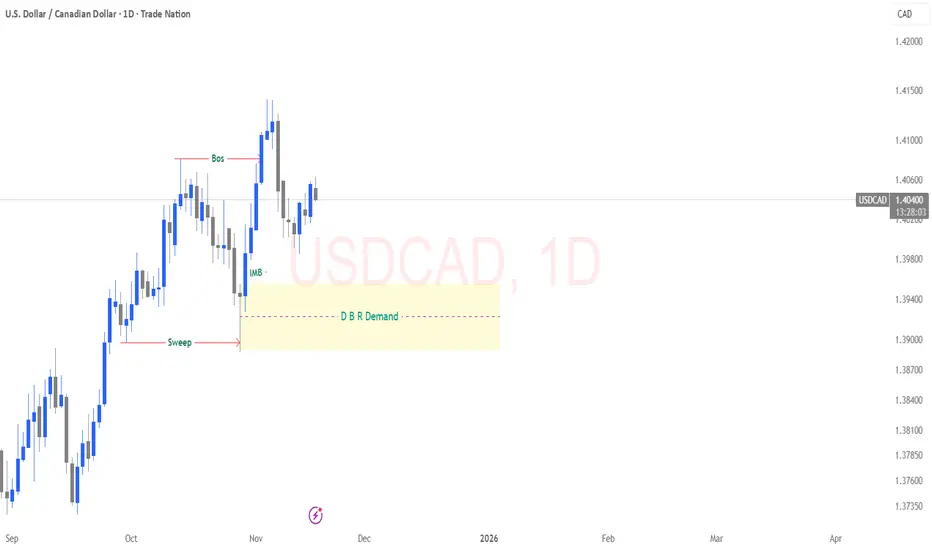
USDCAD – Clean Daily Buy Scenario Price has already established a bullish Break of Structure (BOS), confirming upside order flow on the daily timeframe. After that BOS, the market dipped back down to sweep the previous low, clearing out sell-side liquidity and creating the fuel required for a bullish continuation.
From there, price impulsively rallied, leaving behind a clear imbalance (IMB) and an unmitigated Daily DBR Demand zone the origin of the bullish displacement.
As price pulls back, the expectation is for a corrective move into this DBR demand. This zone represents discounted pricing aligned with the dominant trend and offers high-probability buy setups once lower-timeframe confirmations show up (reaction, BOS, or displacement).
If this demand holds, the next bullish leg should target the highs created above the imbalance, continuing the overall upward structure.
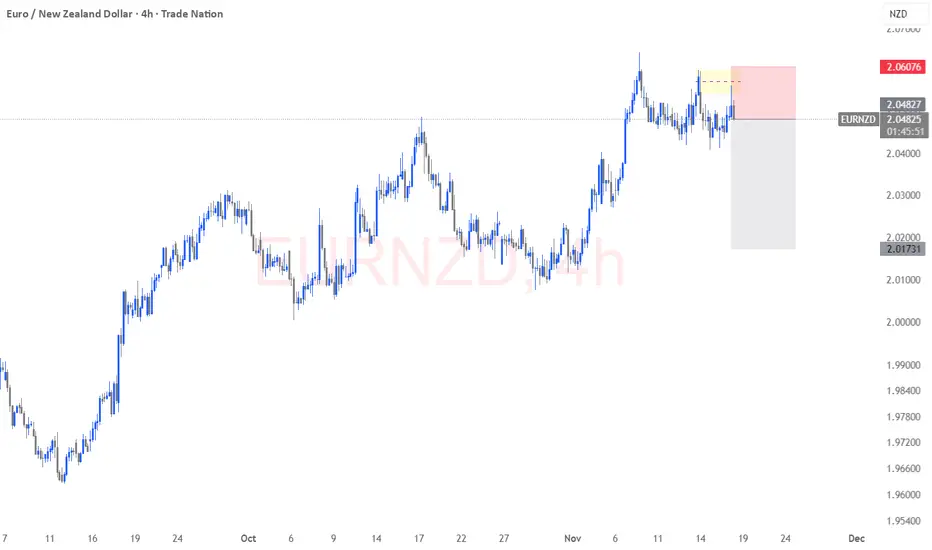
EUR/NZD – Short Position Breakdown (4H Context)The market is signalling a potential downside rotation after tapping into a premium pricing zone. Price has reacted inside a clear rejection block sitting at the upper boundary of the recent rally, showing early signs of supply taking control.
From an execution standpoint, this region represents an attractive shorting opportunity as liquidity has likely been engineered above the prior high. Once that sweep was completed, we saw price struggle to maintain bullish momentum an early indicator of possible distribution.
The current short position is aligned with a corrective move back into discounted territory. If momentum holds, structure suggests a continuation towards the previous 4H demand area, where we expect buyers to potentially step back in. Risk parameters remain intact above the engineered high, ensuring optimal downside exposure while maintaining disciplined capital protection.
This setup reflects a textbook scenario of waiting for price to enter a premium zone before taking action—maximising reward efficiency while protecting the downside.
Currency Market State of Play - Week Ahead StrategyMONDAY MARKET OVERVIEW - Currency State of Play
Starting the week with a clear analysis of major currency pairs and potential trading opportunities.
📊 EURUSD
Bias: Sell opportunity
Key Level: Above 1.1624
Setup: Watching for sell signals above this level for downside continuation
📊 GBPUSD
Bias: Neutral
Status: Noisy price action with no clear directional reference
Strategy: Stay patient, wait for structure to develop
📊 USDJPY
Bias: Bearish lean
Key Level: 154.59
Setup: Sell on 2nd break below 154.59. Buy is technically possible, but overall price action shows weakness—proceed with caution
📊 CADJPY
Bias: Transitional
Friday's Action: Sold off and then reversed to buying
Current Status: Price searching for direction above the last Momentum High (MH)
Strategy: Best selling opportunity below 110.13
This Week's Approach:
This is my Monday overview to frame the week ahead. I'll be posting detailed analysis on individual pairs as price action develops throughout the week.
Key Principle: Wait for a clear structure, react to price behaviour, and let the setups come to you. Patience is part of the edge.
👍 Hit the boost button if you found this helpful
👤 Follow for detailed pair analysis throughout the week

USDJPY | Breakout Retest → Targeting Major Supply Zone (157.80)USDJPY has confirmed a strong bullish continuation structure on the daily timeframe after breaking above the key resistance zone around 153.50 – 154.30.
This level has now flipped into a fresh demand zone, acting as a valid retest area for continuation.
🔍 Why This Move Matters:
Daily Break of Structure (BOS): Bullish market structure remains intact
Demand Retest: Price tapped into the previous breakout zone (153.50–154.30)
Liquidity Shift: Sell-side liquidity taken → Buy-side liquidity now targeted
Higher Timeframe Trend: Strongly bullish since October; aggressive momentum
🎯 Upside Targets:
154.30 → First continuation objective (already tapped)
157.80 → Major supply zone + HTF liquidity cluster
158.00 → Top of weekly supply
Price is likely to accumulate above 154.30 and build higher lows before pushing toward the 157.80 supply block.
📈 Bullish Scenario:
If price holds above 153.50, continuation toward 157.80 remains highly probable.
Market structure indicates trend continuation, not reversal.
📚 Concepts Used:
Market Structure | BOS | Liquidity | HTF Zones | Demand/Supply Flip | Trend Continuation | FX Macro Trend

EUR/USD Daily Chart Analysis For Week of Nov 14, 2025Technical Analysis and Outlook:
In the most recent trading session, the Eurodollar market exhibited a notable rise, characterized by significant movements targeting key price levels, specifically Mean Resistance at 1.159 and 1.165. Initially, the prices experienced a gradual increase, followed by a sharp escalation, ultimately reaching the critical Mean Resistance level of 1.165, which currently serves as the trading point for the currency.
Current market analysis suggests a modest expectation of a potential further increase in prices toward the target Mean Support level at 1.169. Additionally, there is a cautious outlook that downward movement may result in a subsequent retest of the Outer Currency Dip at 1.148 in the near future. Moreover, it is essential to monitor the breakout thresholds for the currency, with particular emphasis on the two primary levels: Mean Resistance at 1.165 and Mean Support at 1.159.
EUR/USD Daily Chart Analysis For Week of Oct 17, 2025Technical Analysis and Outlook:
Last week, we had an interesting trading session! The Euro demonstrated a considerable increase after reaching our crucial Mean Support level at 1.155. Nevertheless, this significant upward reversal fell marginally short of the Mean Resistance at 1.174, leading to a subsequent decline in the currency.
Current market indicators suggest that this Active Inner Rebound movement is unlikely to be sustainable. Ongoing market sentiment consistently reflects a retracement toward the Outer Currency Dip, designated at 1.145. Should this downward trend persist, it may extend further to the Key Support level of 1.140.
Conversely, it is essential to acknowledge and be aware of the emergence of an Auxiliary Inner Rebound following the Outer Currency Dip at 1.145, in conjunction with the Key Support level of 1.140.

De-Dollarization and the Global Currency WarIntroduction: The Shifting Sands of Global Finance
For decades, the United States dollar (USD) has reigned supreme as the world’s dominant reserve currency — the central pillar of global trade, finance, and economic stability. From oil transactions to international debt settlements, the dollar became more than just a currency; it was the bloodstream of globalization. But in recent years, a strong wave of economic nationalism, geopolitical rivalry, and strategic diversification has begun to challenge this hegemony — a process known as “de-dollarization.”
Simultaneously, we’re witnessing an intensifying “currency war” — a global competition among nations to protect their economic sovereignty, control exchange rates, and reduce dependency on U.S.-led monetary influence. Together, de-dollarization and currency warfare are reshaping the financial map of the 21st century, with implications that reach from the energy markets of the Middle East to the central banks of Asia and Latin America.
This 2000-word analysis dives deep into the rise of de-dollarization, explores its causes and strategies, examines the mechanics of currency wars, and forecasts the potential shape of the next global monetary order.
1. The Roots of Dollar Dominance
After World War II, the 1944 Bretton Woods Agreement established the U.S. dollar as the world’s reserve currency, pegged to gold at $35 per ounce. Other global currencies were tied to the dollar, making it the foundation of postwar economic stability. Even after President Richard Nixon ended the gold standard in 1971, the dollar retained its dominance because of its stability, liquidity, and the economic might of the United States.
By the late 20th century, the dollar had become:
The primary reserve currency, held by central banks worldwide.
The medium of international trade, particularly in oil (the “petrodollar” system).
The currency of global finance, underpinning stock markets, bonds, and derivatives.
In short, control of the dollar meant control of the global economic bloodstream — and this financial power translated into political leverage.
2. What Is De-Dollarization?
De-dollarization refers to the deliberate process of reducing reliance on the U.S. dollar in international trade, finance, and reserves. It’s not about completely abandoning the dollar, but about diversifying away from it to limit vulnerability to U.S. monetary policy and sanctions.
Countries and blocs leading this movement include:
China, promoting the yuan (renminbi) in global trade.
Russia, moving away from dollar-based settlements after sanctions.
BRICS nations (Brazil, Russia, India, China, South Africa, now joined by others) working toward a shared currency system.
Middle Eastern countries, exploring non-dollar oil transactions.
Latin America and Africa, forming regional trade agreements in local currencies.
The motivation? A mix of economic independence, geopolitical resilience, and strategic competition.
3. The Key Drivers Behind De-Dollarization
(a) U.S. Sanctions and Weaponization of Finance
The U.S. uses its control over global payment systems (like SWIFT and dollar-clearing banks) as a geopolitical tool. Nations such as Iran, Venezuela, and Russia have faced financial exclusion through U.S. sanctions.
This has sparked fear among emerging economies that dollar dependency exposes them to political risk — accelerating efforts to create alternative payment systems (e.g., China’s CIPS, Russia’s SPFS, and India’s RuPay/UPI cross-border systems).
(b) Rise of China and the Yuan
China’s economic growth and the Belt and Road Initiative (BRI) have given the yuan increasing global exposure. Beijing aims to internationalize its currency by encouraging trade in yuan and developing offshore yuan markets (especially in Hong Kong, Singapore, and London).
(c) The BRICS Challenge
The BRICS alliance has emerged as a collective front against Western economic dominance. The bloc’s discussions around a BRICS common currency or a gold-backed trade settlement system indicate a long-term ambition to challenge dollar supremacy.
(d) U.S. Debt and Inflation
The U.S. government’s rising national debt (over $34 trillion) and the repeated use of quantitative easing have weakened confidence in the dollar’s stability. Countries fear that excessive dollar printing could erode their reserves’ value, prompting diversification into gold, the yuan, and other currencies.
(e) Digital Currencies and Blockchain
Central Bank Digital Currencies (CBDCs) offer new pathways for global payments. China’s digital yuan is leading this race, aiming to bypass the traditional dollar-based banking infrastructure entirely.
4. The Mechanics of a Global Currency War
A currency war, also known as “competitive devaluation,” occurs when countries intentionally lower the value of their own currencies to boost exports, attract foreign investment, and reduce trade deficits.
How It Works:
By devaluing their currency, a country’s goods become cheaper abroad.
This can strengthen exports but also increases import costs and inflation.
When multiple countries engage in this simultaneously, global financial instability can follow — hence the term “war.”
Historical Examples:
1930s Great Depression: Nations devalued currencies to recover from economic collapse.
1980s U.S.-Japan tension: Japan’s yen appreciation reshaped global trade.
2010s “Currency War 2.0”: After the financial crisis, countries used ultra-loose monetary policy and quantitative easing to stay competitive.
Today, the modern currency war involves not just exchange rates but geopolitical influence, payment systems, and financial infrastructure.
5. De-Dollarization and Currency Wars: The Modern Battlefield
In the 2020s, de-dollarization and currency competition have become two sides of the same coin. The following arenas illustrate this growing conflict:
(a) Energy Markets
The traditional petrodollar system — oil sold in U.S. dollars — is under strain.
China and Russia have signed major energy contracts in yuan and rubles, while Saudi Arabia has hinted at accepting non-dollar payments for oil. The India-UAE rupee-dirham trade settlement is another example of regional diversification.
(b) Central Bank Reserves
According to IMF data, the dollar’s share of global reserves has declined from 70% in 2000 to around 58% in 2024, marking a slow but steady erosion. Central banks are increasing holdings in gold, yuan, and euro, signaling a rebalancing of trust.
(c) Cross-Border Settlements
Nations are exploring bilateral trade agreements in local currencies — for instance, India-Russia rupee-ruble trade, China-Brazil yuan settlement, and ASEAN nations’ local currency framework.
(d) Digital Currency Warfare
With the U.S. lagging in CBDC development, countries like China are pioneering digital payment systems that can function independently of SWIFT and U.S. banking oversight. This could redefine how international money moves in the next decade.
6. Winners and Losers in the De-Dollarization Era
Winners:
Emerging Economies – Greater autonomy over monetary policy and trade settlements.
China and BRICS Members – Enhanced global financial influence and regional cooperation.
Commodity Exporters – Ability to price goods in multiple currencies.
Gold and Digital Asset Markets – Investors view these as alternative stores of value amid dollar uncertainty.
Losers:
U.S. Financial System – Reduced demand for U.S. Treasury bonds and the dollar may weaken the U.S. fiscal position.
Dollar-Debt Dependent Nations – Countries heavily indebted in dollars could face volatility.
Global Investors – Increased currency risk and reduced liquidity in traditional markets.
7. Is a New Global Currency Order Emerging?
While de-dollarization is gaining traction, a complete end to dollar dominance is unlikely in the short term. The U.S. still has unmatched advantages:
The deepest financial markets in the world.
Global trust in its institutions and legal system.
Military and geopolitical clout backing the currency’s credibility.
However, the trend is unmistakable — the world is slowly transitioning toward a multipolar currency system, where the dollar, euro, yuan, and possibly regional digital currencies coexist in a competitive balance.
Future trade blocs might operate on multi-currency platforms, and international reserves could become more diversified.
8. The Future: Cooperation or Confrontation?
The next decade could unfold in one of two broad scenarios:
Scenario 1: Cooperative Multipolarity
Nations collaborate through institutions like the IMF, BRICS Bank, and AIIB, building systems that support currency diversity while maintaining global liquidity. In this world, de-dollarization doesn’t mean destruction — it means balance.
Scenario 2: Financial Fragmentation
Geopolitical rivalry intensifies, creating currency blocs (USD-based, yuan-based, euro-based). Trade becomes more regionalized, and financial flows become fragmented. This could lead to volatility, capital flight, and higher transaction costs worldwide.
In either case, technological innovation — from digital currencies to blockchain trade settlements — will play a defining role in shaping monetary competition.
Conclusion: The Dawn of a New Financial Era
De-dollarization and the currency war are not isolated economic trends; they are strategic transformations redefining how power is distributed across nations. What began as a defensive move by a few sanctioned countries has evolved into a systemic global recalibration of monetary order.
The dollar will likely remain powerful, but its monopoly is fading. The 21st-century global economy may no longer be built around a single currency but around a network of competing and cooperating monetary systems.
For traders, policymakers, and investors, this means one thing: the world of finance is entering a new era — more decentralized, more digital, and more dynamic than ever before.

Dollar short-term BULLISH until proven otherwiseCAPITALCOM:DXY
After a deep liquidity sweep down to ~95.80 followed by a sharp buying response, a string of higher lows, and a higher high into the 97.39–97.78 area. Price is currently pausing just above the shaded Daily BPR.
That sequence (sweep → big rejection → higher low → higher high) is the technical basis for a bullish bias while price stays above the recent higher-low area.
Watching development for now...

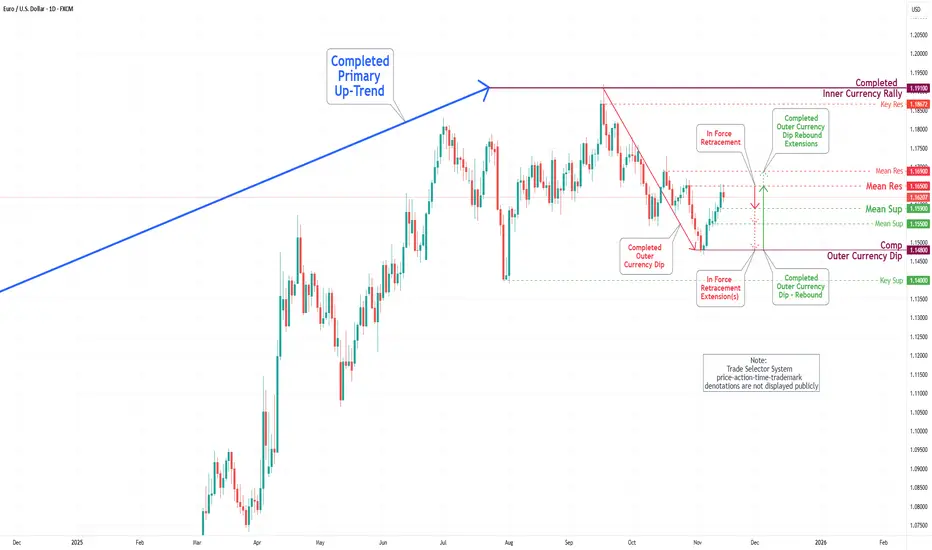
EUR/USD Daily Chart Analysis For Week of Sep 12, 2025Technical Analysis and Outlook:
In the previous trading session, the Euro completed an Inner Currency Rally at 1.177, resulting in a significant decline towards the Mean Support level of 1.164. Subsequently, the Euro reversed direction and fell sharply below the completed Inner Currency Rally level of 1.177.
Current analysis indicates that the primary targets for the Euro include a retest of the completed Inner Currency Rally at 1.177, with the potential for further upward movement to the Key Resistance level at 1.181. Additionally, there is a long-anticipated target positioned at the Outer Currency Rally level of 1.187. The ongoing price action may yield a substantial pullback from these upward targets.
It is essential to emphasize that the current market dynamics suggest a substantial drop from recent price levels, with attention directed towards the primary target of Mean Support at 1.164, and the possibility of extending this trajectory towards Mean Support at 1.160.

EUR/USD Daily Chart Analysis For Week of August 29, 2025Technical Analysis and Outlook:
In the most recent trading session, the Euro showed moderate upward movement. It initially declined to the Mean Support level of 1.160 before starting an effective upward trend. Current analyses indicate that the primary targets for the Euro are the Mean Resistance levels of 1.172 and 1.177, as well as the Key Resistance level of 1.181. Additionally, there is a long-sought-after target to be hit at the Outer Currency Rally target of 1.187. The ongoing price action may result in a notable pullback from these upward targets.

EUR/USD Daily Chart Analysis For Week of August 15, 2025Technical Analysis and Outlook:
During the last trading session, the Euro demonstrated a notable increase, retesting the Mean Resistance level of 1.169. Recent analyses suggest that the primary targets for the Euro are the Mean Resistance level of 1.177 and the Key Resistance level of 1.181, in addition to the Outer Currency Rally target of 1.187. Such movements may precipitate a considerable pullback before the upward trajectory resumes.

GBP/USD Professional Analysis – “Trap Trigger at Support”GBP/USD Professional Analysis – “Trap Trigger at Support”
📈 Market Overview:
• Pair: GBP/USD
• Timeframe: Likely 1H or 2H based on candle spacing
• Date: July 28, 2025
• Current Price: 1.33529
⸻
🔍 Technical Breakdown
🔴 Resistance Zone: 1.35800 – 1.36200
• Strong supply area where the last bullish impulse failed.
• Price got rejected hard, initiating a new downtrend.
• Sell-side pressure was confirmed with Supertrend turning red.
🟤 Support Zone: 1.32860 – 1.33400
• Major demand area where price previously reversed sharply.
• Currently being tested again after a clean sweep into the Trap Trigger zone.
⚠ Trap Trigger Zone (Liquidity Sweep Area):
• Price wicked just below support, tapping into a low-volume/high-liquidity area.
• This wick likely cleared sell-side liquidity and trapped breakout sellers.
• Followed by a bullish rejection wick, implying smart money accumulation.
⸻
🛠 Indicators & Tools:
• Supertrend (10,3): Currently red, indicating short-term bearish momentum.
• However, if price closes above 1.34032 (Supertrend level), it could flip bullish.
• Volume Profile (VRVP):
• Low-volume node under support suggests a quick “stop hunt” move, not genuine selling.
• High-volume acceptance area sits higher, near 1.34500–1.35000.
⸻
🎯 Forecast:
🔴 Bearish Invalidations:
• Price closing below 1.32860 with volume would invalidate this setup.
• That could signal continuation to deeper liquidity (1.32500 or below).
⸻
🧠 Smart Money Perspective:
• Liquidity engineered beneath support
• Trap Trigger activated — ideal for institutional reversal setups
• This is a classic “Stop Hunt → Reclaim → Expand” model

EUR/USD Daily Chart Analysis For Week of July 18, 2025Technical Analysis and Outlook:
In the current trading session, the Euro has continued its decline, completing our Mean Support level of 1.160. Recent analyses indicate that the Euro is likely to experience a sustained downward trend, with an anticipated retest at the Mean Support level of 1.159 and a possible further decline to reach a Currency Dip of 1.152. Nevertheless, it is crucial to consider the potential for a dead-cat bounce toward the Mean Resistance level of 1.167, which could trigger a significant reversal of the downtrend and target a Currency Dip of 1.152.

EUR/USD Daily Chart Analysis For Week of June 27, 2025Technical Analysis and Outlook:
In the course of this week's trading session, the Eurodollar has exhibited a strong rebound, successfully retesting and surpassing the Outer Currency Rally threshold of 1.163. Recent analyses suggest that the Euro is poised for further upward advancement, with the key target to reach the outer currency rally target of 1.177. Nonetheless, it is essential to recognize the possibility of a subsequent decline to the Mean Support level of 1.160 before a definitive upward movement.

EUR/USD Daily Chart Analysis For Week of June 20, 2025Technical Analysis and Outlook:
During this week's trading session, the Eurodollar has encountered a significant decline, dipping below the Mean Support level of 1.149; however, it exhibited a modest recovery on Friday. Recent analyses indicate that the Euro is likely to decrease further to the Mean Support level of 1.148, with the potential for extending its bearish trend to reach 1.140. Nevertheless, there remains a possibility that the current recovery will persist, which could result in price movements targeting the Key Resistance level at 1.158 and potentially leading to a retest of the Outer Currency Rally's 1.163 mark.

EUR/USD Daily Chart Analysis For Week of June 13, 2025Technical Analysis and Outlook:
During the current trading session, the Eurodollar has exhibited notable volatility, mirroring patterns observed in the preceding week. The currency has surpassed both the Mean Resistance level of 1.145 and the Key Resistance level of 1.151, subsequently retesting the significant completed Outer Currency Rally level at 1.157.
Recent analyses indicate that the Euro is likely to revisit both the Key Resistance and the completed Outer Currency Rally and expand further to the next Outer Currency Rally of 1.177 in the forthcoming trading session(s). However, there exists a potential for a continuation of the downward trend from the current level, which could lead to the price action targeting the Mean Support level at 1.149 and possibly a further extension to the Mean Support level at 1.140.

ETHUSD KEY LEVEL.This is the 4 hour chart of ETHUSD.
ETHUSD is currently consolidating in a well defined range.
If the lower boundary of the zone is sustainable ,then we see again higher prices in ETHUSD.
Thank you !!

EUR/USD Daily Chart Analysis For Week of May 30, 2025Technical Analysis and Outlook:
The Eurodollar has experienced significant volatility during this week's trading session. It reached a significant Mean Resistance level at 1.142 while also encountering Mean Support at a target of 1.122. Recent analyses suggest that the Euro is likely to revisit the critical target of 1.142, which includes Key Resistance at 1.151 and the completed Outer Currency Rally at 1.157. However, there is a potential for a downward correction from the current level, which could lead to prices retesting the Mean Support of 1.122. There is also a possibility for further declines, reaching the Outer Currency Dip at 1.108.

EUR/USD Daily Chart Analysis For Week of May 23, 2025Technical Analysis and Outlook:
The Eurodollar has demonstrated significant strength during this week's trading session, attaining a notable Inner Currency Rally at 1.129 and encountering Mean Resistance at 1.137. Recent analyses indicate that the Euro will likely progress towards the forthcoming target levels, specifically the Mean Resistance at 1.142 and the Key Resistance at 1.151. A retest of the completed Outer Currency Rally at 1.157 may facilitate this advancement. However, a potential downward pullback could emerge from the current price range, particularly in proximity to the Mean Resistance level of 1.137, with a possibility of declining to the Mean Support at 1.127.
