BE READY FOR THE BEST CYCLE COIN 2024 WLD/USDT This is an update on 2024 (cycle trend)
Depending on our study WLDUSDT has a high chance to go new ATH And target between $8 - $15
The cycle started today on this coin and with this 2024 update, we will save showing high interest for a new cycle.
Check update ideas
We expect that WLD will become the best top coin cycle coin of the known top coins 2024
interesting updates coming by the coin and data shows a new cycle start.
Cycle

SAVE THIS CHART FOR LATERMy vision about this cycle. First rate cuts are bullish, at least 3 of them, and soft landing will open the bearmarket.

Trend in Trend XAUUSDNew idea around 2327.6
If the following conditions are fulfilled this is a good sell for the follow up of the NY Session.
- Momentum
- RSI Reversal in 5min
Direction is given in H1
News was good on USD meaning, it should theoretically reverse soon.

Odds and Psychology.Based on "Think fast and slow", people have two system thinking. System-1 is autonomous, always working in background (ie unconsciousness), lazy, intuitive, fast, has stereotypes. System-2 is rational, hard problem solving, takes effort and energy, cuts trough the BS, etc (ie consciousness).
Based on another book called "superforcasters" and some dude I forgot his name, best approach for odds is to have simple system; where 100% certain. 93% almost certain. 75% probable. 50% about even (or maybe). 25% probably not. 7% almost certainly not. 0% impossible. All forecast are subjective guesses.
The catch; If you think something is 100% - you would go allin with max lever. (If you dont) your beliefs or opinion go against your actions. If you dont believe it's wise to go allin - then odds are not actually 100%. If you are stressed about 93% spot, then maybe it might not be 93% after all. (1:14).
In key SPX areas, based on business cycle and TNX, logic says one odds (or System-2) and your intuition (or feel) says differently. You are either too bearish or too bullish.
This is a simple representation of concept.
Another key concept is that TIME <----> PROBABILITY are at opposite sides of coin. The closer or far away in time something - more or less risk, ie higher or lower probability.

One Chart 3 cycles //BTC One Chart 3 cycles //BTC
3 cycle 2013-2024 BTC/USD 1w
BTC cycle moves // almost same
>Mayer Multiple bands (75MA &50MA)
>Bitcoin Power Law Corridor
> Realized Price Log Regeression 250
#btc CRYPTOCAP:BTC

Buying Silver at 22$ based on H.Marks Cycle theory.Risk and Time are in opposite sides of a coin. Meaning what is unknown equals risk. Markets are forward pricing mechanism, meaning when something is known - usually was already priced in (bought with risk).
H.Marks theory was you should buy things in advance, when there was hypothetical most risk; in practice it would be the least risk (as shown in graph). As long as there were hedges and drivers? You cant measure future demand?
Here key words were economic gravity and inflation trend (unknown). Once we saw inflation in mid-January -> we could start placing bets on silver (22$).
//Highest profit comes from buying in advance (combining w/ 200dma cycle?). When something is "risk-free" or certain -> it has 50-50 chance of profit and loss in both directions?; when something is "small risk", certain has small returns.
//this works as long as there is 1:5 potential.

SILVER flying to the moon? wait a minute (read). 22/May/24XAGUSD probably facing long term resistance at 48.88 +/- and dropping 61.54% +/- before taking off to the moon..

Using S5TH (spx stocks above 200dma) as an oscillator timing cycPretty cool feature. You can use the 9month moving average in S5TH (spx stocks above the 200dma) to time the market cycle. Figure out the upward momentum (with help of game theory and TNX cycle). In practice and theory peoples options should be predictable because everyone act in their self-interest, seeking safety (hypothetical riskfree) and potential.
I use this as an oschilator (like RSI).. above 50% reading is bull market (because more than 50% stocks above it's 200dma).
This thing points to bull market to at least like 2025 summer. Worth noting that business cycle and TNX patterns are key here.

Tesla's kangaroo still hopping. 20/May/24TSLA kangaroo still boxing/ hopping inside the ring (triangle) since end of 2021. Strong support if there was a pullback toward 186 +/-. Which is confluence zone of 1) POC of Volume Profile (red horizontal line) 2) 233 weekly EMA (white MA Line) 3) Pitchfork lower channel (blue).

Gold Swing Setup Trade 18/May/24XAUUSD is on its final leg of leading diagonal pattern in wave (A)(Green). Waiting for confirmation in next idea for confirmed stop lost level before shorting.

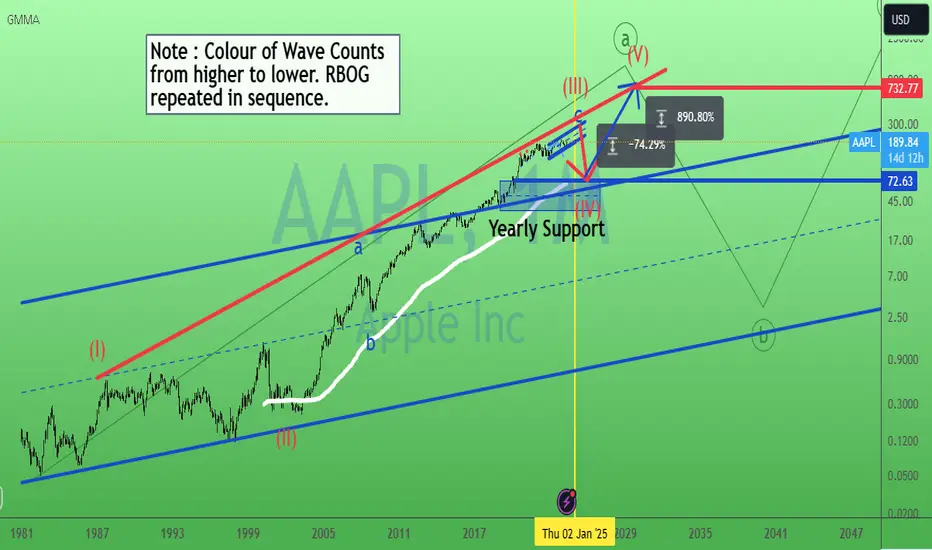
Apple bigger pic. 17/May/24AAPL bigger picture on monthly chart, possible a more than 70% (-74.29&) drop on year 2025 toward 72.63 +/- which is multi confluence zone of 1) Monthly 233 EMA ( thick white MA line) 2)Upper Support of parallel channel ( blue line) 3) Yearly Support Zone.
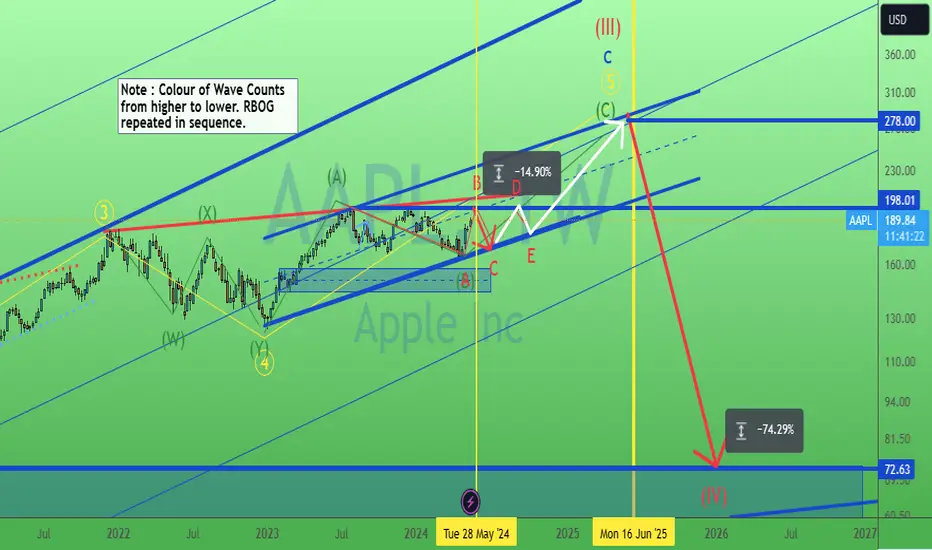
Apple still not out of wood (triangle). 17/May/24AAPL still forming a triangle pattern. Probably a -14.90% drop by end of May ( so sell in May still working") or early June.
Hartalega dynamic cycle analysis. 15/May/24Hartalega still trending up to cycle high 4 ( purple ) which is only due at end of year by average (near yellow vertical dotted line) . So how "hi" can it goes?!

Gold. Road Map toward 2165 +/-. 10/May/24Gold, Short at 2380 +/- toward wave IV ( green ) of ending diagonal pattern in wave (c) (red) by 22 May 2024.

SPX500 waiting for 15% +/- drop..9/May/24SPX500 Wave 4 ( Red Circled) is an expanding flat wave pattern, where wave (B)( blue) could reach 5530 +/- before losing 15.98% +/-

US10 yield is "far" from long term "peak". 9/May/24US10Y > 8% what happen for those house/ car mortgage? What happen to #gold when big player have "guaranteed" in bank deposits? What happen to "healthy" bank's "stock"?..

Why Gold need to retrace to 2050+/-? 8/May/24 Gold need to "retrace" to 2050 +/- ( monthly order block PLUS ++ Bcos wave (c) Red have 3,3,3,.. wave structure . So it's an expanding ending diagonal wave structure!

BTC ON THE WAY TO 56K WITH THIS TRENDThanks for reading this update.
BTC seems to enter an important breakdown trend where we expect that BTC has a high chance of falling to 56K, this can also happen unexpectedly with free fall volume as we have seen also before.
BTC IS IN OVERFLOW VOLUME TREND..
Remember. No way is going directly to trend, BTC will play all possible trends to go to the goal. The trend is your friend.
68133 is a key level and same time a breakdown level for new volume which will make the trend decrease below. The end low time frame can change with time up, and we will update it.
Our data shows us that the possibility that BTC will break down is high.
BTC has been since OCT 2023 in a cycle trend that can end at 54K or with time higher, since data change.
Not only BTC but also the stock markets are in overflow volume, which could break down soon.
THE ETF hype will end as the most hypes did end. The same as the stock market where ETF becomes a normal trend.
We did follow more cycle trends also the starting cycle from 26K, and the last update from below 42K to ATH. click the update for more data
The overflow volume can increase btc more, but when it's time a correction starts, this can become a high correction. we expect BTC has a high chance to return 56K, then the idea it's going to 100K. Never in history of BTC there was no correction after high volume.
Manage in all time the risk, since there is nothing called only uptrend.
This update is not trading advice.

May Market Outlook, Sectors Rotation, Relative Strength AnalysisSince February, the commodities asset class has surged ahead, overshadowing the S&P 500's faltering performance. This notable shift in market dynamics underscores the resilience and strength exhibited by commodities during this period.
Of particular interest are the XLE and XLU sectors, which have emerged as frontrunners since early March. This transition coincided with the decline in momentum of previously dominant sectors like XLK and SMH (refer to Fig. 2). Notably, XLE and XLU, characterized as growth defensive sectors, have thrived amidst market downturns. Investing in commodities and energy/utility sectors during these phases could have yielded significant profits, with select energy stocks boasting returns exceeding 25%, while the S&P 500 experienced an approximate 10% decline.
Looking ahead to May, it's anticipated that XLE and XLU will maintain their market leadership, albeit with a slight loss in momentum. However, investors are advised to remain vigilant as these sectors may soon witness a change in dynamics. It's crucial to employ stop limit orders to safeguard profits in such volatile conditions.
Following the current trajectory, XLY, XLRE, and XLF are poised to emerge as significant players in the market cycle (refer to Fig. 3&4). However, it's important to note that these sectors are susceptible to rapid momentum shifts, particularly when XLK and XLC regain momentum.
Looking towards June, indications suggest that XLK and XLC will likely regain prominence in the market. For buy-and-hold investors, this presents an opportune moment to consider purchasing assets during market dips.
Considering these market dynamics, my top investment picks are (TSLA), (GOOG), (AAPL), (ORCL), and Cisco Systems, Inc. (CSCO). These companies demonstrate strong growth potential, especially when timed strategically to align with sector rotation leadership shifts.


commodities high conviction entry in FebLooking back, commodities had a high conviction in february based on a longterm trend. Combining macd and BB break out.
Markets have either risk-on sentiment or defensive. During risk-on phase people want to put money to work, there is too much money. During risk-off or defensive, people want money and safety. Assets become too expensive. Bitcoin rallies during risk-on phases. Oil or gold can be either risk-on and risk-off . Markets are fascinating.
Faang can be a risk-on and risk-off, till everything becomes too expensive to have.
Markets leave clues. and they move on cycles.
It makes sense why commodities are risk-off . Small caps usually are risk-on (when economy does well, there are no global conflicts; ie the future is BRIGHT).
More concerns move the weight to risk-off , ie markets are a weighing machine longterm.
People tend to be stuck in one mood or another, and it's tough to adjust? markets can change gears quickly.

high convenience entries for Goldhigh convenience entries for Gold using GOLD/SPX, macd + BB.
2024: feb, march
2020: jan
2022: june (resistance)

BTC Analysis of Seasonal Trends in Financial MarketsThe first and simple indicator from Shark Trading is now publicly available, along with a lecture on the advantages of using the seasonal indicator. You can also find it on the Tradingview portal and support it with a like:
Dear Traders!
The seasonal indicator is a powerful analytical tool that helps you better understand the market and make more informed decisions. It not only provides visual representation of various seasonal changes but also helps identify patterns and trends that may go unnoticed in regular analysis.
An important feature of this indicator is the ability to customize the color scheme and transparency for each season, as well as choosing between the southern or northern hemisphere. This allows you to tailor the indicator to your preferences and analytical needs.
With the seasonal indicator, you'll be able to:
1. Gain a better understanding of the current market state: Displaying seasonal changes helps you better orient yourself in the current market position and identify potential trading opportunities.
2. Identify trends and cyclicality: Analyzing seasonal changes allows you to identify recurring patterns and cycles in the market, helping to forecast its future movement.
3. Optimize trading: Knowing seasonal trends enables you to optimize your trading strategy and make more reasoned decisions about entering and exiting trades.
4. Improve analytical skills: Working with the seasonal indicator helps you develop your analytical skills and improve your understanding of the market.
We invite you to read a more detailed article about this indicator and try using it in practice. This tool can become an invaluable assistant in your trading and help you reach new heights in your trading career. Don't miss the opportunity to improve your results - study and apply the seasonal indicator today!
______________________________________________________
Hello, dear traders! In this trading idea, we will present an overview of the seasonal indicator. The seasonal indicator settings allow you to change the color and transparency of each season, as well as have the function of selecting the hemisphere - southern or northern. In addition, this indicator includes an additional trend indicator that displays the direction of price movement.
In accordance with the color coding:
- Winter is denoted by blue color.
- Summer is represented by green color.
- Autumn is denoted by orange color.
- Spring is denoted by yellow color.
All elements on the chart of a certain color will be attributed to the corresponding season. For example, trend lines or levels marked in blue will be associated with the winter season.
______________________________________________________
Winter
Explanation of price movement in winter:
1. Number 1 and the blue line denote the maximum price of Bitcoin. Note that they always form at highs, which is consistent.
2. Number 2 and the blue line denote the minimum price specifically in the winter period. This is indeed the price minimum and the low point in the cycle.
3. Number 3 and the blue line denote a local maximum after which the price begins to rise towards line number 1, which acts as a global resistance.
4. Number 4 denotes the last winter cycle before breaking the global maximum. It should be noted that in 2017, the resistance was not broken immediately - first in the spring, and then at the beginning of 2018, the maximum was set and the asset's growth occurred in winter.
Additionally, it is worth noting that numbers 1 form the maximum, numbers 2 form the minimum, and since the trend is descending, its line is marked in blue.
______________________________________________________
Summer
Now let's consider the price behavior chart for the summer. To make the situation clearer, I've left a descending trend in blue on the graph. I reiterate, elements shown in green on the graph specifically pertain to the summer period.
1. Number 1 on the graph denotes the first summer period! The price during this period remains within a narrow range 90% of the time; however, it's worth noting that impulsive movements can occur at the beginning, middle, or end. Thus, 90% of the time, the price is in a low volatility zone, while the remaining percentage is in a high volatility zone.
2. Number 2 on the graph represents the second summer period, where a pattern is observed: the price tends to rise at the beginning of the summer period and fall towards the end. Therefore, I've marked this time with an arc, and there's a pattern to it. It's worth noting that during the period of the descending trend from 2014 to 2016, the situation after the downward trend differs from the situation in 2018 and 2023, when changes in the arrangement of this situation occur after the breakout of the descending trend based on wave analysis and the price of the asset itself.
3. Number 3 represents the third summer period! During this period, the price movement direction is upward and then downward, forming a correction in the upward trend. It should be noted that in this movement, all lows gradually rise, while highs renew all previous local highs of the asset price. This period exhibits increased volatility and impulsive movements, with the asset price mostly staying within a range of minimal volatility, with volatility not exceeding 1-2% on some stretches.
4. Under number 4, the fourth summer period is indicated, which has an overall upward direction. In this period, the movement is aggressively upward. Starting from the first month until the middle of summer, the price moves downward, forming a correction in the upward trend. Then, during the next month, the price moves aggressively upward, renewing price highs. Volatility in this period is anomalously high, resembling a hot July summer.
Additionally, based on the price movement in the summer period, we can assume that fractals are evident here, which we can use to our advantage for profit.
______________________________________________________
Shark Trading - We invite you to read a more detailed article about this indicator and try using it in practice. This tool can become an invaluable assistant in your trading and help you reach new heights in your trading career. Don't miss the opportunity to improve your results - study and apply the seasonal indicator today!
