Ethereum Reversal FebruaryI am watching February 3-6th for a market reversal leading to either a typical relief bounce or something stronger. There are some negative planetary aspects resuming in March and April.
However, throughout 2022 we could witness a flippening from old systems to new. The crypto market will also be aided by Uranus in Taurus, which is transiting through finance, possession, and value, the house that governs financial transactions, possession, and value.
A generation is represented by Uranus in Taurus, as it stays in the sign for seven years. In light of the fact that Uranus entered Taurus in 2018, right after Bitcoin reached its first All-Time High in December 2017 and leaves the sign in 2026, 2022 represents the centre of this transit.
Cycles

BTC Next 90 - 120 Days : Where is BTC Going ??? MOST PROBABLE 3 Months Ago, during BTC PEAK we published our 1st & 2nd "PUBLIC" chart.
Those charts nailed the bottom price and exact weeks each would happen, exactly.
Both were published when everyone in crypto was 100% bullish expecting $100k BTC.
Now we are publishing our 3rd chart, to show the " most likely " course BTC " should " take.
Remember there are no assurances in a currency that is controlled 99% by NEWS, FEAR & GREED
We have approached a worst Fear levels, based on War and USA FED Rates, and Inflation worries.
Things can a lot worse from here!
BUT : We do not expect that, unless there is more "highly" negative things happening in Wars, Markets, FOMC, Global Disasters.
We do expect a rebound coming very soon.
Here in this chart we show two BULL version of what will, if things continue the way they have been in the last 18 months.
We pulled the curve from the last dump and pump, and laid over the next 90 - 120 days.
Probable "Worst" Floors $27.5k around 2/22/22
But we are expecting things to move up this week, if not, then in approx 3 weeks from now.
Our first target will be $55k'ish. If we can break it and world politics turn positive, we can retest old and find new highs.
This is the ONLY number we hold tight to for now.
When there, we will publish the next chart.
Until then, we wait patiently to for several Spot ETF's to come, and that will move BTC into its next hyperbolic wave $100k plus targets.
Our hopes, Q3 - Q4 ETF 22
BLong

Bitcoin is frustrated, so are the traders... 😑 ⚠️ 😑Hi everyone 👋🏽
🕊 Wish y'all have a profitable lifestyle 🍀
📌 BTCUSDT- Daily Time Frame - Heiken Ashi
📌 Supply Demand - Wave Analysis - Support Resistance
📍BTCUSDT chart is looking so complicated nowadays... with having so many NEWS and such different ideas about the price's future
📍Let's go straight to the point, from Elliott wave point of view we may see a retest and pullback to 2 zones to complete the bullish correction of the previous bearish momentum:
1- 53600
2- 56800
📍After the pullback we may see the 41900$ which is the 0.5% Fibonacci and even 39600$ which is the 0.681% Fibonacci (I do not think we will see the second level) to complete the 5th elliott wave.
✍🏼 I personally think BTC and Crypto did not reverse in a bearish cycle yet so we still have some time left especially before the end of 2021.
✍🏼 I guess we might see another ATH before December but if this time price fails to break the 65k-69k zones we might need a very long time to see another ATH ever again!
⚠️ HOWEVER I want to mention that price growth is REALLY slowing down and becomes so frustrating at the moment; I can remember 30k zones back early this year; if we compare these 2 zone together we can clearly feel the frustration and how much lack of hype can influence the charts
⚠️ The latest correction / dump happened vastly due to the new OMICORN so called ''virus'' or ''pandemic'' but why did not we see a very huge dump as we have seen like the 13th March ? But WHY?
✍🏼 I have 3 answers for that:
1- People know how to deal with a new pandemic or so called "VIRUS"!
2- The fear about the new variant of so called "VIRUS" did not last long
3- WHALES did not feel like to dump the charts more than that :))
🤔 One thing that does annoys me is how unrealistic some predictions / TAs look in TradingView ideas?
🤔 How can someone have a 300k price target before end of the year, but suddenly after the 30% correction their target changes to 10k?
⚠️ It is very dangerous for other traders to follow others ideas especially with lack of evidence and or knowledge
⚠️ For having a 300k Bitcoin we need more than 5 trillion dollar TOTAL market cap and if you look wisely at the TOTAL chart you may find it a little bit unrealistic !
This is TOTAL chart along with RSI and its Hidden Divergence !
⚠️ Your money is valuable and so is your time. Do not rely on other opinions when trading and or investing!!! <3
THIS IS NOT A FINANCIAL ADVICE
PLEASE DO YOUR OWN RESEARCH BEFORE TAKING ANY SELL OR BUY POSITION
GOOD LUCK
NP TRADER

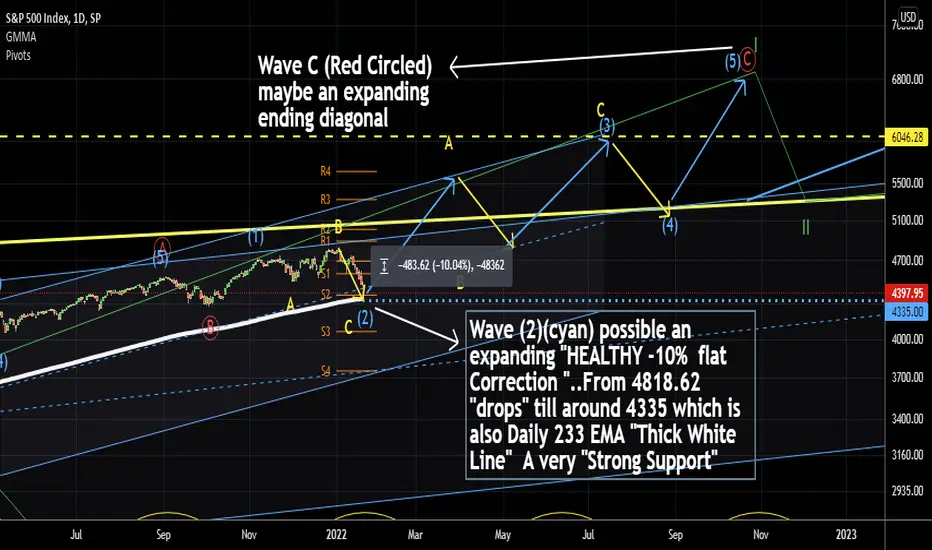
SPX may done " 10% correction" @ ≈4335. 24/Jan/22P/S : SPX. As I don't trade index nor do I need to "Hedge" against like those Fund Manages's "huge" long term stocks portfolio collection for the sake of "big draw down" .. I only "Follow-up" index Once a while as "a gauge" for "overall individuals stock" "healthy timing measurement" ..whether to "collect" or "dispose" individual stocks...
TOPGLOV "reversal" after CNY? 24/Jan/22TOPGLOV's "BIG BOSS" have "aggressively" "accumulated" "His" "Own Stocks" recently!!! Pls. checked "detail" at "attached" image on inside the "background" of this chart.

BTC - Lets Compare Cycles - 2014, 2018, 2022I plan to do a more comprehensive writeup on each cycle but one thing is clear- on higher timeframes Bitcoin is posting a distinct pattern this cycle, and a complete deviation from historical norms. In fact, you might reasonably suggest that based on the pattern alone, this is a bullish trajectory.
That said, obviously we have layers of complexity here, macroeconomic factors, more investors, more traders, more institutions and heavier whales than ever before. So pattern alone isn't a confirmation we will see upside this year.. perhaps we won't. But it does reflect the growing trust and adoption in the marketplace, as investors managed to drive up the support on higher timeframes while bears only managed to hold the line on a flat resistance in the upper $60k range.
In terms of where I'll confirm overwhelming bearish sentiment- I'm targeting $34k as my bottommost support. That is where the support from July 2021 currently sits. A bounce from there will still represent a higher high, it will still have served to flush all the leverage from the market and it won't invalidate the higher timeframe ascending triangle possibly at play.
That said, I need to do some more analysis this weekend.. and sleep on it a bit. More to follow thru the weekend.

Supercycles every 4 years on BTC. Easy explanation.2013; bitcoin suffered a big correction, it went down around 87%.
4 years after that correction began on 2017 another huge correction took place, this time bitcoin went down around 81%
and also 4 years after the 2017 correction on 2021-2022 a new correction might have began?
Well I actually think we are actually about to see how btc dumps, probably to 20k, due to the psychological power of 20k and also because it was the 2017 ath.
Double top on 65k might be one of the main reasons of this massive dump, resistance on that price range is really heavy.
20k is the fastest and easiest ways to get to 100k+.
I might be wrong, just my analysis. Thanks for reading, UrDaddyBB

BTCUSD cycles! What IF?What do we have today.
|Price fall cycles (12-13 bar/month), price growth cycles (35 bar/month).
|All cycles begin in December and end +- also in December.
|The percentage of price correction is almost equal (80-86%).
'
Does this mean that the next cycle is a price correction to ~$13,770?
@ALL STARS CAPITAL

AMC - Squeeze Scenario (Cycles, Patterns, Crash)(Not Financial Advice) Posting this scenario, constructed using the current (62 day Cycle) I have been tracking, as well as comparing them to both Doge's and Lucid's Cycle. This scenario also takes into account the possibility of a market crash event. The market is a bit shaky and there is a lot of uncertainty, if we see pressure start to drop the index's around April then a potential cup and handle pattern would be likely to play out, a ripple effect with overleveraged shorts on AMC, would be the ultimate catalyst imo.

Understanding 2022's Relation to the 2024 Bitcoin HalvingUnderstanding 2022's Relation to the 2024 Bitcoin Halving
January 15, 2022
Current Bitcoin Price: $43k
CRYPTOCAP:TOTAL $2.074T
Bitcoin's Halving Cycle
As I've mentioned since 2017, BTC halving events are fascinating - many know the past events have started with a trend low roughly 2.5Y prior, and finish approx. 1.5y at a new ATH. That trend seems to be holding true in 2022, in its relation to the 2020 halving event as we start to prepare for the event in 2024 that now lies ahead.
While this post does not dive into the skepticism surrounding the BTC Halving events as valid events for analysis, note that I will comment on the fact these trends are yet to be proven as obsolete. Mining represents the demand for bitcoin globally, and the increase of scarcity drives the demand for more supply upwards and hence price action results in a slingshot upwards.
Also, know that until we experience an event that is different, the following is true: Bitcoin price at the next halving event is always around 60% of the then ATH, and on its way up towards that ATH before slingshotting above for the year and a half after.
About the BTC Halving
In summary (for those who don't know) - Bitcoin halving events are when the rewards for mining Bitcoin transactions are cut in half. In theory this is a counter-measure taken to inflation, keeping price representative of 1BTC now = 1BTC later (as opposed to $1 USD now = $0.94 later etc.) The network cuts these rewards in half every 4 years and each 1.5 year period thereafter has seemingly provided a pricing 'boom' of sorts in which the bubble re-inflates as the price skyrockets in our fiat values. The first event was in 2012, then 2016 and 2020. There are consistencies and trends in price action that have emerged through these events. Any price estimations for these halving events are purely skeptical, but worth noting the similarities in them, as orders around these levels seem to fill each time and be in the approximate 'bottom' for the ensuing bull run.
Expectations for Price Action
2022 Entry Levels
If setting a buy in 2010 at $0.30 would have been considered a low bid, and the same for $300 in 2014 and another for $3000 in 2018, then strategically speaking, setting a buy at the $30k level for 2022 to fill for the halving event in 2024 would be both strategic and realistic.
2024 Halving Expectations
As with every other halving on record, I'd expect the price of BTC in March 2024 to be at the current all time high of $69k. This is consistent with what we've seen in each of the previous three in which we see price reclaiming the-then ATH before continuing upwards in price discovery to its future ATH.
2025 Exit Levels
If we hypothetically enter a bitcoin long in 2022 between $30k-$35k, and the same trend continues to be at $50k/$55k by March 2024, then expect by end of 2025 to be taking profits if you hold the same trade open (i'm sure nobody will, i'm speaking to a hypothetical scenario of course).
Cheers 🍻

BTC / USD Perfect Retrace Part 3Inverse Cup and Handle
Head and Shoulders
Cycle Dates
Downtrend Fibonacci Levels
Each Target is slowly been met at 28k on 2 May 2022 (50% retrace of a 26 week cycle (half year)

Tenaga Price may drop till around RM8.50. 13/Jan/221)On Charts : Charts consist of 3-Dimensions - The X-factor ( Time or Cycle ), The Y- factor ( Price Geometry ), AND The Z-factor ( The Speed ).. 2)On Elliot Wave / Market Structure : Unlike Textbook written rule : ALL Impulsive wave comprise of ONLY a-b-c sub-waves NOT 1,2,3,4,5 waves.. AND there is NO Truncated 5th wave BUT ONLY wrong wave counts...

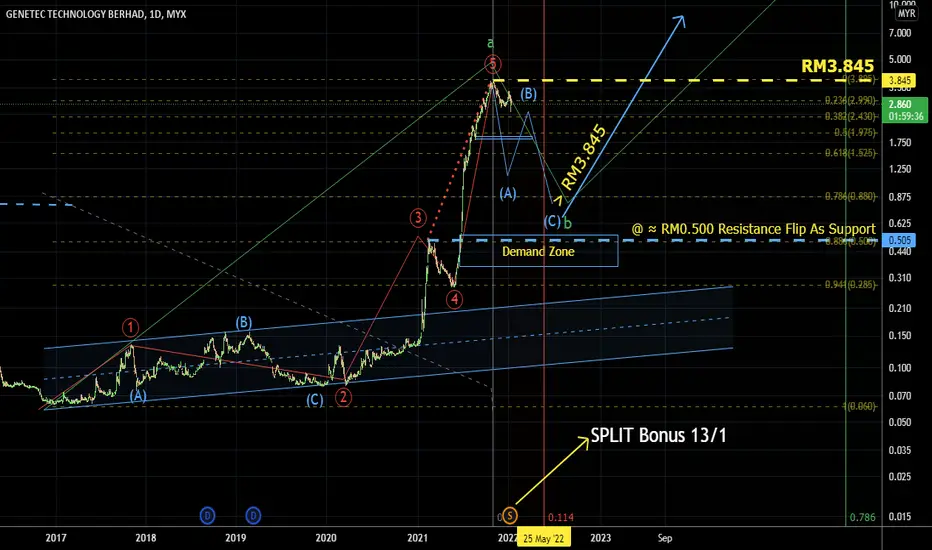
GENETEC possible drop to around RM0.50. 13/Jan/221)On Charts : Charts consist of 3-Dimensions - The X-factor ( Time or Cycle ), The Y- factor ( Price Geometry ), AND The Z-factor ( The Speed ).. 2)On Elliot Wave / Market Structure : Unlike Textbook written rule : ALL Impulsive wave comprise of ONLY a-b-c sub-waves NOT 1,2,3,4,5 waves.. AND there is NO Truncated 5th wave BUT ONLY wrong wave counts...

HARTA possible drop to around RM4.38.. 12/Jan/221)On Charts : Charts consist of 3-Dimensions - The X-factor ( Time or Cycle ), The Y- factor ( Price Geometry ), AND The Z-factor ( The Speed ).. 2)On Elliot Wave / Market Structure : Unlike Textbook written rule : ALL Impulsive wave comprise of ONLY a-b-c sub-waves NOT 1,2,3,4,5 waves.. AND there is NO Truncated 5th wave BUT ONLY wrong wave counts...

BITCOIN waves updated 12/Jan/22BITCOIN's Price possible retrace back to around 28000 at :- 1) Demand Zone 2) Support from parallel channel (cyan) ..for possible flat pattern in wave 4 (Yellow)

Elon In potential profit zoneAs you can see, the price started its bullish cycle in Oct. It finished the channel phase and entered into trading range phase, but not a normal trading range, It created trading range in pattern mode ( bullish triangle ).
Parts of the charts are:
Red line: short term bearish trend line ( one side of the triangle )
Dotted red line: extended bearish trend line
Green line: short term dynamic support ( another side of the triangle )
White lines: Main support zone
The Price broken both bearish trend line and extended one with 3 consecutive bullish candles and then has created a pullback with 2 pin bars and another small bearish candle. That's definitely a spike and its pullback, but the context does not support the idea that it's a start of a new bullish cycle which can create a new ATH, or just a minor cycle into the trading range and can go up and touches the previous ATH. For now, We do expect that the pullback continues to at least the broken extended line ( dotted ). If it goes further, the price will make pullback to the main bearish line ( red ) which also will be the cross of the red and the green line, so at that point, strong support it likely expected.
So at this point, the tp1 would be the previous high which will give %89.29 profits ( %161 if it goes down to the red line ) and at that point, we need to see the price momentum and decide to go for higher tps or we should take the profit.

Bitcoin Price AnalysisWelcome back,
Disclaimer: This is NOT trading advice. These are solely my opinions that I have posted for educational purposes only. I hope you make tons of money, I am not responsible for any financial losses. Thanks for reading!
Bitcoin has been in an overall downtrend since early November highs just under $65,000. Interestingly, Bitcoin has completed two 6 point cycles drawn out above on the weekly chart. The "1" starting points of each cycle began on the same bitcoin logarithmic growth curve each time; we appear to be finding support at the very same curve where we see the "1?" currently, and with the weekly RSI at lows we have not seen since March of 2020, coupled with possible inflection on the momentum indicators: it is possible we could be entering into the next accumulation phase.
4H
As we zoom in, the pattern suggests a bottom of $39,600. If we look at the growth curve however, a bottom of $40,269.36 is suggested. The local low of $40,571.23 is within 0.01% of this figure. Trend support/resistance lines are drawn at $52,100 ; $49,600 ; $48,000 ; $45,500 ; $39,600 ; and $28,750.
1H
On the hourly chart, Bitcoin is trading far below the 180h(blue) and 500h(orange) simple moving averages. Given the pattern drawn in red, it will be interesting to see how this one ages.
Do you think Bitcoin has found a bottom?

sell usdcadBreaking the trend line and synchronizing the cycles has prepared the conditions for sale

Btc technical analysis 2022This analysis is not based on patterns or indicators forming in the market, but it's more based on a previous cycle. Which we can't ignore in my opinion. Also I think we are going to see a lot of traders liquidated for trying to long on this current price level, and then get stopped out or liquidated. The chart will look like its going to continue a downtrend but its setting itself up for a new trend and using its previous support as new resistance. Where we are going to see an outbreak + retest. Then we are facing a lot other key resistance levels, if btc breaks them I think its high likely we will have a bull market. This is my current idea on the market and I have given my average entry on the chart (in gray on the scale) I will probably use a stop around 39/40k and I will swing into new all time highs!

ALGOBTC GOOD MOMENTUMAlgrand is located in an ascending major trend line and after reacting to the floor of this trendline, it is moving towards the target.
Due to the passage of a resistance and due to its strong momentum and ascending cycle, it can touch the specified targets.
The targets are marked with the help of Fibonacci and the resistance ahead
TP1: 0.00005400
TP2: 0.00006300
TP3: 0.00008000

BITCOIN SHORT TERM CYCLICAL ANALYSISA spectral analysis for Short Term Bitcoin Cycles.
It looks like if it follows very close Hurst Cycles with only a small deviation

BTCUSDTWill be bull cycle longer?
Last bull cycle was nearly 1Y longer then before.
If we talking about supercycle now - can we expect longer cycle again? Or our top was hitted already?
We´ll see what happen in 2022 :-) Where is true? Nobody know !!!
That´s a reason why you have to always use SL for your daily trades. There is no discussion possible. Always use SL.
If you invest your money for years... you should take profit on the highs of long term trends.
Simply but safe.
So I wish you in 2022 - no lose your money. Investing or trading it´s not sprint. It´s marathon. You can be lucky with high leverages. But the winner is know always after years.
Thing about it.
LBL_CZ
