TENAGA, AlgoSignal reveals potential uptrendSeveral indicators within my algorithmic system are signaling a potential uptrend. These include:
- Increased volume: Activity is picking up, suggesting growing interest and potential momentum.
- Mid- to long-term uptrend: Both the 50-day and 150-day exponential moving averages are pointing upward,
Next report date
Report period
Q1 2024
EPS estimate
0.17MYR
Revenue estimate
—
0.480MYR
2.77 BMYR
53.07 BMYR
3.33 B
About TENAGA NASIONAL BHD
Sector
Industry
CEO
Megat Jalaluddin bin Megat Hassan
Website
Headquarters
Kuala Lumpur
Employees (FY)
34.54 K
Founded
1949
ISIN
MYL5347OO009
FIGI
BBG000BBBLC0
Tenaga Nasional Bhd. engages in the business of the generation, transmission, distribution, and sales of electricity. The firm offers its products and services to commercial, industrial, and residential customers. The company was founded on September 1, 1949, and is headquartered in Kuala Lumpur, Malaysia.

Tenaga. Possible forming a “long term” triangle. 9/March/23. Tenaga. Long near Demand Zone @ 8.300 +/-, TP @ 11.380 +/-. a potential of 37.11% +/- growth.

Tenaga. Probably “bottomed” few months ago. 30/Dec/22Tenaga, as “main contributor” of KLCI Index probably “bottomed” so as KLCI. It’s wave a (green) of triangle already done few months ago and now “halfway” trending up to wave b (green) of triangle where 11.500 +/- is possible its wave location..

Tenaga. How “low” it could “go”? 11/Oct/22Tenaga. “Monopolized” electricity ..its price probably may only found its “base” at within RM7.250 ( Demand Zone + lower channel of pitchfork ) and RM 6.839 ( POC of volume Profile)..

Tenaga elliotwave updated 17/ August /22Tenaga most likely will resuming its downtrend toward around RM7.50 as price have completed a strong pullback toward monthly supply / base bar.

Tenaga. Is it “bottom”? 23/July/22.Tenaga while investors can earn average 6% dividend per annum + PLUS possible > 100% profit gain from stock price in long term...probably only “bottom” by years end of 2022 @ around RM7.50 on median line (dashed red) of parallel channel.

TENAGA I WILL WAIT IN AREA RM7.10-7.7This is my prediction for TENAGA . 100% wrong is in hand and if it goes right then its only coincidence. Possible places to monitor is @Fib 0.786- soon then it will rebound from there to make Impulsive wave 12345

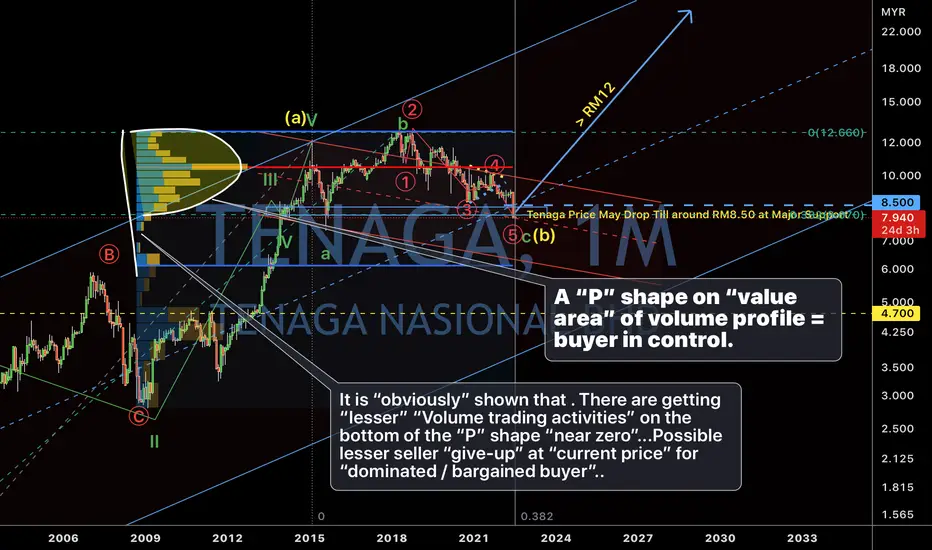
Tenaga. Trading it with volume profile. 5/July/22.Tenaga. . It is “obviously” shown that . There are getting “lesser” “Volume trading activities” on the bottom of the “P” shape “near zero”...Possible lesser seller “give-up” at “current price” for “dominated / bargained buyer”..
Down for now, Buy again at a discounted PriceMy view on TENAGA, price will be floating around $7 to $5.8 ish, looking for "big shark" purchase power around that area before it continues to go up. Fyi, TENAGA is one of my choice in term of 'dividend growth' investment. I will be looking to buy when I see weaker bearish. -FIN

Tenaga still waiting @ 8.50-8.30. 11/May/22Tenaga price still waiting to complete building its long term “base” at around RM8.50 RM8.30 where is the “multi” confluence zone for price landing to build a “concrete base”..

See all ideas
Trade directly on the supercharts through our supported, fully-verified and user-reviewed brokers.


Frequently Asked Questions
The current price of TENAGA is 12.320 MYR — it has increased by 2.50% in the past 24 hours. Watch TENAGA NASIONAL BHD stock price performance more closely on the chart.
Depending on the exchange, the stock ticker may vary. For instance, on MYX exchange TENAGA NASIONAL BHD stocks are traded under the ticker TENAGA.
TENAGA NASIONAL BHD is going to release the next earnings report on May 27, 2024. Keep track of upcoming events with our Earnings Calendar.
TENAGA stock is 3.00% volatile and has beta coefficient of 1.05. Track TENAGA NASIONAL BHD stock price on the chart and check out the list of the most volatile stocks — is TENAGA NASIONAL BHD there?
TENAGA earnings for the last quarter are 0.15 MYR per share, whereas the estimation was 0.20 MYR resulting in a −24.41% surprise. The estimated earnings for the next quarter are 0.27 MYR per share. See more details about TENAGA NASIONAL BHD earnings.
TENAGA NASIONAL BHD revenue for the last quarter amounts to 13.32 B MYR despite the estimated figure of 13.32 B MYR. In the next quarter revenue is expected to reach 13.65 B MYR.
Yes, you can track TENAGA NASIONAL BHD financials in yearly and quarterly reports right on TradingView.
TENAGA stock has risen by 3.88% compared to the previous week, the month change is a 7.69% rise, over the last year TENAGA NASIONAL BHD has showed a 37.35% increase.
TENAGA net income for the last quarter is 583.90 M MYR, while the quarter before that showed 856.20 M MYR of net income which accounts for −31.80% change. Track more TENAGA NASIONAL BHD financial stats to get the full picture.
Today TENAGA NASIONAL BHD has the market capitalization of 71.30 B, it has increased by 2.24% over the last week.
TENAGA NASIONAL BHD dividend yield was 4.58% in 2023, and payout ratio reached 95.83%. The year before the numbers were 4.78% and 76.22% correspondingly. See high-dividend stocks and find more opportunities for your portfolio.
Like other stocks, TENAGA shares are traded on stock exchanges, e.g. Nasdaq, Nyse, Euronext, and the easiest way to buy them is through an online stock broker. To do this, you need to open an account and follow a broker's procedures, then start trading. You can trade TENAGA NASIONAL BHD stock right from TradingView charts — choose your broker and connect to your account.
TENAGA reached its all-time high on Feb 4, 2015 with the price of 16.960 MYR, and its all-time low was 4.480 MYR and was reached on Feb 4, 2009. View more price dynamics on TENAGA chart.
See other stocks reaching their highest and lowest prices.
See other stocks reaching their highest and lowest prices.
As of May 4, 2024, the company has 34.54 K employees. See our rating of the largest employees — is TENAGA NASIONAL BHD on this list?
Investing in stocks requires a comprehensive research: you should carefully study all the available data, e.g. company's financials, related news, and its technical analysis. So TENAGA NASIONAL BHD technincal analysis shows the strong buy rating today, and its 1 week rating is strong buy. Since market conditions are prone to changes, it's worth looking a bit further into the future — according to the 1 month rating TENAGA NASIONAL BHD stock shows the buy signal. See more of TENAGA NASIONAL BHD technicals for a more comprehensive analysis.
If you're still not sure, try looking for inspiration in our curated watchlists.
If you're still not sure, try looking for inspiration in our curated watchlists.
We've gathered analysts' opinions on TENAGA NASIONAL BHD future price: according to them, TENAGA price has a max estimate of 17.21 MYR and a min estimate of 10.70 MYR. Watch TENAGA chart and read a more detailed TENAGA NASIONAL BHD stock forecast: see what analysts think of TENAGA NASIONAL BHD and suggest that you do with its stocks.
EBITDA measures a company's operating performance, its growth signifies an improvement in the efficiency of a company. TENAGA NASIONAL BHD EBITDA is 8.07 B MYR, and current EBITDA margin is 12.37%. See more stats in TENAGA NASIONAL BHD financial statements.