DXY Micro-Vector: 15m Shark Validation & The Consolidation TrapMicro-Technical Analysis Symbol: DXY (US Dollar Index) Timeframe: 15-Minute (Fractal Detail)
The Thesis: Precision Over Panic Following up on the Macro 1-Hour Shark Pattern, this 15-minute "Zoom-In" reveals the internal mechanics of the current consolidation. The post-PPI data "Nothingburger" has created a liquidity compression zone, validating our structural targets.
1. The 15m Algo-Grind We are witnessing a classic "Flagging" behavior post-event. The DXY is not breaking down; it is compressing.
The Vector: The market is coiling, building energy to push toward the Point D (96.80) completion zone identified on the hourly chart.
The Trap: This consolidation is designed to induce early shorts before the final liquidity sweep higher.
2. Harmonic Geometry
Structure: Bearish Shark / Cypher Hybrid.
Completion Zone (PRZ): 96.80 - 96.90.
Current State: Neutral/Consolidating at 96.60.
3. Strategic Operating Code We remain predominantly Bearish on the Dollar structure (Fiscal Dominance thesis), but we respect the geometry.
Watch: A "Stop Hunt" spike into the 96.80 zone.
Trigger: Look for rejection wicks at Point D to confirm the reversal. That is the "Kill Zone" for the Dollar and the launchpad for EUR/USD.
Verdict: The 1-Hour map sets the destination; this 15-minute chart times the arrival. Wait for the extension. Calculate, don't guess.
Analysis by, Brian Armbruster, MPA
Armbruster Capital
Master Logistician | Operating Code: Dec 25, 2023
Cypher-harmonic

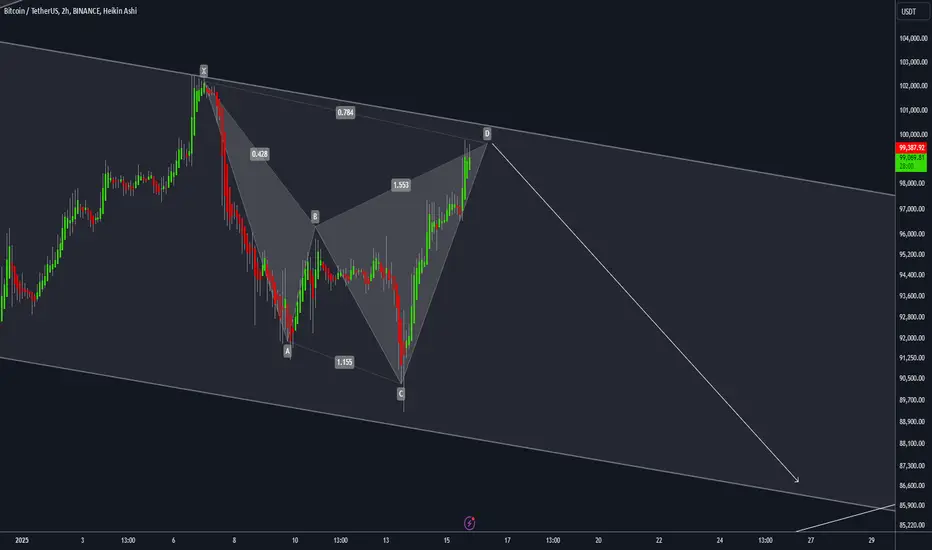
BTC — Cypher Pattern, Fading Momentum & What Comes NextAfter the –36% drop from ATH, Bitcoin has found support in the 80K–90K range, where price has now been chopping sideways for almost 60 days. This kind of consolidation is pretty typical after a sharp selloff.
Back in June 2025, I already mentioned that a potential Cypher harmonic could be forming on BTC. At the time it was still early, but months later the structure is lining up very cleanly and looks like it’s playing out step by step.
The 86K–82K zone remains a key support area that bulls need to defend. Losing this zone would be a big deal technically and would likely open the door for further downside.
Macro Context
Cypher patterns are powerful because they combine:
impulse exhaustion
failed continuation
deep retracement psychology
They tend to appear near major cycle inflection points, especially after extended bullish phases and distribution-style highs. This makes them particularly relevant in the current market environment.
Let’s break the structure down step by step.
Cypher Structure Breakdown (X–A–B–C–D)
BTC has respected the key Fibonacci relationships of a Cypher extremely well.
X → A: Impulse Move
This was a strong, clean impulsive leg showing clear bullish dominance and participation.
Psychology:
Late bears trapped, early longs confident
A → B: Pullback
Price retraced to 0.579, sitting nicely within the Cypher sweet spot (0.382–0.618).
Structure held, which is crucial.
Psychology:
Doubt kicks in → “Is the move over?” → weak hands get shaken out.
B → C: Expansion & Euphoria
BTC pushed to the 1.274 extension of XA, clearly exceeding point A.
This is where optimism peaked and momentum chasing kicked in.
Psychology:
FOMO → breakout buying → late-cycle confidence
C → D: Reversal Zone
This is the most important part of the structure.
0.786 retracement of XC
Completion zone around 65.5K
Strong overlap with:
2021 ATH
2024 trading range
Psychology:
Euphoria → disbelief → forced selling → acceptance.
Where We Are Now
Bitcoin is currently trading between C and D, meaning:
we’re in a corrective phase
volatility has faded
and for the first time in four years, we’re seeing a clear bearish bias after a long period of bullish momentum
100K psychological level remains the major overhead barrier. As long as price stays below this level, bulls are on the defensive.
Macro Check
The broader technical picture remains cautious:
Below previous yearly open (93.5K)
Above yearly open (87.6K)
Below weekly 21 EMA/SMA (98K-102K)
Above monthly 21 EMA/SMA (87K–89K)
Structurally, this looks very similar to previous cycle transitions where momentum slowly faded before deeper moves followed.
Scenarios Going Forward
🔴 Primary Scenario
If the Cypher continues to play out:
downside pressure persists
volatility expands near liquidity pockets
target zone sits around:
66K–64K, centered near the 0.786 Fib (~65.5K)
This would be a healthy macro correction.
🟢 Invalidation Scenario
The bearish structure weakens if:
BTC reclaims and holds above prior value
price shows acceptance above 100K
momentum flips bullish again
In that case, the Cypher either gets delayed or invalidated.
Final Thoughts
Right now, the data favors patience and caution.
The most ideal path would be:
a push into the 97K–100K resistance zone
followed by continuation lower toward the 74.5K year low, which I’d like to see taken out
In choppy conditions like this, no trade is still a trade. Staying flat, preserving capital, and waiting for clarity is often the smartest move. Plan your levels, set alerts, and only act when the market gives you a high-probability setup.
_________________________________
💬 If you found this helpful, drop a like and comment!

XAG/USD - Silver Vs USD - 1 h - Buy callOn 1 hr time frame, two harmonic patterns have been drawn. Shark and Cypher. Patterns are almost 90% complaint of standard values. Therefore, very high probability of achieving the target.
Price is just above EMA 200 and hence becomes very attractive for buying.
Trade values:
Buy : 72.25 (CMP)
SL: 69.85
TP-1 : 79.87
TP-2: 82.74

GFIL- PSX - Buy Call On daily TF, GFIL is making Cypher Harmonic Pattern.
A short term a day or two days trade is possible.
Trade Value:
Buy: 15.90 (CMP)
TP-1:16.40 (3.5% gain)
TP-2: 17.40 (9% gain)
SL:15.00

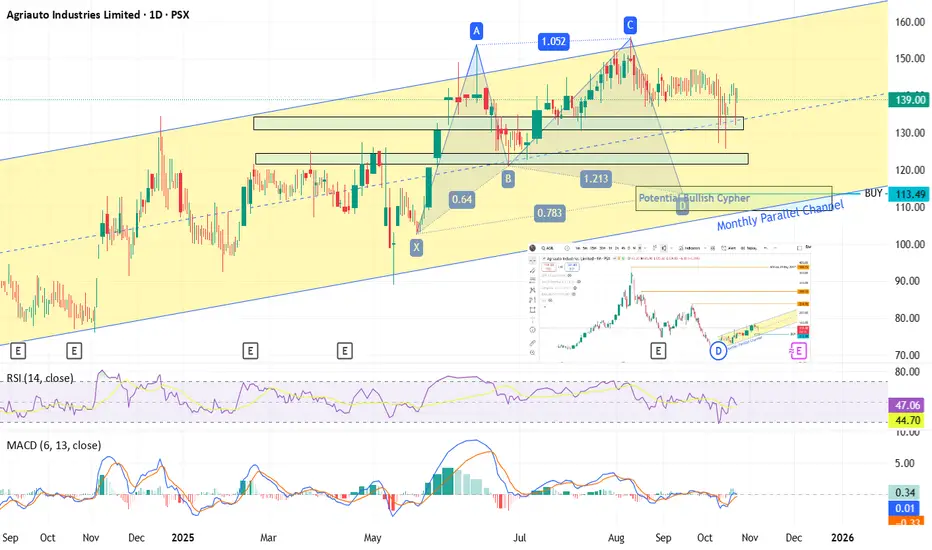
AGIL - PSX - Technical Analysis - Bullish Cypher PatternAgriauto Industries Ltd AGIL -PSX .
On monthly time frame, this SCRIPT is moving in a parallel channel.
On daily TF, Potential Bullish Harmonic Pattern has been drawn which identifies area to BUY around 113 ~ 116. However, two Support zones have also been marked for price to bounce up. Considering upper support zone, price has almost made double bottom and has potential to go up. However, fundamentally this SCRIPT is not rich in free cash availability alongside long term debt to pay. Therefore, until and unless some extraordinary measures are taken (especially getting into export to other countries) this SCRIPT will not perform as good as its peer competitors.
The ideal time to buy this SCRIPT will be once it breaks its monthly parallel channel which is around 160.
All those who already are holding it should consider exiting once price break even to their buying level.
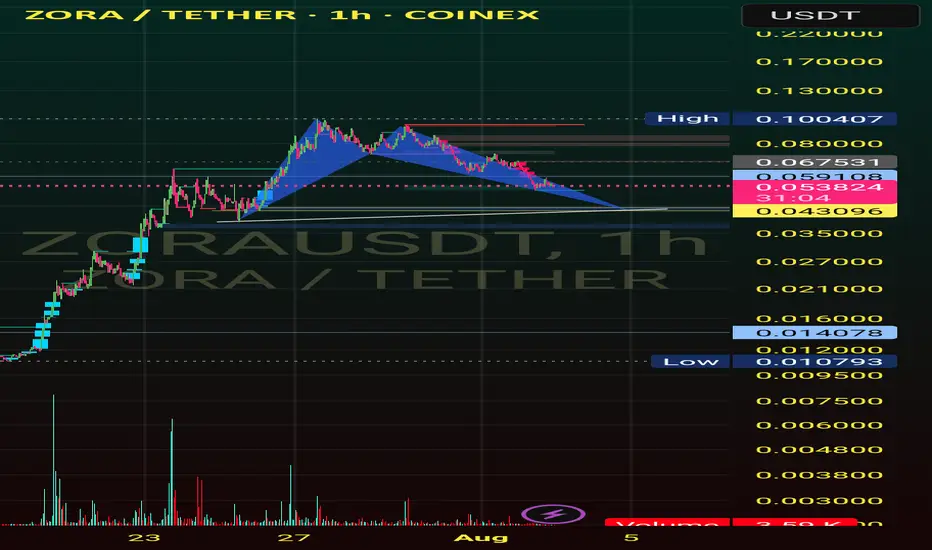
Cypher patternI see a Cypher Pattern on this chart, which could correct to lower areas for now. Again, please trade with your own analysis, I am not responsible for your profits or losses.📉
BITCOIN SHORT TERM UPDATE!!! Recently we have seen a great price move from 100K to 110K. We got clear Change Of Character , which indicates a sign of strength. Also we got bearish cypher harmonic pattern formed. So now we can expect a slight pullback up to 106-103k region from there we may see price reversing. But price should hold 100.3K region to remain bullish in short term.

Bitcoin's Roadmap: Price Structure, Fair Value & Market RhythmSince bottoming on November 21, 2022, Bitcoin has embarked on a remarkable bull run, rising +623.5% over 927 days and reaching a new all-time high (ATH) of ~112K.
When compared to the previous bull cycle, spanning 1061 days and producing a +2086% gain, this current rally shows signs of diminishing returns, a typical behaviour of maturing markets. Traders now face a critical question: has Bitcoin peaked for this cycle, or is another surge toward ~120K+ possible?
Historical Echoes: Elliott Wave Comparison
The 2018–2021 bull market formed a five-wave Elliott structure. That cycle ended with a -77.5% correction. The current cycle similarly traces out a completed five-wave advance from the $15.5K low, suggesting we may now be in a corrective phase.
Current hypothesis: Bitcoin is in Wave B of an ABC correction, with Wave C potentially targeting $64K–$70K.
Harmonic Confirmation: Cypher Sigma Pattern
A refined harmonic formation, I call it the Cypher Sigma Harmonic Pattern (CSHP) and it has proven highly effective in volatile assets like Bitcoin. It differs from the classic Cypher by:
BC projection: 1.07–1.136 of XA (vs. 1.272–1.414)
CD retracement: 0.786–0.886 of XC
BD extension: 1.272–1.618 of BC (not present in traditional Cypher but often targets 1.272-2.0)
In 2022, this pattern predicted the bottom near $16K. Currently, another Cypher Sigma is potentially forming, pointing to a possible correction to ~$64K. This target aligns with historical level (the 2021 ATH zone) and represents a possible -40% pullback.
Multi-Layered Technical Confluence
Pitchfork Resistance: Bitcoin rejected the upper resistance (Fib 1.0–1.136 zone)
Pitchfork Golden Pocket Support: ~$64K matches the golden pocket and high-liquidity area
Fibonacci Circles: Rejection precisely at the 1.618–1.65 circle arc (~$112K)
Speed Fan 0.618: Key structural support intersects projected retracement zone
Previous 2021 ATH
Together, these tools strongly support the hypothesis of a macro top forming.
Fair Value Trend Model (FVTM) – New Indicator
As part of ongoing research into Bitcoin’s long-term valuation, I developed the Fair Value Trend Model—a logarithmic regression-based indicator tailored for Bitcoin. Here is an example on the monthly timeframe.
Key Features:
Computes a log-log regression: ln(Price) vs ln(Days since inception)
Yields a power-law growth curve: F(t) = C · ^b
Includes dynamic channel bands at user-defined percentage offsets
Projects the trend forward in time with linear extrapolation
I have just freshly published this indicator for free on TradingView. Visit my profile, add it to your chart, and explore how Bitcoin consistently revisits its fair value in bear markets before launching new macro waves.
Use Cases:
Identify overextensions above the fair value channel
Spot mean-reversion setups near the lower channel band
Gauge long-term trend continuation via slope and forecast
The indicator is best used on daily, weekly and monthly charts, and it supports both all-time and rolling-window modes.
Educational Insight:
The Fair Value Trend Model isn’t just a tool! It's a lens to view the long-term rhythm of the Bitcoin market. By understanding where the fair value lies, you gain the clarity to separate short-term volatility from long-term opportunity.
Every great trader starts with a desire to understand. If you're learning, experimenting, and observing patiently—you’re on the right path. Let this model be your guide through the noise. Trust the math, respect the cycles, and never stop refining your edge.
Study day and swing trading, improve your technical and psychological skills, and wait patiently for high-probability trade setups, whether short-, medium-, or long-term. Being patient is key.
Psychological Insight: Mastery Over Impulse
The greatest returns favour the patient. Traders who ignored the noise in 2022 and accumulated around $16K were rewarded exponentially. As Bitcoin potentially enters a correction, the same principle applies: monitor, learn, and prepare—not panic.
Top-tier traders execute based on structure, not emotion. This cycle will reward those who:
-> Study multi-timeframe confluences
Outlook: Bearish Retracement, Bullish Opportunity
While a push to $120K+ is possible, the confluence of Elliott Wave, harmonic patterns, and macro tools suggest a potential 40% retracement into ~$64K by end of 2025/early 2026. This aligns with historical patterns and may offer a great buying opportunity.
This cycle isn’t about catching the exact top—it’s about navigating it intelligently. Use tools that reflect structural value, not just reactive price action. Combine the Fair Value Trend Model with other tools to gain clarity. Most importantly: remain curious, remain disciplined.
Happy trading.
Thanks for reading =) stay sharp, stay patient, and keep evolving 🚀
_________________________________
If you found this helpful, leave a like and comment below! Got requests for the next technical analysis? Let me know.

Bitcoin Dominance: Elliott Wave and Harmonics Combo (Part 2)MARKETSCOM:BITCOIN Dominance ( #BTC.D / CRYPTOCAP:BTC.D ) indeed started the rise I predicted back in late '22. CRYPTOCAP:BTC rose to the limits, exceeding the 100K Mark.
In #ElliottWave, this is Cycle Wave C (turquoise).
Primary Wave ① (white) completed, with the Corrective Primary Wave ②now in play.
The Correction will pave the way for Alt Season to commence, so the focus will shift to Alt Coins.
#Harmonics are showing #Cypher Patterns, a combo actually, on different degrees.
Bitcoin Dominance ( BTC.D ) Technical Analysis:
* Elliott Wave Impulse: Cycle C (turquoise)
* Harmonic Patterns: Bullish Cyphers
* 88.6% Fibonacci Retracement
* Break-Out with Divergence
* Leading Diagonal in Primary Wave ① (white)
Conclusion:
After a last rise, expecting MARKETSCOM:BITCOIN to top-out and start a Larger Correction.
Alt Season to start and deliver, based on #BTC losing ground.
After this, CRYPTOCAP:BTC to continue ruling, as the one and only #Cryptocurrency.

Bearish cypher ideaMy bear nose told me to tell you that it smells like a bearish cypher so I'm telling you.
Possible channels and waves. Keep it simple
BITCOIN new ATHs !? BITCOIN new all-time highs ?!
Hello ❤TV community 👋
The new year is still young and the bulls could really take off here ...
Here with a bullish option and a WolveWave(WW) and the targets on the upside.
🖥Intraday chart (12h) and everything important
💡 Everything important in the chart 👀
💥bullish CYPHER Harmonic 👀
👉Volume analysis 👀💪
👉Daily MA50 re-test 👀🔥
🔥BITCOIN roadmap/outlook (from 27th february 2024)
If you like this idea, please leave me a 🚀 and follow for updates 🔥⏰
Furthermore, any criticism is welcome as well as any suggestions etc. - You're also very welcome to share this idea.
Have a nice evening & successful trading decisions 💪
M_a_d_d_e_n ✌
NOTE: The above information represents my idea and is not an investment/trading recommendation! Without any guarantee & exclusion of liability!

Classic Cypher PatternTatacomm made made cypher pattern on daily charts wih decent oi.
All indicators (MACD,RSI & ADX) positive.
Risk:Reward = 1:3

ALGORAND ROCKET SHIP!!I believe Algorand has bottomed in the way of a bullish shark or cypher pattern. I've outlined entry and exit points. I have accumulated a crap ton of Algo. I just wanted to let you all know. Now you do what you want with this info. Good luck

Unfolding Patterns in Gold: Bullish Gartley and Bearish CypherGood day traders,
It's been a while, and I trust everyone has been doing great.
Permit me to share my thoughts on the Gold market and the potentially unfolding patterns I am anticipating.
In the current gold market, I have identified two potential harmonic patterns that may be unfolding. The first and larger pattern is a potential bullish Gartley pattern. The X leg originates at 2286.83, and the A leg peaks at 2483.74, establishing the impulse legs. The B leg appears to have completed at 2365.915, corresponding to a 61.8% retracement of the XA leg. At the B leg, the price seems to be finding support. If this support holds, I anticipate a rally towards the 2430-2442 region to form the C leg. Subsequently, I would expect a price drop, provided it is indeed a Gartley pattern. A decline below 2341.540 would invalidate the Gartley pattern formation.
The second and smaller pattern is a potential bearish Cypher pattern. The X leg began at 2483.74, and the A leg seems to have completed at 2383.930. The XA leg was retraced by less than 50% Fibonacci at 2413.715, forming the B leg. Currently, it appears that the price is finding support at 2365.915, which could potentially be the C leg. If this support level holds, we might expect a rally towards the 2430-2442 region, confirming the larger Gartley pattern. If the Cypher pattern is valid, we could see a further rise in price towards the 2471.64 and 2480.00 region to complete the bearish Cypher before a subsequent drop. A drop below 2363.655 would invalidate the potential Cypher pattern formation.
It would be best to wait for a break above the 2384.518 price region in order to allow the market show commitment to move higher. This could provide additional confidence in the outlined outlook. Please note that these patterns may not be formed eventually.
Cheers and happy trading!

Cypher Bearish Pattern on ROKU (3H Timeframe)🔍 Overview:
Spotted a bearish Cypher pattern on ROKU's 3-hour chart. This setup looks promising for a short trade! 📉 The RVOL average is increasing, which gives us a bearish confirmation. However, be cautious as the "High Volatility" dots indicate potential for drastic and unpredictable moves. 📊
📉 Chart Analysis:
1️⃣ The Cypher pattern indicates a potential reversal from the recent uptrend, with resistance around the $64.28 level.
2️⃣ The increasing RVOL average supports the bearish sentiment, suggesting more sellers are entering the market. 📈
🎯 Trade Setup:
Entry Point: Look for confirmations as the price approaches the resistance level.
Target 1: $58.86 💰
Stop Loss: $64.28 🚨
📝 Why I'm Interested:
The combination of the Cypher pattern and increasing RVOL provides a strong bearish signal. The "High Volatility" dots highlight the need for caution but also present an opportunity for quick profits if managed carefully. 📊📉
📅 Timeframe: Monitoring this setup on a 3-hour chart, so keep an eye on shorter-term price movements. ⏳
🔔 Stay Updated: Be ready to adapt your strategy as the price action unfolds. Let's get it! 🤑✌️
#ROKU #CypherPattern #RVOL #HighVolatility #Trading #StockMarket #TechnicalAnalysis #TradeTalkFarsi 📉🐻

CVX making bullish Cypher Harmonic PatternCVX is in the process of making a bullish Cypher Harmonic Pattern. We are in a zone that could possibly become the bottom, but first we have to establish the bottom. And then we can aim for 3 green fib zones for taking profits. Please note that we are in a downward channel move, so for sure, breaking out from this channel can be very bullish.

AMD making bullish Cypher Harmonic PatternAMD is in the process of making a bullish Cypher Harmonic Pattern. We are in a zone that could possibly become the bottom, but first we have to establish the bottom. And then we can aim for 3 green fib zones for taking profits.

PYPL making bullish Cypher Harmonic PatternPYPL is in the process of making a bullish Cypher Harmonic Pattern. We are in a zone that could possibly become the bottom, but first we have to establish the bottom. And then we can aim for 3 Golden fib zones for taking profits.

DKNG final pattern to target Doing a final look at the price action of DKNG and it seems we are in a huge cypher pattern. Price will need to kick back up and hold at 30 (magenta line). Its been my experience these patterns typically have the deep retracement and then rally back upside. They can be fast going up and then dramatically deceiving and slow coming down. The pattern terminates 37.55 , but the Gann box is at 40.. so I am suspecting (without confirmation at this time) that a new mico bullish harmonic will develop at the APEX. Thsi is also near the 3/1 Gann angle and usually is a strong terminating or promoting area. In this case I think this pattern will draw in late comers and then the dramatic drop in price will commence, but 40 remains the target until we can get additional information later in this cycle. NOTE: The top is the same top from the previous charts for DKNG.

BTC Bearish CypherWe saw a bearish Cypher play out on the higher time frames for BTC. About 500 points away from a perfect 786 touch but, this is still valid. The smaller Butterfly played out. Thank you

BTC Geometric Price and Time projectionThis chart looks at a 200-day dominant cycle of BTC (current DC is actually 185 days peak to peak represented int he Gann Box). Based on this analysis with geometry and gann boxes at the 185-day dominant cycle length, I see a price for BTC at 39K by October. I think this is a very conservative target. That said the geometry of it all cannot be ignored. The 0.25 and 2.5 shows up in multiple places with a perfect 0.33 on the 0.25 Gann Box representing the price axis bringing completion of peak to peak at 185-200 day cycle around 39,000 - 40,000. I could also see a flash dump in the next day or two down to 29,600, but that is the bottom. BTC has moved sideways for the majority of its declining cycle strength which tells me it has strength. Long story short I would not be trading this market and accumulating for the longer-term is probably the best move.

EURCAD ADVANCE HARMONICS PATTERN EURCAD has formed an advancve harmonics pattern Chypher Bullish on its daily chart.
The price is trading below near the long entry level EL: 1.43684.
ST: 1.43045
Targets:
23% CD: 1.45138
38% CD: 1.46409
62% CD: 1.48496
79% CD: 1.49947

Bitcoin Bruh!This weekly chart is making my whiskers twitch.
I've been out all night, running in the woods.
If the Cypher is real, we are going to the moon!
If the Bear Flag is real, I'll be running for the hills with my tail between my legs!
What do you think?
Owhooooo!
