ETH.D : 5-Wave Bull Run Over –Bitcoin to Outshine EthereumeEthereum Dominance (ETH.D) has completed a textbook 5-wave impulsive rally on the weekly timeframe, signaling the end of its upward cycle and entry into a deep corrective phase. As of August , ETH.D at 13.37% is rejecting the key order block at ~14%, hinting at weakening momentum. This shift favors Bitcoin's outperformance, as capital rotates from ETH to BTC, potentially boosting BTC/ETH ratio and Bitcoin returns during the downturn.
NeoWave Wave Count (Daily Chart):
The rally from ~10.5% lows unfolded in 5 waves: Wave 1 to ~11.41%, Wave 2 correction to ~10.11%, Wave 3 extended to ~13.97% (161.8% of Wave 1), Wave 4 shallow to ~13.32%, and Wave 5 topping at 13.97% with the 1.618 Fib extension (1.141%).
Monowave count (~55-70 subwaves) validates the impulse, with alternation (Wave 2 deep/time-extended, Wave 4 shallow/short). The ascending channel (yellow) has been touched multiple times, and the recent rejection confirms exhaustion.
Weekly Chart Insight:
On the weekly TF, ETH.D has hit a major order block at ~14% (1.425%), not the channel top, coinciding with the 1.618 Fib extension from 2023 lows and historical resistance from 2018 highs (~52%). This multi-year descending channel holds firm, with price failing to break the OB—suggesting reversal to midline ~12.5% or lower (38.2%-50% Fib retrace of rally).
Why Bitcoin Outperforms From Here:
As ETH.D corrects (likely a Zigzag or Flat, targeting 11%-12%), Bitcoin gains dominance, driving better returns for BTC holders. Expect BTC/ETH ratio to climb (current ~12.5, target 14-15), with Bitcoin yielding 10-20% superior performance in risk-off environments. If ETH.D drops below 12.5%, correction accelerates to 10% (78.6% Fib), amplifying BTC's edge.
Trade Idea (Bearish ETH.D / Bullish BTC):
Entry: Short ETH.D (or long BTC/ETH pair) below 13.32% on BOS confirmation in weekly.
Targets: TP1 at 12.5% (channel midline), TP2 at 11% (50% Fib).
Stop Loss: Above 14.25% (OB high, R:R ~1:3).
Sizing: 1-2% capital; trail stops on midline breaks. Watch dominance flips—crypto rotations can spark quick BTC pumps.
ETH bulls, pivot to BTC now! #ETHDominance #NeoWave #BitcoinOutperformance #CryptoAnalysis
D-ETH

ETH 1H | Signs of a Bottom, But Needs Confirmation
ETH on the 1H timeframe
ETH has lost the 0.5 Fib at $4310 and is now testing the local support zone.
1. A death cross occurred at the start of the week.
2. RSI and MACD are both showing bullish divergence.
3. Price is trying to hold local support.
Put together, these signs could signal a potential bottom, but confirmation is key.
If support holds, the setup strengthens. Until then, we watch it unfold.
Always take profits and manage risk.
Interaction is welcome.

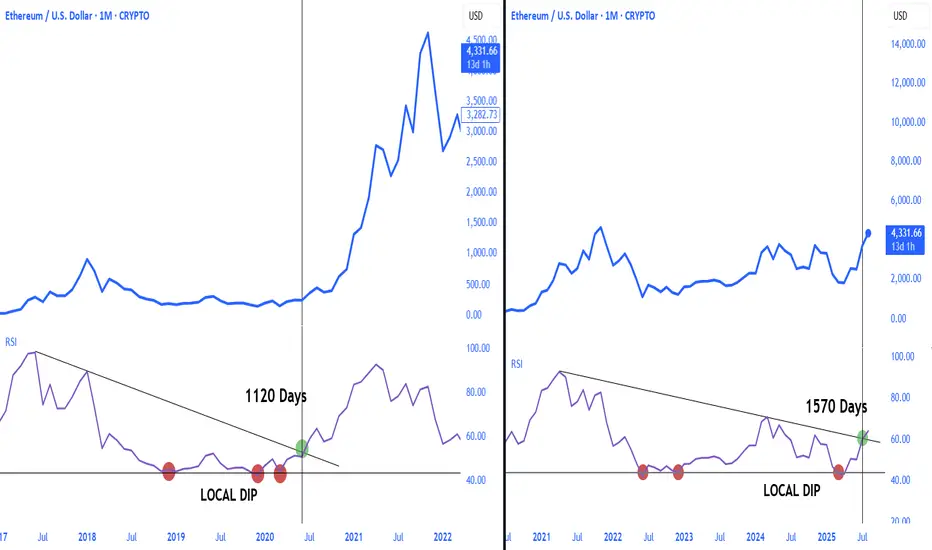
Ethereum at the beginning of a parabolic run As confirmed by Ethereum's RSI, the major breakout that occurred 1,570 days later confirms the start of a parabolic run.
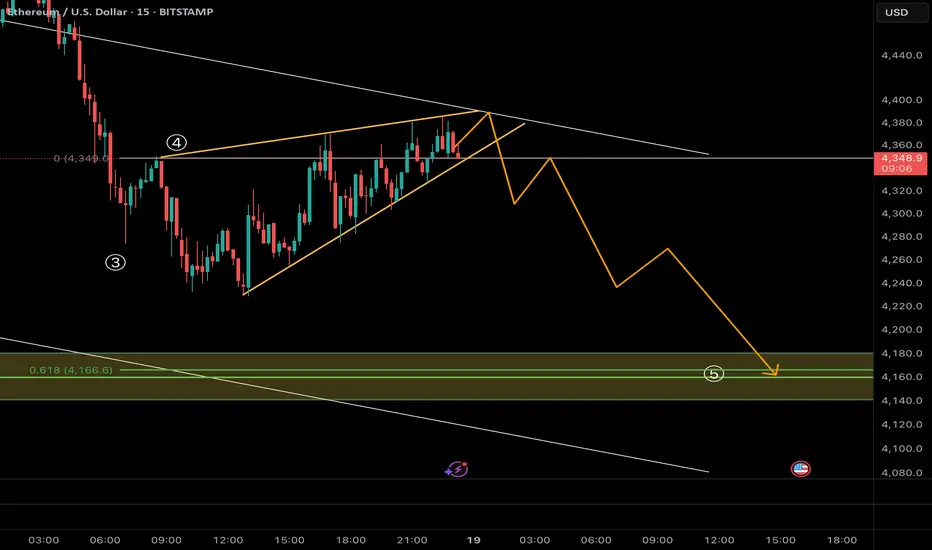
Close view of ETH Short Description : the possible next Move of ETH Shown in graph. ETH can drop to 4100 as 5th wave of correction pattern
ETH - Eyes on a New All-Time High?ETHUSDT has been on fire lately, following a textbook bullish structure of Impulse → Fakeout → Impulse.
After breaking above the previous range in July, ETH confirmed strength with a sharp impulse move, only to shake out weak hands via a fakeout retest before pushing higher again. 📈
Currently, ETH is in the midst of another impulsive leg, with the next major target sitting at the ATH around $4,876.
📊 Key Notes:
- Fakeouts have served as liquidity grabs before strong rallies 🏹
- Current momentum favors the bulls 🐂
- As long as price holds above the last breakout zone (~$4,050–$4,150), the path of least resistance remains up.
🎯 Next Stop: ATH and beyond if bullish pressure sustains.
📚 Always follow your trading plan regarding entry, risk management, and trade management.
Good luck!
All Strategies Are Good; If Managed Properly!
~Richard Nasr

Ethereum will consolidate above $4k ┆ HolderStatBYBIT:ETHUSDT on the 16h chart is pulling back after strong rallies, retesting the $4,000 support level. Sideways and consolidation phases remain visible, showing demand. As long as $4,000 holds, targets at 4,600–5,000 stay valid.

Ethereum's Bullish Market Conditions Intact —$11,111 NextNothing changes here. I am looking at the weekly timeframe and it seems Ether is ultra-bullish, it is literally growing above resistance.
The very insistent and annoying resistance from March 2024 was broken just last week. And as ETHUSDT trades above this level, it started to grow. This week is the first week above resistance and the chart looks great.
Things can change. But things can change. We can see multiple red candles show up and lower prices but this isn't what we have on the chart today. Right now we have strong bullish action, strong bullish candles, strong momentum, the break of resistance, the highest prices in four years and accumulating bullish volume. The chart doesn't point down rather it is saying "additional growth."
Ethereum will continue growing. Just think about it: One day ETHUSDT is trading at $1,500 and starts to go up. Four months later, ETH is trading at $5,000.
Thanks a lot for your continued support.
The next target is $6,000 to stop blank at $7,330 to continue rising until we go beyond $10,000, a price tag of $11,111 for this 2025/26 bull run. There is enough time in 2025 for ETH to produce a full bullish cycle. This chart doesn't need 2026. If it extends, better.
Namaste.

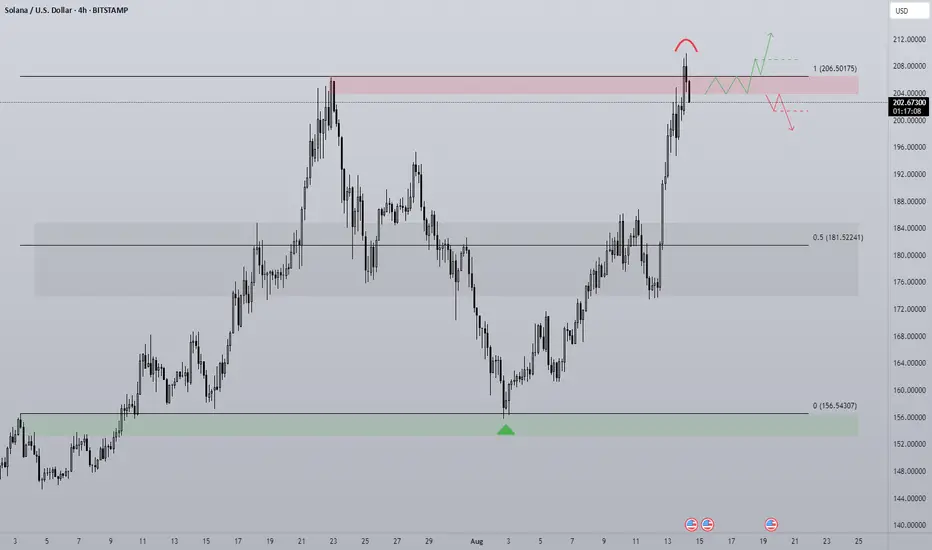
SOL - Breakout or Rangebound?For me this chart is quite simple with two options, a bullish and bearish scenario. SOL is currently rangebound but the massive momentum in the broader market has opened the door to a potential breakout of this trading environment.
To look at the context of the chart we has a clear push from the midpoint up to range high, very little in the way of pullbacks until price breaks up above the old local high. We know that generally stop losses hide behind a key high or low and so price trading into it with such momentum is something to note when entering a trade at this level.
Liquidations for SOL are currently 50:50 long and short and so this balance shows no clear liquidation event in one particular way, at least not yet.
Bullish scenario -
SOL continues the rally above the range, strong volume to confirm that price is ready to expand beyond the area that failed in the past. A retest of $206 with a strong bounce gives this move a higher probability and proof buyers are still willing to buy at the level. Idea is invalid should price accept back below the range high, signifying buyers are not ready to sustain rally continuation.
Bearish scenario -
Price accepts below range high and shows that buyers are not willing to expend beyond the range. Naturally a retreat would then follow as the bears defend the same point that they successfully defended in the past (range high). Any price action that resembles chop within the red box would be a non action area as there is an area of balance giving no clear clue of direction either way.
$ETH Topping Without All Time High?Has the most anticipated all time high of the year been cancelled? The crowd does not get what it wants! Everyone from CNBC to my grandmas goldfish have been bullish on ETH for the past few months so what a fitting psychological mess it would be if we significantly pulled back here!
Firstly it may just be a temporary set back to the High Volume Node support at $3900 before a move to all time high. Even then I am expecting a deeper pullback to set us up for all time high in Q4. Losing this support bring up the ascending daily 200EMA right at the Fibonacci golden pocket, which you can see is the wave 3 high!
The next target, which is my next buy level, is the larger degree Fibonacci golden pocket, major support High Volume Node and wave 4 bottom at $2100. This would be a capitulation area for many!
RSI has printed confirmed bearish divergence with plenty of room to fall.
Safe trading

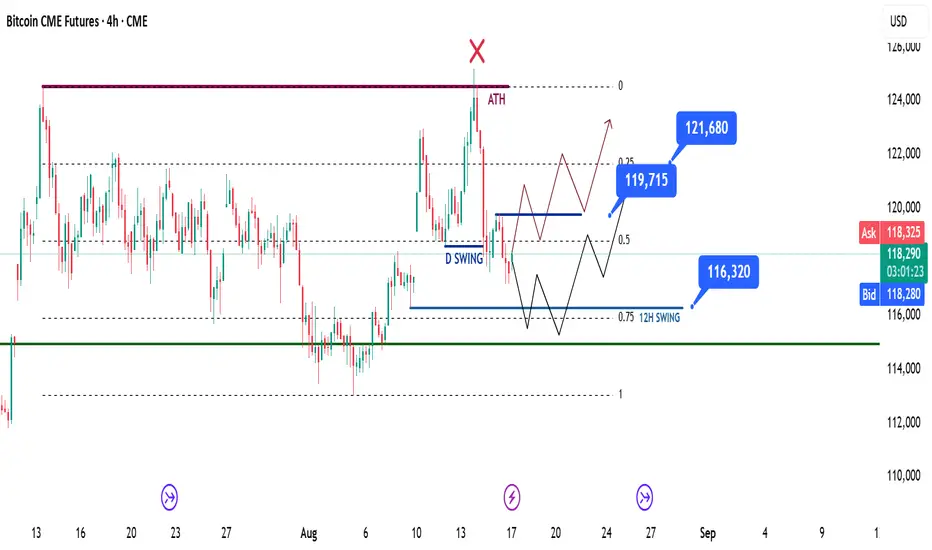
18/08/25 Weekly OutlookLast weeks high: $124,475.68
Last weeks low: $116,828.03
Midpoint: $120,651.85
Another new ATH for BTC but are there signs of weakness beginning to show?
Last week Bitcoin hit a new ATH just shy of $124,500, a remarkable achievement but the reaction from that level to me is not a good one. Using the RSI indicator it is clear that on the daily time frame both the July top and now the most recent top form a bearish divergence. Higher time frame bearish divergences are strong trend reversal indicators. On the hour timeframe both tops also formed a local bearish divergence, to me this is a double sign of an exhausted rally.
This is not to say the end of the cycle is here by no means, what it does suggest is that the bulls are tired and a correction could be round the corner. From here I think logically the $111,000 & $108,000 levels could provide support this week on any pullback continuation. From a macro perspective we still have rate cuts to come next month, An ever growing M2 Global Money Supply to feed the market and a hungry institutional investor race to acquire digital assets. All this points towards the bullaun continuing but In my opinion after a cooling off period, after all August and September are famously bad months for BTC for returns.
Ethereum on the other hand continues to impress this a record $2.85B ETF net Inflows. $3.75B net inflows for digital assets as a whole. No break of ATH as yet but the momentum is certainly there. BTC will need to stand strong for ETH to push past $4,800.
This week I'm keeping a close eye on how BTC reacts to any pullbacks, judging market order flow to see if this is a shallow pullback or maybe a prolonged one that results in a rangebound environment.
FED chair Powell does speak this week so possible volatility should he announce anything significant.
Good luck this week everybody!

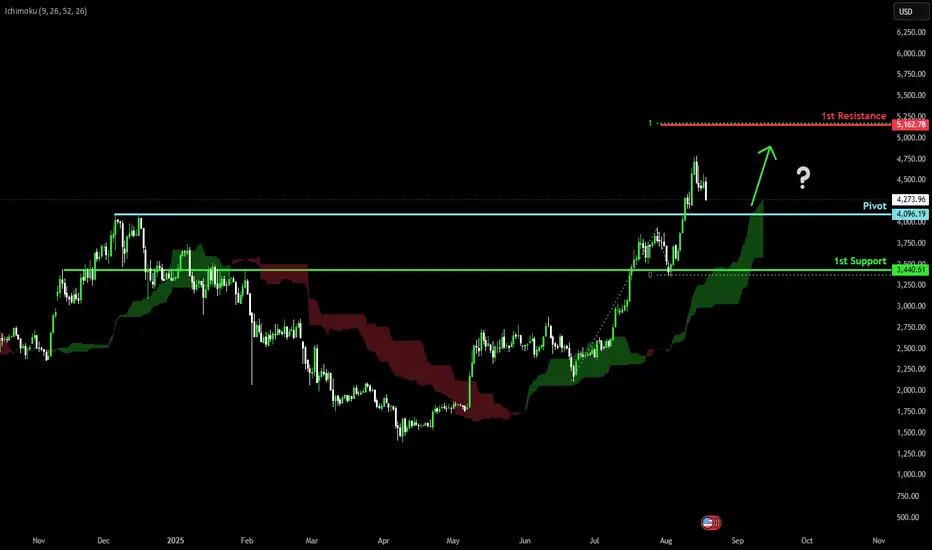
Falling towards pullback support?Ethereum (ETH/USD) is falling towards the pivot, which has been identified as a pullback support and could bounce to the 1st resistance.
Pivot: 4,096.19
1st Support: 3,440.61
1st Resistance: 5,162.78
Risk Warning:
Trading Forex and CFDs carries a high level of risk to your capital and you should only trade with money you can afford to lose. Trading Forex and CFDs may not be suitable for all investors, so please ensure that you fully understand the risks involved and seek independent advice if necessary.
Disclaimer:
The above opinions given constitute general market commentary, and do not constitute the opinion or advice of IC Markets or any form of personal or investment advice.
Any opinions, news, research, analyses, prices, other information, or links to third-party sites contained on this website are provided on an "as-is" basis, are intended only to be informative, is not an advice nor a recommendation, nor research, or a record of our trading prices, or an offer of, or solicitation for a transaction in any financial instrument and thus should not be treated as such. The information provided does not involve any specific investment objectives, financial situation and needs of any specific person who may receive it. Please be aware, that past performance is not a reliable indicator of future performance and/or results. Past Performance or Forward-looking scenarios based upon the reasonable beliefs of the third-party provider are not a guarantee of future performance. Actual results may differ materially from those anticipated in forward-looking or past performance statements. IC Markets makes no representation or warranty and assumes no liability as to the accuracy or completeness of the information provided, nor any loss arising from any investment based on a recommendation, forecast or any information supplied by any third-party.
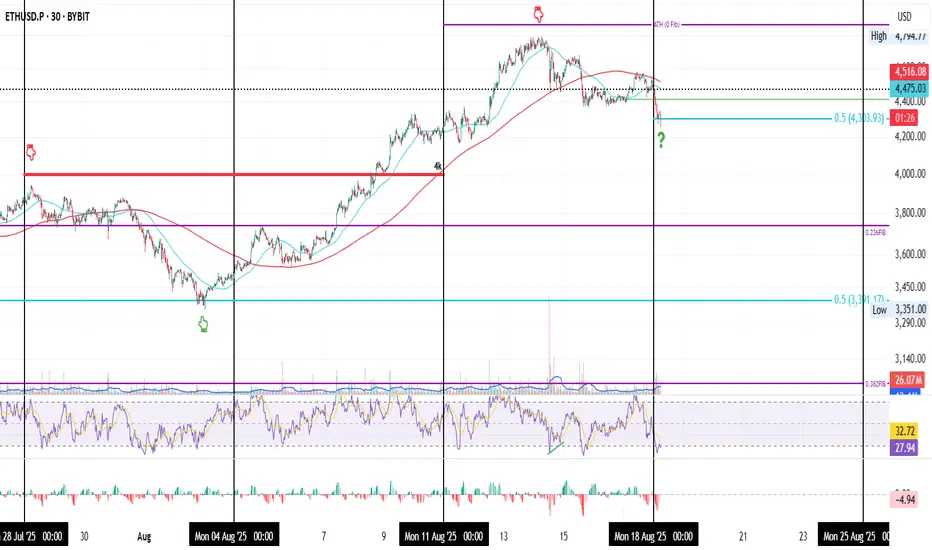
ETH’s Predator Move on the 30min time rame
This is ETH on the 30min timeframe over the past 3 weeks.
It started on Monday, July 28, when price was rejected at the $4K resistance after a Sunday night pump. What followed was nearly half a week of chop, then a drop that found support at the 0.5 Fib = $3391 (the midpoint between the 0.382 and 0.236 levels). From there, ETH rallied +43% to its ATH.
Last week, the same scenario repeated: price rejected from ATH (0 Fib), chopped half a week, then fell Sunday night, this time finding support at the 0.5 Fib = $4303 (the midpoint between the 0.236 and 0 levels).
Now the question is: will this 10% drop be enough to reload for another attempt at ATH, or will price need to retrace deeper to gather the liquidity needed?
One thing is certain: this is a leverage flush. If you’re riding high leverage, understand that you are the prey, and price is the predator. To survive, you need to shed some leverage weight before it catches you.
Always take profits and manage risk.
Interaction is welcome.
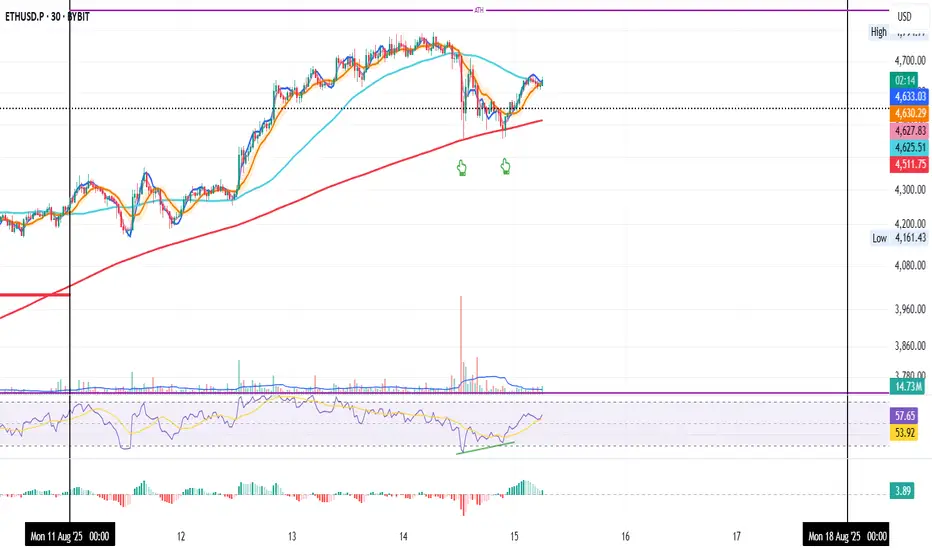
ETH 30min: Double Bottom Setting Up Another ATH Test
ETH on the 30-Min
Yesterday, ETH printed a clean double bottom right on the 200MA.
RSI showed bullish divergence at the same time, a strong reversal signal.
Now, price is holding support at the BB center and 50MA.
If these two levels hold, we could see another push toward the ATH.
Always take profits and manage risk.
Interaction is welcome.
BTC Weekly Recap & Game Plan 17.08.2025BTC Weekly Recap & Game Plan 17.08.2025
📊 Market Sentiment
Overall sentiment remains bullish, supported by expectations of a 0.25% rate cut in the upcoming FOMC meeting. A weakening USD and increasing global risk appetite are creating favorable conditions for further upside in crypto assets.
📈 Technical Analysis
Price ran the daily swing liquidity but couldn’t close above it.
Additionally, price has tapped into the equilibrium level, which makes this a discount zone in my view.
📌 Game Plan
There are two possible scenarios to watch:
First scenario (red):
→ Price closes above 119,725$, then I’ll be looking for entries around 118,750$.
Second scenario (black):
→ Price may retrace further to 116,310$, marked by 12H swing liquidity.
→ This level also aligns with the 0.75 Fibonacci retracement, which is my max discount zone.
🎯 Setup Trigger
I’ll be watching for a 4H–1H break of structure (BOS) to initiate entries.
📋 Trade Management
Stoploss: 4H–1H swing low confirming the BOS
Targets:
TP1: 121,680$
TP2: 124,500$
💬 Like, follow, and comment if you find this setup valuable!
⚠️ Disclaimer: This content is for informational and educational purposes only and does not constitute financial, investment, or trading advice. Always do your own research before making any financial decisions.
ETH — Right-Angled Broadening BreakoutEthereum (ETH) has completed a Right-Angled Descending Broadening Pattern that developed over a period of 515 days. Such long-term structures are rare and often mark significant turning points in the market.
🔎 Pattern Breakdown
A–E → swings inside the broadening formation.
F → breakout above the flat resistance.
G (anticipated) → Retest of the breakout zone near $4000, where former resistance may establish itself as support.
The flat top resistance between $4000–$4100 has already given way. A successful retest and hold above this zone would confirm breakout validity and strengthen the probability of continuation toward ATH and beyond.
Trade Setup View
Retest entry zone (G): ~$4000
Invalidation (Stop-Loss): To be determined based on price action during the retest
TP1: Retest of ATH $4867
TP2: $5390
Final target (measured move): $6800
Risk-to-Reward: 1:7+ potential
Why $6800?
The measured move of a broadening formation is its full height projected upward from the breakout point:
Broadening low: $1383.26
Broadening high: $4109
➡️ Height = $2725.74
Add that to the breakout zone (~$4100) → $6825. Rounded, that gives a final target of $6800.
💡 Educational Takeaway
Right-Angled Descending Broadening Formations show growing volatility with buyers holding a ceiling steady while sellers run out of steam. Once that flat resistance breaks, momentum usually shifts in favour of the bulls. Since this one lasted over 500 days, the breakout isn’t just noise. It’s a macro signal that could define ETH’s next major trend leg.
Level to Watch Closely:
$4000 → the expected retest (G). Holding here would be a strong confirmation that ETH is ready to aim for ATH and price discovery.
_________________________________
💬 If you found this helpful, drop a like and comment!

ETH ANALYSIS (4H)Ethereum has broken a weekly blind trigger and has now reached a higher-timeframe supply zone, which corresponds to the weekly timeframe.
Given the strength of the supply zone and the strong bullish momentum, there are currently two possible scenarios:
**Scenario 1:** It may have a pullback from this supply to demand before making an attack toward the all-time high.
**Scenario 2:** It may consolidate on the supply and go straight toward the all-time high.
In both scenarios, it is expected that after hunting the all-time high or moving slightly above it, the price will drop sharply toward lower levels.
For risk management, please don't forget stop loss and capital management
When we reach the first target, save some profit and then change the stop to entry
Comment if you have any questions
Thank You

Ethereum Parabolic Season Coded! The major down trend breakout in Ethereum, which also occurred in terms of RSI, will trigger a transition to a major upward phase.
Major trend breakout in CRYPTOCAP:ETH after 1570 days!

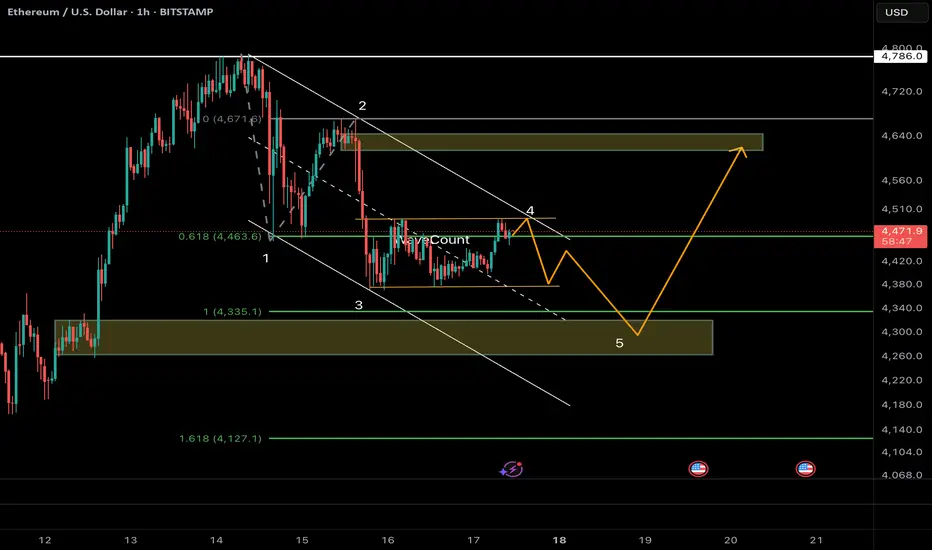
ETH/USDT :Wave 5 Drop to 4300–Rebound Rally to 4600 Before Crashthereum has likely completed a 5-wave impulsive rally from 1380 → 4780, with the channel break confirming a larger correction in progress.
Currently, price is unfolding Wave A of an ABC NeoWave structure, subdividing into 5 smaller waves.
⸻
🔹 Wave Count Breakdown
• Wave 1: Sharp drop to ~4335
• Wave 2: 61.8% rebound to 4463
• Wave 3: Extended selloff (161.8% of W1) → 4335
• Wave 4: Shallow retrace (~38.2% W3) → 4463
• Wave 5 (in progress): Targeting 4300–4270 (1.618 Fib + channel floor)
👉 Monowave count (~45–55) sits perfectly inside NeoWave’s 34–89 range → confirming impulsive character of this Wave A.
⸻
🔹 Next Path Scenarios
1. Wave A completion → Short-term bottom around 4300 (confluence of Fib + channel).
2. Wave B rebound → Relief rally toward 4460–4600 (38.2–50% retrace of A). Likely a sharp ABC bounce that traps late shorts.
3. Wave C decline → Resumption of downtrend toward 3800–4000, with risk of an extended drop to 3500 if momentum accelerates.
⸻
🔹 Technical Clues
• Fib structure: Textbook alternation (W2 deep / W4 shallow).
• RSI divergence at lows → exhaustion signals.
• Dominance context: USDT.D rebounding + BTC.D >60% → capital rotation suggests ETH downside risk remains elevated.
⸻
🔹 Trade Setup (Bias: Short with rebound play)
• Entry (short): Below 4400 on BOS confirmation (break of 4335).
• Targets: TP1 = 4300 (end of A), TP2 = 3800 (post-B wave).
• Rebound long: Consider 4300 → 4600 scalp if Wave A completes.
• Stops: Above 4463 (W4 high) for shorts / below 4300 for longs.
• Risk mgmt: 1–2% position size; trail stops along channel midline.
⸻
⚠️ Volatility remains extreme. Manage risk strictly—crypto psychology flips fast.
ETH Dip Before ATHSimple strategy using bolinger bands and various moving averages. Liquidity zone is around $4100. Expect to dip into that and maybe wick lower before the next leg up and break through ATH.

BTC Hopium! $250k December? Probably wont get to $250k, but a big move to the upside is coming I believe.
Also as you can see all indicators on PMI are pointed up.
Good luck everyone, just an idea and not financial advice.

THIS TIME IS DIFFERENT! KINDAI got a little experimental with the Bitcoin chart after seeing such a strong correlation on cycle one of Litecoin and this cycle. (I did an analysis on this exact this for Litecoin Ill past the chart below). Bitcoin and Litecoin cycles are playing out almost exactly the same as their previous cycles.
As you can see in the chart Bitcoin from the time it came out to when it topped in its first cycle on December Friday the 13th 2013. I took and compared the first wave of cycle one and compared it to the first wave of this current cycle 2 and sound that the time it took this cycle was 5.5 times greater than previous. Measuring that distance to the top of wave three brings bitcoin to July of this year for a wave three top on this much larger degree of trend before a correction. Wave 5 should complete in 2025 around December.
I know I know Bitgolder you're absolutely insane that could never happen. Well you're wrong and chances are it will happen. Do you know how much money in just derivatives there are? As of writing its almost 1 Quadrillion dollars, THATS JUST DERIVATIVES. Thats not including 75% of the rest of the assets in the world. So Bitcoin soaking up 25% of the world per say isn't that unreasonable considering the rich are now finding it as a safe haven for their wealth preservation. Theres always an out for the rich when everything is about to collapse and this time its Bitcoin and maybe gold silver and farmland. After 2025 and around there the world may look totally different. There will be some major financial issues around the world and the entire planet will be in a major global depression. Countries Governments may actually attempt to seize Bitcoin from the population because of how valuable it is. Dollar terms will be irrelevant. Things may even be priced in Bitcoin. Watch Europe. When their bond crisis begins then USA is maybe 6 months a year behind.
With bitcoin reaching the price I predict of around $40 million each in 2025 that would give bitcoin a market cap of 966 Trillon which would be a 1000x from where we are now. I think this scenario is likely if the world decides Bitcoin will be the store of value to weather out the coming depression and potential world war, cause what better time to have a world war than during a depression.
To come up with these price targets, I measured the percentage gain on each wave on Cycle 1 and measured it against the current Cycle two and its about 10x the move percentage wise.
Everyone keeps saying diminishing returns blah blah. No one can predict how Bitcoin will act. This is the first asset in our history that has had a fixed numerical supply. Supply and demand can change in a heartbeat and price can and will go straight up. Its also the most pain that can be inflicted because everyone and their brother is bearish right now calling for big drops, and so many still waiting on the sidelines for the 30k dip thats never going to happen cause they sold at 40 listening to idiotic you tubers that echo each other in their circle jerk.
Not financial advice this is just my opinion.

BTCUSD Theres No Way We Can Hit 1 Million Dollar Bitcoin, Right?I think that Bitcoin is on its way to some serious numbers. Numbers that most think are impossible. So many think that this cycle has to be like previous cycles. Oh its 840 days in the last cycle from bottom to top, or 4 year cycles etc. Its all bogus, this time is different regardless of what you think. Bitcoin is being locked in the ETF now and soon to be reserves of states, countries, city states you name the whole world is going to hoard Bitcoin. There is no more sloshing of capital like you're used to to created an altcoin season. There is no more Bitcoin dominance dropping, like you're used. It is simply different and thats the facts jack. Everyone selling now is going to regret it.
I believe that Bitcoin from 2009 to the end of 2023 was one giant cycle. We are at the beginning of a new cycle for Bitcoin. If you think the last one was fun, just wait till you see this one. Ill paste a picture of what I mean below so you can understand what Im saying.
People calling Michael Saylor stupid, saying hes buying the top, like they are smarter than him, or Blackrock, any other hedge fund, or countries, or US states. Everyone who thinks that is they are smarter than these people are going to have a rude awakening.
1 Million is just the beginning. Over the next 10 years Bitcoin is going to go to numbers that no one can even fathom. Not even the dreamiest of Bulls. I bet Bitcoin could hit 30-50 million dollars over the next 10 years. Why do I say that?
The world, especially the United States is about to go into a massive productivity boom over the next 10 years, cheap energy, increased efficiency in all sectors, AI expansion, new inventions, and massive wealth transfers from the baby boom generation. Trump saying that America is entering a Golden Age is absolutely correct. We are going to witness the most epic bull run in history from now to about 2035. Sure there will be corrections and crashes along the way, but itll just be a higher low and then off to the races again.
The baby boom generation is sitting on 78 TRILLION DOLLARS of wealth currently. As baby boomers retire or pass away, their wealth will likely be passed on to their children and grandchildren. This transfer of wealth will help future generations buy homes, pay off student debt, make other purchases, and invest. This will benefit Bitcoin tremendously because now theres barely anyone under 50 investing in Gold or Silver anymore, that stuff is stone age currecny. We are entering a digital AI age, we're not moving backwards. The gold for the new digital golden age is Bitcoin. So much money and capital will flow into Bitcoin and other crypto assets, stock market etc. That is why the smart are loading up!
Its going to be beautiful, so just have a seat, buckle up its going to be wild. None of this is financial advice this is just my opinion.

This Ethereum SeasonThis Ethereum Season
Ethereum Dominance / Bitcoin Dominance
CRYPTOCAP:ETH.D / CRYPTOCAP:BTC.D
