GBPUSD Long-term Top confirmed. Massive selling ahead.At the beginning of the year (January 10, see chart below), we issued a very strong buy signal on the GBPUSD pair, exactly at the bottom of the 3-year Channel Up, catching the most optimal buy entry and methodically hitting our 1.2950 Target:
This time we a confirmed Top for the same very pattern, which even though it may have widened the Higher Highs and Higher Lows (Megaphone), it did form last week Lower Highs, while also coming off a 1W MACD Bearish Cross, which at such high values, has been the sell signal on both previous Channel Tops.
Given that both Bearish Legs (red Channel Down sequences) reached at least their respective 0.786 Fibonacci levels, we are expecting the pair to hit 1.2450 within Q1 2026.
-------------------------------------------------------------------------------
** Please LIKE 👍, FOLLOW ✅, SHARE 🙌 and COMMENT ✍ if you enjoy this idea! Also share your ideas and charts in the comments section below! This is best way to keep it relevant, support us, keep the content here free and allow the idea to reach as many people as possible. **
-------------------------------------------------------------------------------
💸💸💸💸💸💸
👇 👇 👇 👇 👇 👇
D-GBP

GBP/USD - Multi Timeframe Forecast🕰 Weekly View
Weekly is looking toppy near that 1.38–1.39 rejection zone.
Big weekly BOS already in play → momentum pointing down.
Liquidity targets sit way lower at 1.28–1.29 (weekly demand + swing range).
📉 Daily Structure
Daily broke structure → now printing lower highs.
A daily supply zone sits heavy overhead near 1.36–1.37.
If sellers keep pressing, the magnet is clear: 1.30–1.31 daily demand (stacked with fib + HV buy zone).
Any bounces are likely just snack stops for liquidity 🍟 before rolling lower.
⏱ 4H Breakdown
Price is hunting between two short-term options:
1️⃣ Option 1: Tap into the 4H supply around 1.3450–1.3500, reject hard → continuation down.
2️⃣ Option 2: Push a bit higher into the high-volume sell zone at 1.3550–1.3600 → then dump to new lows.
Below, key demand sits at 1.3200 → 1.3000, so that’s the landing pad 🎯.
🎯 Summary
Bias : Bearish until proven otherwise.
Weekly → Failed top, heading toward deeper demand.
Daily → Lower highs into supply, eyes on 1.30.
4H → Watch for rejection at sell zones before shorting.
Big picture → GBP/USD looks like it’s loading up for a multi-week selloff 📉 unless buyers defend hard at 1.32.

GBPUSD H4 | bearish momentum to extendGBP/USD is rising towards the sell entry which is a pullback resistance and could drop from this levle to the take profit.
Sell entry is at 1.3390, which is a pullback resistance.
Stop loss is at 1.3459, which is a pullback resistance.
Take profit is at 1.3269, which is a pullback resistance that is slightly above the 100% Fibonacci projection.
High Risk Investment Warning
Trading Forex/CFDs on margin carries a high level of risk and may not be suitable for all investors. Leverage can work against you.
Stratos Markets Limited (tradu.com ):
CFDs are complex instruments and come with a high risk of losing money rapidly due to leverage. 65% of retail investor accounts lose money when trading CFDs with this provider. You should consider whether you understand how CFDs work and whether you can afford to take the high risk of losing your money.
Stratos Europe Ltd (tradu.com ):
CFDs are complex instruments and come with a high risk of losing money rapidly due to leverage. 66% of retail investor accounts lose money when trading CFDs with this provider. You should consider whether you understand how CFDs work and whether you can afford to take the high risk of losing your money.
Stratos Global LLC (tradu.com ):
Losses can exceed deposits.
Please be advised that the information presented on TradingView is provided to Tradu (‘Company’, ‘we’) by a third-party provider (‘TFA Global Pte Ltd’). Please be reminded that you are solely responsible for the trading decisions on your account. There is a very high degree of risk involved in trading. Any information and/or content is intended entirely for research, educational and informational purposes only and does not constitute investment or consultation advice or investment strategy. The information is not tailored to the investment needs of any specific person and therefore does not involve a consideration of any of the investment objectives, financial situation or needs of any viewer that may receive it. Kindly also note that past performance is not a reliable indicator of future results. Actual results may differ materially from those anticipated in forward-looking or past performance statements. We assume no liability as to the accuracy or completeness of any of the information and/or content provided herein and the Company cannot be held responsible for any omission, mistake nor for any loss or damage including without limitation to any loss of profit which may arise from reliance on any information supplied by TFA Global Pte Ltd.
The speaker(s) is neither an employee, agent nor representative of Tradu and is therefore acting independently. The opinions given are their own, constitute general market commentary, and do not constitute the opinion or advice of Tradu or any form of personal or investment advice. Tradu neither endorses nor guarantees offerings of third-party speakers, nor is Tradu responsible for the content, veracity or opinions of third-party speakers, presenters or participants.

Continuation of bearish momentum?The Cable (GBP/USD) is rising towards the pivot which is a pullback resistance that aligns with the 61.8% Fibonacci retracement and could reverse to the 1st support.
Pivot: 1.3460
1st Support: 1.3312
1st Resistance: 1.3533
Disclaimer:
The above opinions given constitute general market commentary, and do not constitute the opinion or advice of IC Markets or any form of personal or investment advice.
Any opinions, news, research, analyses, prices, other information, or links to third-party sites contained on this website are provided on an "as-is" basis, are intended only to be informative, is not an advice nor a recommendation, nor research, or a record of our trading prices, or an offer of, or solicitation for a transaction in any financial instrument and thus should not be treated as such. The information provided does not involve any specific investment objectives, financial situation and needs of any specific person who may receive it. Please be aware, that past performance is not a reliable indicator of future performance and/or results. Past Performance or Forward-looking scenarios based upon the reasonable beliefs of the third-party provider are not a guarantee of future performance. Actual results may differ materially from those anticipated in forward-looking or past performance statements. IC Markets makes no representation or warranty and assumes no liability as to the accuracy or completeness of the information provided, nor any loss arising from any investment based on a recommendation, forecast or any information supplied by any third-party.

Potential bearish drop off?GBP/USD is rising towards the support level, which is an overlap resistance, and could drop from this level to our take profit.
Entry: 1.3365
Why we like it:
There is an overlap resistance level.
Stop loss: 1.3459
Why we like it:
There is an overlap resistance level.
Take profit: 1.3160
Why we like it:
There is a swing low support that aligns with the 145% Fibonacci extension.
Enjoying your TradingView experience? Review us!
Please be advised that the information presented on TradingView is provided to Vantage (‘Vantage Global Limited’, ‘we’) by a third-party provider (‘Everest Fortune Group’). Please be reminded that you are solely responsible for the trading decisions on your account. There is a very high degree of risk involved in trading. Any information and/or content is intended entirely for research, educational and informational purposes only and does not constitute investment or consultation advice or investment strategy. The information is not tailored to the investment needs of any specific person and therefore does not involve a consideration of any of the investment objectives, financial situation or needs of any viewer that may receive it. Kindly also note that past performance is not a reliable indicator of future results. Actual results may differ materially from those anticipated in forward-looking or past performance statements. We assume no liability as to the accuracy or completeness of any of the information and/or content provided herein and the Company cannot be held responsible for any omission, mistake nor for any loss or damage including without limitation to any loss of profit which may arise from reliance on any information supplied by Everest Fortune Group.

GBPUSD: CABLE COILED FOR 1.36 EXPLOSION! Sterling Rally 🚀 GBPUSD: CABLE COILED FOR 1.36 EXPLOSION! Sterling Rally 📊
Current Price: 1.34036 | Date: Sept 27, 2025 ⏰
📈 INTRADAY TRADING SETUPS (Next 5 Days)
🎯 BULLISH SCENARIO
Entry Zone: 1.3380 - 1.3420 📍
Stop Loss: 1.3340 🛑
Target 1: 1.3480 🎯
Target 2: 1.3550 🚀
🎯 BEARISH SCENARIO
Entry Zone: 1.3440 - 1.3480 📍
Stop Loss: 1.3520 🛑
Target 1: 1.3350 🎯
Target 2: 1.3280 📉
🔍 TECHNICAL ANALYSIS BREAKDOWN
📊 KEY INDICATORS STATUS:
RSI (14): 65.3 ⚡ Sterling Strength Zone
Bollinger Bands: Squeezing for Move 🔥
VWAP: 1.3395 - Critical Pivot 💪
EMA 50: 1.3360 ✅ Bullish Crossover
Volume: Accumulation Pattern 📊
🌊 WAVE ANALYSIS:
Elliott Wave: Wave 3 Building Steam 🌊
Fibonacci Extension: 1.3650 Target 🎯
🔄 HARMONIC PATTERNS:
Bullish Butterfly at 1.3350 ✨
ABCD Completion to 1.3520 🔄
⚖️ SWING TRADING OUTLOOK (1-4 Weeks)
🚀 BULLISH TARGETS:
Psychological: 1.3600 🏆
Weekly Target: 1.3650 🌙
Gann Square: 1.3700 ⭐
📉 BEARISH INVALIDATION:
Weekly Support: 1.3250 ⚠️
Critical Level: 1.3150 🚨
🎭 MARKET STRUCTURE:
Trend: Bullish Flag Formation 💪
Momentum: Coiling Energy 🔥
Wyckoff Phase: Spring Complete 📈
Ichimoku: Cloud Breakout Pending 🟢
⚡ CABLE VOLATILITY SETUP:
Compression Zone: 1.3350-1.3450 🎢
Breakout Catalyst: BoE Data 💥
Volatility Spike: Expected Above 1.3480 📈
🏛️ UK FUNDAMENTALS:
BoE Policy Hawkish Stance 🏦
GDP Growth Resilient Data 📊
Inflation Supporting GBP 📈
Political Stability Improving 🇬🇧
⚡ RISK MANAGEMENT:
Max Risk per Trade: 60 pips 🛡️
R:R Ratio: Minimum 1:2.5 ⚖️
London Open: High Impact 📏
🔥 CRITICAL BREAKOUT LEVELS:
Bull Trigger: 1.3480 clean break 💥
Support Zone: 1.3380 | 1.3340 | 1.3300 🛡️
Resistance: 1.3480 | 1.3550 | 1.3600 🚧
📈 STERLING STRENGTH:
vs USD: Momentum Building 💪
vs EUR: Outperforming 🔥
Cross Pairs: Bullish Flow 🌊
🎯 FINAL VERDICT:
CABLE ready for EXPLOSIVE 1.36 MOVE! 🚀
Sterling coiled like a spring! 💎
Perfect storm brewing for breakout! ⛈️
Trade Management: Buy dips to 1.3380 💰
Key Level: 1.3480 breakout crucial! 🔑
---
⚠️ Disclaimer: FX trading carries substantial risk. Manage positions carefully. Educational content only.
For individuals seeking to enhance their trading abilities based on the analyses provided, I recommend exploring the mentoring program offered by Shunya Trade. (Website: shunya dot trade)
I would appreciate your feedback on this analysis, as it will serve as a valuable resource for future endeavors.
Sincerely,
Shunya.Trade
Website: shunya dot trade
🔔 Follow Cable Updates | 💬 Share Your Sterling Strategy Below

GBP/JPY - BOJ Holds Rates, Inflation Outlook RisesOANDA:GBPJPY #GBPJPY #Forex #Trading #FXAnalysis #TechnicalAnalysis #PriceAction #BankOfJapan #ForexTrader
The Bank of Japan decided to keep interest rates unchanged while raising its inflation forecast. This shows caution but also optimism that cooperation with the U.S. could support Japan’s economic stability.
On the chart, demand zones (red) are acting as key support, with potential bullish targets around 200.500 – 201.100 (green key zones). If buyers defend these support levels, we could see momentum pushing GBP/JPY toward the upside targets.
Traders should watch price reaction at support for potential long entries.
👍 Support with a like & drop your thoughts in the comments!
⚠️ Disclaimer: This analysis is for educational purposes only and should not be considered financial advice. Always do your own research before making trading decisions.

GBP/JPY - NO CONFIRMATION! (Possible failed resistance break)🔥 GBP/JPY – 4H Forecast 💷💴
This pair is dancing inside some serious supply, and sellers are warming up. Let’s break it down 👇
🕰 Market Context
Price tagged into a weekly supply zone and instantly reacted. Sellers defended heavy.
Liquidity sweep above the highs (BSL) → classic stop grab before turning south. ⚡
Daily zone + 8H imbalance already filled, giving sellers control.
📉 Bearish Flow
Market structure flipped bearish with a lower high (LPL) being printed.
1H zone is aligning with 4H supply = confluence for shorts.
Buyer attempts are fading; sell-side pressure is loading for a move into deeper demand.
⚡ Key Zones
Resistance / Supply:
200.40–200.80 (daily/4H supply pocket)
201.20 extreme high liquidity sweep
Support / Demand:
199.00 (short-term intraday demand)
197.80–198.20 = main target demand zone 🎯
🎯 Forecast Path
Expect a possible tiny push back into 200.0–200.4 zone for liquidity grab 📈.
From there → sellers should kick in → drive down toward 198.0 demand. 🕳
Break below 197.8 opens door to 195.5–196.0 macro support.
📝 Trade Idea
Bias: Bearish (supply reaction + liquidity grab confirmed).
Plan : Short from 200.0–200.4 retest.
Targets : 199.0 → 198.0 → extended 196.0.
Invalidation : Clean 4H close above 201.2 kills the short bias.
📌 Summary : GBP/JPY just faked out above highs into weekly supply and is now setting up for a deeper sell-off. Smart money is eyeing the 198.0 demand zone — shorts are the play until 201.2 breaks.

GBP/USD - Sell side Liquidity Available (4H forecast) 🔥 GBP/USD – 4H Forecast 💷💵
Cable’s chart is serving us some spicy structure — let’s break it down 👇
🕰 Market Context
Price rejected hard from that RSL (Resistance Supply Level) at the top of the range.
We’ve since seen a BOS (Break of Structure) to the downside — bears flexing their muscles. 💪🐻
Market reacted cleanly from a daily demand zone earlier, but momentum is stalling.
📉 Bearish Flow
Clear shift in market structure (SHoF) confirmed.
We’re chilling inside a 4H supply zone, which already pushed price down once.
Internal range showing liquidity being swept → fuel for a possible continuation lower.
⚡ Key Levels
Support zones:
1.3400–1.3410 (extreme range support)
1.3350–1.3370 (internal range demand)
Resistance :
1.3500–1.3520 → sell-side zone of interest.
🎯 Forecast Path
Expect a reaction bounce into the 4H supply (1.3490–1.3520) 📈.
If supply holds, watch for continuation down toward 1.3350–1.3370 🕳.
Breaking below that → opens the door to 1.3150 strong support (next liquidity magnet).
📝 Trade Idea
Bias : Bearish until market proves otherwise.
Plan : Look for shorts on pullbacks into 1.3490–1.3520 zone.
Targets : 1.3400 → 1.3350 range.
Invalidation : Break & close above 1.3550 kills the bearish play.
📌 Summary : GBP/USD is in bearish flow after the RSL rejection & BOS. Supply zones are respected, liquidity is building below — shorts into demand are the play until 1.3550 breaks

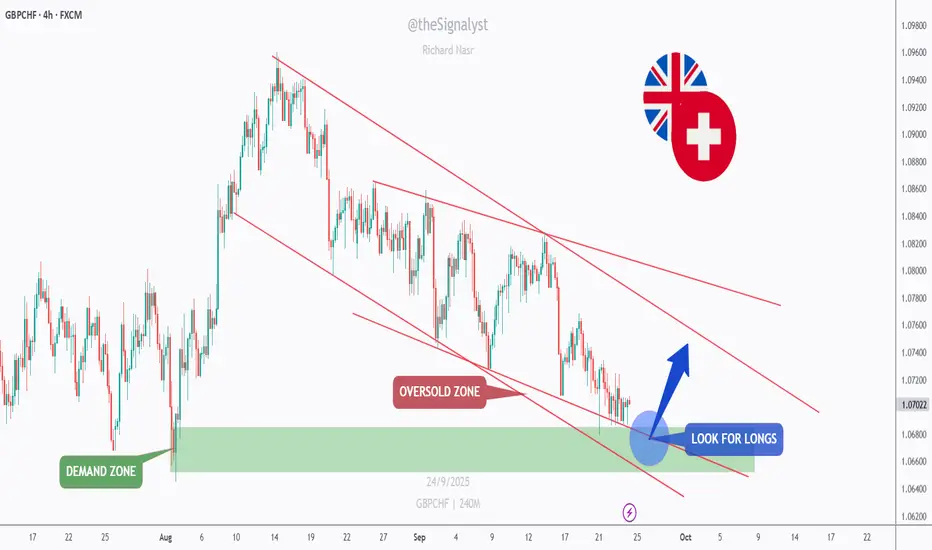
GBPCHF - Oversold at Demand: Longs on Confirmation?GBPCHF has been drifting lower on the 4H inside a falling channel. Price is now tapping a multi-touch demand zone around 1.066–1.070, right at the channel’s lower bound—classic confluence for a bounce.
As long as this base holds, I’ll look for reversal confirmation (wick rejections/HH-HL) to ride a rotation toward 1.075 first, then 1.082–1.085 near the channel midline 📈. A clean 4H close below 1.064 would invalidate the idea and expose 1.060–1.058 next.
What’s your move => buy the dip at demand, or wait for a break of the red channel before joining? 🤔
⚠️ Disclaimer: This is not financial advice. Always do your own research and manage risk properly.
📚 Stick to your trading plan regarding entries, risk, and management.
Good luck! 🍀
All Strategies Are Good; If Managed Properly!
~Richard Nasr
gbpjpy looking bearish Recently Breaks Descending Trendline, Now After Retesting Breaking Another Trendline, In The Event Of Breakout It Can Give 100+ Pips Bearish Move, Wait For Breakout

Bearish reversal off 50% Fibonacci resistance?GBP/JPY is rising towards the pivot which aligns with the 50% Fibonacci retracement, and could reverse to the 1st support which is a pullback support.
Pivot: 200.21
1st Support: 199
1st Resistance: 201.14
Disclaimer:
The above opinions given constitute general market commentary, and do not constitute the opinion or advice of IC Markets or any form of personal or investment advice.
Any opinions, news, research, analyses, prices, other information, or links to third-party sites contained on this website are provided on an "as-is" basis, are intended only to be informative, is not an advice nor a recommendation, nor research, or a record of our trading prices, or an offer of, or solicitation for a transaction in any financial instrument and thus should not be treated as such. The information provided does not involve any specific investment objectives, financial situation and needs of any specific person who may receive it. Please be aware, that past performance is not a reliable indicator of future performance and/or results. Past Performance or Forward-looking scenarios based upon the reasonable beliefs of the third-party provider are not a guarantee of future performance. Actual results may differ materially from those anticipated in forward-looking or past performance statements. IC Markets makes no representation or warranty and assumes no liability as to the accuracy or completeness of the information provided, nor any loss arising from any investment based on a recommendation, forecast or any information supplied by any third-party.

Bullish bounce?EUR/GBP is falling towards the pivot and could bounce to the 1st resistance.
Pivot: 0.8713
1st Support: 0.8680
1st Resistance: 0.8763
Disclaimer:
The above opinions given constitute general market commentary, and do not constitute the opinion or advice of IC Markets or any form of personal or investment advice.
Any opinions, news, research, analyses, prices, other information, or links to third-party sites contained on this website are provided on an "as-is" basis, are intended only to be informative, is not an advice nor a recommendation, nor research, or a record of our trading prices, or an offer of, or solicitation for a transaction in any financial instrument and thus should not be treated as such. The information provided does not involve any specific investment objectives, financial situation and needs of any specific person who may receive it. Please be aware, that past performance is not a reliable indicator of future performance and/or results. Past Performance or Forward-looking scenarios based upon the reasonable beliefs of the third-party provider are not a guarantee of future performance. Actual results may differ materially from those anticipated in forward-looking or past performance statements. IC Markets makes no representation or warranty and assumes no liability as to the accuracy or completeness of the information provided, nor any loss arising from any investment based on a recommendation, forecast or any information supplied by any third-party.

Potential bullish rise?GBP/CAD has bounced off the support level which is a pullback support that aligns with the 50% Fibonacci retracement and could rise from this level to our take profit.
Entry: 1.8640
Why we like it:
There is a pullback support that aligns with the 50% Fibonacci retracement.
Stop loss: 1.8554
Why we like it:
There is a pullback support level.
Take profit: 1.8821
Why we like it:
There is a multi-swing high resistance.
Enjoying your TradingView experience? Review us!
Please be advised that the information presented on TradingView is provided to Vantage (‘Vantage Global Limited’, ‘we’) by a third-party provider (‘Everest Fortune Group’). Please be reminded that you are solely responsible for the trading decisions on your account. There is a very high degree of risk involved in trading. Any information and/or content is intended entirely for research, educational and informational purposes only and does not constitute investment or consultation advice or investment strategy. The information is not tailored to the investment needs of any specific person and therefore does not involve a consideration of any of the investment objectives, financial situation or needs of any viewer that may receive it. Kindly also note that past performance is not a reliable indicator of future results. Actual results may differ materially from those anticipated in forward-looking or past performance statements. We assume no liability as to the accuracy or completeness of any of the information and/or content provided herein and the Company cannot be held responsible for any omission, mistake nor for any loss or damage including without limitation to any loss of profit which may arise from reliance on any information supplied by Everest Fortune Group.

Bearish reversal off multi swing high resistance?EUR/GBP is reacting off the resistance level which is a multi-swing high resistance that aligns with the 127.2% Fibonacci extension and could drop from this level to our take profit.
Entry: 0.8737
Why we like it:
There is a multi-swing high resistance that lines up with the 127.2% Fibonacci extension.
Stop loss: 0.8762
Why we like it:
There is a resistance level at the 161.8% Fibonacci extension.
Take profit: 0.8681
Why we like it:
There is a pullback support that is slightly below the 50% Fibonacci retracement.
Enjoying your TradingView experience? Review us!
Please be advised that the information presented on TradingView is provided to Vantage (‘Vantage Global Limited’, ‘we’) by a third-party provider (‘Everest Fortune Group’). Please be reminded that you are solely responsible for the trading decisions on your account. There is a very high degree of risk involved in trading. Any information and/or content is intended entirely for research, educational and informational purposes only and does not constitute investment or consultation advice or investment strategy. The information is not tailored to the investment needs of any specific person and therefore does not involve a consideration of any of the investment objectives, financial situation or needs of any viewer that may receive it. Kindly also note that past performance is not a reliable indicator of future results. Actual results may differ materially from those anticipated in forward-looking or past performance statements. We assume no liability as to the accuracy or completeness of any of the information and/or content provided herein and the Company cannot be held responsible for any omission, mistake nor for any loss or damage including without limitation to any loss of profit which may arise from reliance on any information supplied by Everest Fortune Group.

GBPJPY H4 | Bearish reversal setupGBP/JPY is rising towards the sell entry which is a pullback resistance that is slightly below the 50% Fibonacci retracement and could reverse from this level to the take profit.
Sell entry is at 200.05, which is a pullback resistance that is slightly below the 50% Fibonacci retracement.
Stop loss is at 201.22, which is a swing high resistance.
Take profit is at 198.58, which is a pullback support that aligns with the 145% Fibonacci extension.
High Risk Investment Warning
Trading Forex/CFDs on margin carries a high level of risk and may not be suitable for all investors. Leverage can work against you.
Stratos Markets Limited (tradu.com ):
CFDs are complex instruments and come with a high risk of losing money rapidly due to leverage. 65% of retail investor accounts lose money when trading CFDs with this provider. You should consider whether you understand how CFDs work and whether you can afford to take the high risk of losing your money.
Stratos Europe Ltd (tradu.com ):
CFDs are complex instruments and come with a high risk of losing money rapidly due to leverage. 66% of retail investor accounts lose money when trading CFDs with this provider. You should consider whether you understand how CFDs work and whether you can afford to take the high risk of losing your money.
Stratos Global LLC (tradu.com ):
Losses can exceed deposits.
Please be advised that the information presented on TradingView is provided to Tradu (‘Company’, ‘we’) by a third-party provider (‘TFA Global Pte Ltd’). Please be reminded that you are solely responsible for the trading decisions on your account. There is a very high degree of risk involved in trading. Any information and/or content is intended entirely for research, educational and informational purposes only and does not constitute investment or consultation advice or investment strategy. The information is not tailored to the investment needs of any specific person and therefore does not involve a consideration of any of the investment objectives, financial situation or needs of any viewer that may receive it. Kindly also note that past performance is not a reliable indicator of future results. Actual results may differ materially from those anticipated in forward-looking or past performance statements. We assume no liability as to the accuracy or completeness of any of the information and/or content provided herein and the Company cannot be held responsible for any omission, mistake nor for any loss or damage including without limitation to any loss of profit which may arise from reliance on any information supplied by TFA Global Pte Ltd.
The speaker(s) is neither an employee, agent nor representative of Tradu and is therefore acting independently. The opinions given are their own, constitute general market commentary, and do not constitute the opinion or advice of Tradu or any form of personal or investment advice. Tradu neither endorses nor guarantees offerings of third-party speakers, nor is Tradu responsible for the content, veracity or opinions of third-party speakers, presenters or participants.

GBPUSD H4 | Bearish reversal for the CableBased on the H4 chart analysis, we can see that the price is reacting off the sell entry which is a pullback resistance and could drop from this level to the downside.
Sell entry is at 1.3531, which is a pullback resistance.
Stop loss is at 1.3581, which is a pullback resistance that aligns with the 50% Fibonacci retracement.
Take profit is at 1.3417, which is a pullback support that aligns with the 78.6% Fibonacci retracement.
High Risk Investment Warning
Trading Forex/CFDs on margin carries a high level of risk and may not be suitable for all investors. Leverage can work against you.
Stratos Markets Limited (tradu.com ):
CFDs are complex instruments and come with a high risk of losing money rapidly due to leverage. 65% of retail investor accounts lose money when trading CFDs with this provider. You should consider whether you understand how CFDs work and whether you can afford to take the high risk of losing your money.
Stratos Europe Ltd (tradu.com ):
CFDs are complex instruments and come with a high risk of losing money rapidly due to leverage. 66% of retail investor accounts lose money when trading CFDs with this provider. You should consider whether you understand how CFDs work and whether you can afford to take the high risk of losing your money.
Stratos Global LLC (tradu.com ):
Losses can exceed deposits.
Please be advised that the information presented on TradingView is provided to Tradu (‘Company’, ‘we’) by a third-party provider (‘TFA Global Pte Ltd’). Please be reminded that you are solely responsible for the trading decisions on your account. There is a very high degree of risk involved in trading. Any information and/or content is intended entirely for research, educational and informational purposes only and does not constitute investment or consultation advice or investment strategy. The information is not tailored to the investment needs of any specific person and therefore does not involve a consideration of any of the investment objectives, financial situation or needs of any viewer that may receive it. Kindly also note that past performance is not a reliable indicator of future results. Actual results may differ materially from those anticipated in forward-looking or past performance statements. We assume no liability as to the accuracy or completeness of any of the information and/or content provided herein and the Company cannot be held responsible for any omission, mistake nor for any loss or damage including without limitation to any loss of profit which may arise from reliance on any information supplied by TFA Global Pte Ltd.
The speaker(s) is neither an employee, agent nor representative of Tradu and is therefore acting independently. The opinions given are their own, constitute general market commentary, and do not constitute the opinion or advice of Tradu or any form of personal or investment advice. Tradu neither endorses nor guarantees offerings of third-party speakers, nor is Tradu responsible for the content, veracity or opinions of third-party speakers, presenters or participants.

Continuation of bearish momentum?GBP/CHF has rejected off the pivot and could drop to the 1st support.
Pivot: 1.0731
1st Support: 1.0651
1st Resistance: 1.0788
Disclaimer:
The above opinions given constitute general market commentary, and do not constitute the opinion or advice of IC Markets or any form of personal or investment advice.
Any opinions, news, research, analyses, prices, other information, or links to third-party sites contained on this website are provided on an "as-is" basis, are intended only to be informative, is not an advice nor a recommendation, nor research, or a record of our trading prices, or an offer of, or solicitation for a transaction in any financial instrument and thus should not be treated as such. The information provided does not involve any specific investment objectives, financial situation and needs of any specific person who may receive it. Please be aware, that past performance is not a reliable indicator of future performance and/or results. Past Performance or Forward-looking scenarios based upon the reasonable beliefs of the third-party provider are not a guarantee of future performance. Actual results may differ materially from those anticipated in forward-looking or past performance statements. IC Markets makes no representation or warranty and assumes no liability as to the accuracy or completeness of the information provided, nor any loss arising from any investment based on a recommendation, forecast or any information supplied by any third-party.

Bearish reversal setup?GBPUSD is rising towards the resistance level which his a pullback resistance that aligns with the 50% Fibonacci retracement and could reverse from this level to our take profit.
Entry: 1.3584
Why we like it:
There is a pullback resistance that aligns with the 50% Fibonacci retracement.
Stop loss: 1.3666
Why we like it:
There is a pullback resistance level that lines up with the 78.6% Fibonacci retracement.
Take profit: 1.3394
Why we like it:
There is a pullback support level.
Enjoying your TradingView experience? Review us!
Please be advised that the information presented on TradingView is provided to Vantage (‘Vantage Global Limited’, ‘we’) by a third-party provider (‘Everest Fortune Group’). Please be reminded that you are solely responsible for the trading decisions on your account. There is a very high degree of risk involved in trading. Any information and/or content is intended entirely for research, educational and informational purposes only and does not constitute investment or consultation advice or investment strategy. The information is not tailored to the investment needs of any specific person and therefore does not involve a consideration of any of the investment objectives, financial situation or needs of any viewer that may receive it. Kindly also note that past performance is not a reliable indicator of future results. Actual results may differ materially from those anticipated in forward-looking or past performance statements. We assume no liability as to the accuracy or completeness of any of the information and/or content provided herein and the Company cannot be held responsible for any omission, mistake nor for any loss or damage including without limitation to any loss of profit which may arise from reliance on any information supplied by Everest Fortune Group.

#027: LONG GBP/USD Investment Opportunity
I have chosen to go LONG on this pair. The recent bearish movement has unloaded much of the excess, and the price is now showing clear signs of accumulation in key areas. Hello, I'm Forex Trader Andrea Russo, an independent trader and prop trader with $200,000 in capital under management. Thank you in advance for your time.
Price action has respected important structural levels, with a clear reaction after testing dynamic support.
Volumes indicate an absorption phase, typical of institutional preparatory moves.
Relative strength is starting to turn in our favor, while retail data shows the majority leaning in the opposite direction: exactly the situation I'm looking for to position myself against the retail market.
The cyclical trend suggests the end of the corrective leg and the start of a new directional momentum.
The plan therefore remains bullish: I follow the institutional flow, with the idea that the next expansionary movement could develop in continuity with the dominant structure.

EURUSD POSSIBLE SELL SETUP💡 EURUSD 2H Outlook – Bearish Setup in Play
After a strong bounce from demand, price is now retesting the supply zone around 1.1820 – 1.1840. Structure shows a possible distribution phase forming here, with sellers waiting to step back in.
🔽 Bearish Scenario
If rejection confirms, price could drop toward the demand zone at 1.1720 – 1.1740.
A clean break below 1.1720 would open deeper downside continuation.
🔼 Bullish Scenario
Buyers would need a strong breakout above 1.1840 supply to invalidate this bearish outlook and push toward higher levels.
⚔️ Key Levels to Watch
Resistance: 1.1820 | 1.1840
Support: 1.1760 | 1.1720
📊 Current structure favors short setups from supply, with confirmation entries being the safest.
✅ If this analysis adds value, don’t forget to boost & follow for more updates across Forex, Crypto, and Indices.
💼 If you need account management (personal or funded), I provide professional trading strategies designed for consistency and growth.

GBP/JPY, AUD/JPY Price Action SetupsThe rally on GBP/JPY has stalled around a major resistance level, which could give bears the upper hand over the near term. While AUD/JPY looks like it could go on to push higher, it also looks like it is in need of at least a minor pullback.
Matt Simpson, Market Analyst at City Index and Forex.com

Bullish bounce off?The Cable (GBP/USD) has bounced off the pivot which is a pullback support and could rise to the 1st resistance which is also a pullback resistance.
Pivot: 1.3462
1st Support: 1.3391
1st Resistance: 1.3589
Disclaimer:
The above opinions given constitute general market commentary, and do not constitute the opinion or advice of IC Markets or any form of personal or investment advice.
Any opinions, news, research, analyses, prices, other information, or links to third-party sites contained on this website are provided on an "as-is" basis, are intended only to be informative, is not an advice nor a recommendation, nor research, or a record of our trading prices, or an offer of, or solicitation for a transaction in any financial instrument and thus should not be treated as such. The information provided does not involve any specific investment objectives, financial situation and needs of any specific person who may receive it. Please be aware, that past performance is not a reliable indicator of future performance and/or results. Past Performance or Forward-looking scenarios based upon the reasonable beliefs of the third-party provider are not a guarantee of future performance. Actual results may differ materially from those anticipated in forward-looking or past performance statements. IC Markets makes no representation or warranty and assumes no liability as to the accuracy or completeness of the information provided, nor any loss arising from any investment based on a recommendation, forecast or any information supplied by any third-party.
