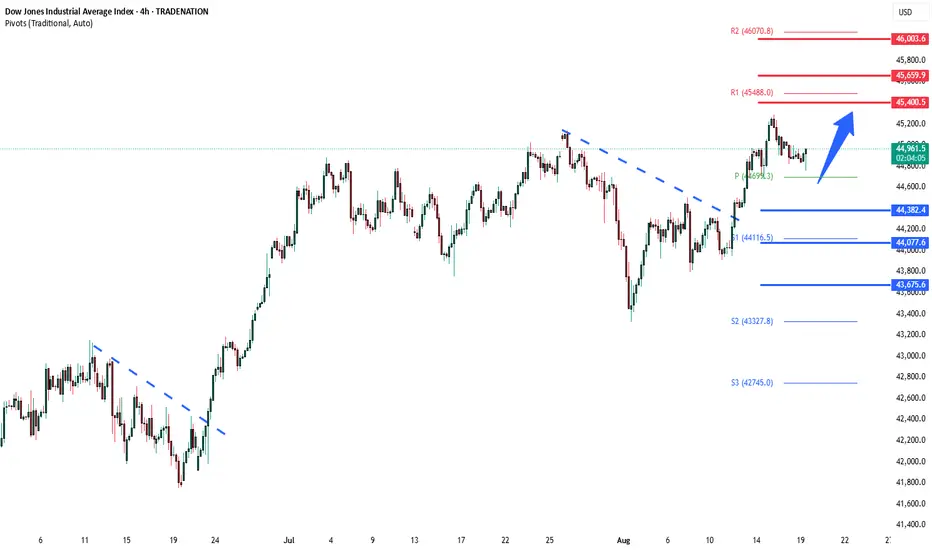
DowJones corrective pullback support at 44380Key Support and Resistance Levels
Resistance Level 1: 45400
Resistance Level 2: 45660
Resistance Level 3: 46000
Support Level 1: 44380
Support Level 2: 44080
Support Level 3: 43675
This communication is for informational purposes only and should not be viewed as any form of recommendation as to a particular course of action or as investment advice. It is not intended as an offer or solicitation for the purchase or sale of any financial instrument or as an official confirmation of any transaction. Opinions, estimates and assumptions expressed herein are made as of the date of this communication and are subject to change without notice. This communication has been prepared based upon information, including market prices, data and other information, believed to be reliable; however, Trade Nation does not warrant its completeness or accuracy. All market prices and market data contained in or attached to this communication are indicative and subject to change without notice.
D-US30

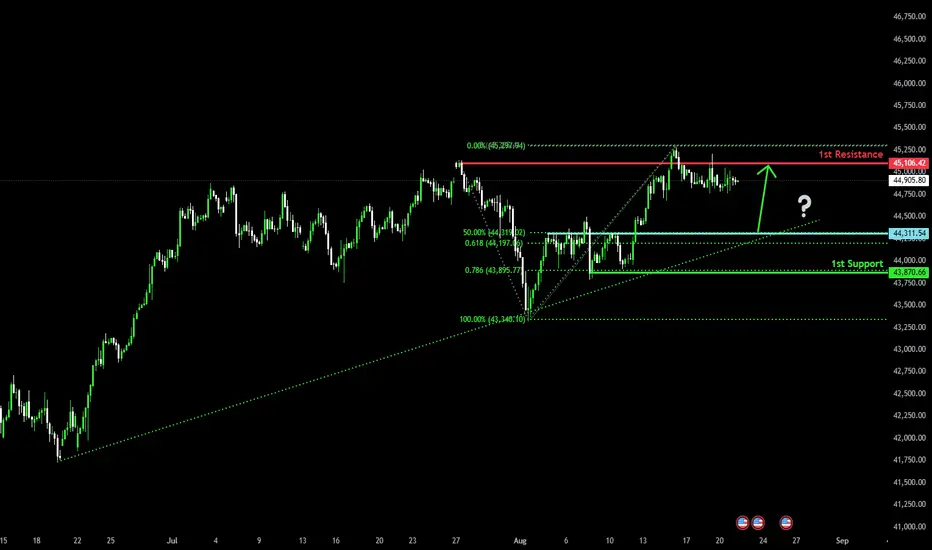
Could we see a bounce from here?Dow Jones (US30) is falling towards the pivot, which acts as a pullback support and could bounce to the 1st resistance, which is a multi-swing high resistance.
Pivot: 44,311.54
1st Support: 43,870.66
1st Resistance: 45,106.42
Risk Warning:
Trading Forex and CFDs carries a high level of risk to your capital and you should only trade with money you can afford to lose. Trading Forex and CFDs may not be suitable for all investors, so please ensure that you fully understand the risks involved and seek independent advice if necessary.
Disclaimer:
The above opinions given constitute general market commentary, and do not constitute the opinion or advice of IC Markets or any form of personal or investment advice.
Any opinions, news, research, analyses, prices, other information, or links to third-party sites contained on this website are provided on an "as-is" basis, are intended only to be informative, is not an advice nor a recommendation, nor research, or a record of our trading prices, or an offer of, or solicitation for a transaction in any financial instrument and thus should not be treated as such. The information provided does not involve any specific investment objectives, financial situation and needs of any specific person who may receive it. Please be aware, that past performance is not a reliable indicator of future performance and/or results. Past Performance or Forward-looking scenarios based upon the reasonable beliefs of the third-party provider are not a guarantee of future performance. Actual results may differ materially from those anticipated in forward-looking or past performance statements. IC Markets makes no representation or warranty and assumes no liability as to the accuracy or completeness of the information provided, nor any loss arising from any investment based on a recommendation, forecast or any information supplied by any third-party.
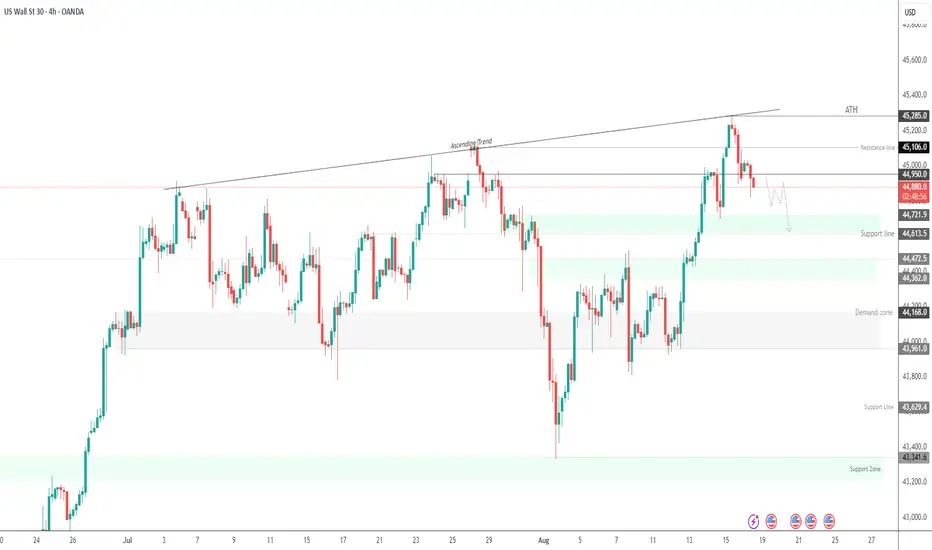
DOW JONES Double MA50 Support Zone coming to the rescue?Dow Jones (DJI) has been trading within a 4-month Channel Up and following the recent High, the price started to pull-back ahead of this week's major macroeconomic events.
By doing so, it has approached the 4H MA50 (blue trend-line), which has been the first line of Support inside this pattern. The previous (Higher) Low of the Channel Up was priced on the 1D MA50 (red trend-line) and the 2 form the strongest medium-term Support Zone at the moment.
With even the 4H RSI fractals identical, the current price action resembles the June 12 one, post 1D MA50 Low (May 23). Even if the 4H MA50 breaks, the trend will remain bullish unless it closes a 1D candle below the 1D MA50 (which would also be an invalidation of the Channel Up).
The most common rise on a Bullish Leg on this pattern has been +9.00%. As a result, our Target is 47200 as we enter September.
-------------------------------------------------------------------------------
** Please LIKE 👍, FOLLOW ✅, SHARE 🙌 and COMMENT ✍ if you enjoy this idea! Also share your ideas and charts in the comments section below! This is best way to keep it relevant, support us, keep the content here free and allow the idea to reach as many people as possible. **
-------------------------------------------------------------------------------
Disclosure: I am part of Trade Nation's Influencer program and receive a monthly fee for using their TradingView charts in my analysis.
💸💸💸💸💸💸
👇 👇 👇 👇 👇 👇

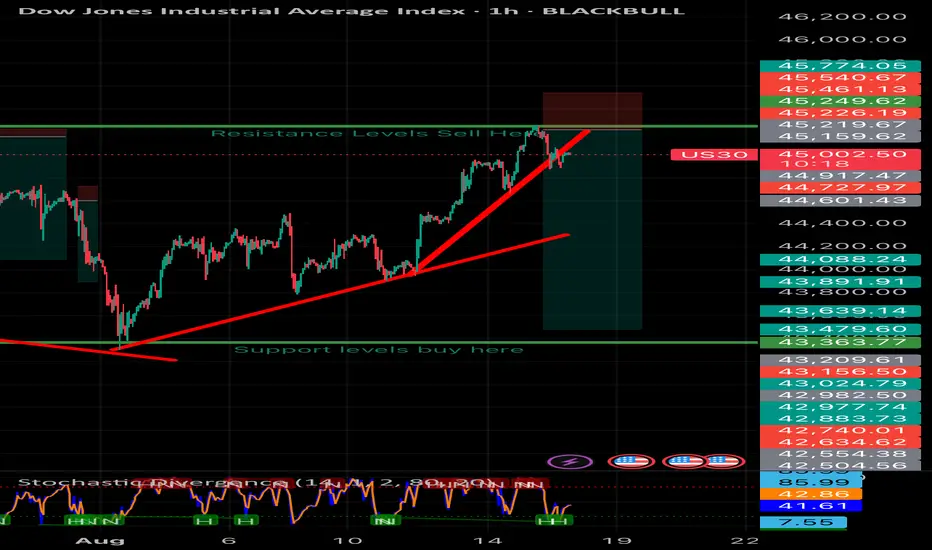
US30 Outlook: Waiting for Range Break Confirmation Dow JonesI’m looking at the US30 📊 right now, and price is currently range-bound 🔄, reflecting ongoing pressure in the market. While I’m watching closely for an opportunity, it’s important to recognize when to step aside and wait for the market to set up 🕰️. If we see a break below the current range low followed by a retest ⬇️, that could present a selling opportunity. Conversely, if price breaks higher and retests the previous high ⬆️, that could offer a buy setup. For now, I’m remaining on the sidelines 🪑 until one of these scenarios unfolds with the momentum I’m looking for 🚀. (Not financial advice.)

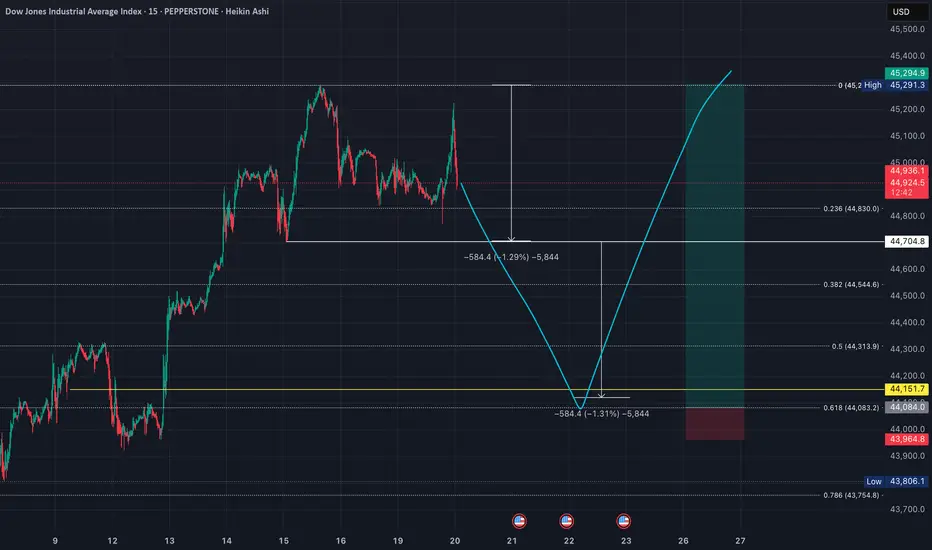
US30 (DOW): Equal Leg Projection Meets Fibonacci - Long SetupSharing my outlook on the Dow, which aligns with my NASDAQ analysis but with a specific mathematical approach. 📊
**🎯 The Setup:**
I'm targeting a long position based on an equal leg projection. Taking the range from the recent low to the all-time high, I expect a decline equal to that same distance. This projection perfectly coincides with the 0.618 Fibonacci level - a powerful confluence. 🎯
**📍 Entry Strategy:**
The beauty of this setup is the mathematical precision: the equal leg down from the high lands exactly at the 0.618 Fib level. This confluence gives me high confidence in this support zone for a potential long entry. ✅
**⚠️ Risk Management:**
Stop loss would be placed below the projected low, targeting new all-time highs. Clean entry, clear invalidation level. 🛑
**🧠 Why This Works:**
Equal leg projections are powerful tools in market analysis. When combined with key Fibonacci levels, they create high-probability reversal zones. The market often respects these mathematical relationships. 📐
**🔄 Bigger Picture Alignment:**
This setup aligns with my broader market view - expecting one final push higher before any significant correction. The Dow's equal leg projection gives us a precise entry point for this bullish thesis. 📈
**💡 Key Insight:**
When geometric projections align with Fibonacci levels, it creates what I call "mathematical harmony" in the markets. These setups often provide the best risk-adjusted opportunities. 🎵
📈 **This trade setup offers a risk-to-reward ratio of 10:1.** Without including fees, the breakeven win rate for this trade would be approximately 9.09%. Knowing these figures in advance helps me avoid emotional trading. 🧠
💡 **Pro Tip**: If you often find yourself trading based on emotions, I recommend doing this type of pre-planning and quantifying your setups before execution — it can be a simple yet highly effective improvement. ✅
---
**Trading is simple.** You don't need multiple indicators or dozens of lines on your chart. A clean and simple chart often works best — it keeps your decisions consistent and reduces uncertainty. Sure, it might not look flashy, and my analysis may seem a bit "plain" compared to others… but that's how I like it. If you find this analysis useful, feel free to follow me for more updates.
---
*Disclaimer: This post is for general informational and educational purposes only. It does not constitute financial advice, investment recommendation, or a service targeting specific investors, and should not be considered illegal or restricted information in any jurisdiction.*
DowJones range trading below ATHKey Support and Resistance Levels
Resistance Level 1: 45400
Resistance Level 2: 45660
Resistance Level 3: 46000
Support Level 1: 44380
Support Level 2: 44080
Support Level 3: 43675
This communication is for informational purposes only and should not be viewed as any form of recommendation as to a particular course of action or as investment advice. It is not intended as an offer or solicitation for the purchase or sale of any financial instrument or as an official confirmation of any transaction. Opinions, estimates and assumptions expressed herein are made as of the date of this communication and are subject to change without notice. This communication has been prepared based upon information, including market prices, data and other information, believed to be reliable; however, Trade Nation does not warrant its completeness or accuracy. All market prices and market data contained in or attached to this communication are indicative and subject to change without notice.
ARIASWAVE MARKET UPDATE - NASDAQ 400K - DOW 200K...In this major market update, I’m sharing fresh analysis that signals the beginning of a powerful new uptrend.
Years of excessive money printing have fueled what appears to be a massive incoming bull market—one that could surpass all previous trends in strength, thanks to the extraordinary liquidity injected into global markets.
We may be entering a modern-day “Roaring 20s 2.0,” but eventually, this cycle will run its course.
For now, the key is to capitalize on the opportunities ahead by making well-informed decisions.

Nasdaq100, DJIA & S&P500 - Quick technical analysisThe top three US indices are near their all-time highs. Will we see new all-time highs?
Let's take a look.
MARKETSCOM:US100
MARKETSCOM:US30
MARKETSCOM:US500
Let us know what you think in the comments below.
Thank you.
75.2% of retail investor accounts lose money when trading CFDs with this provider. You should consider whether you understand how CFDs work and whether you can afford to take the high risk of losing your money. Past performance is not necessarily indicative of future results. The value of investments may fall as well as rise and the investor may not get back the amount initially invested. This content is not intended for nor applicable to residents of the UK. Cryptocurrency CFDs and spread bets are restricted in the UK for all retail clients.

US30 | Geopolitics in Focus – Key Pivot at 44950US30 Overview
Geopolitics dominates before the Fed takes the stage.
Putin’s position remains that Ukraine should cede all territory Russia has occupied — and even areas it has failed to capture in more than three years of fighting. This has been firmly rejected by Zelenskiy and European leaders, who will be alongside him in Washington when he meets Trump later today.
Technical Outlook:
The price holds bearish momentum toward 44720 and 44610 as long as it trades below 44950.
A 4H close above 44950 would shift the bias bullish toward 45100 and 45285.
Support: 44720, 44610, 44470
Resistance: 45100, 45285
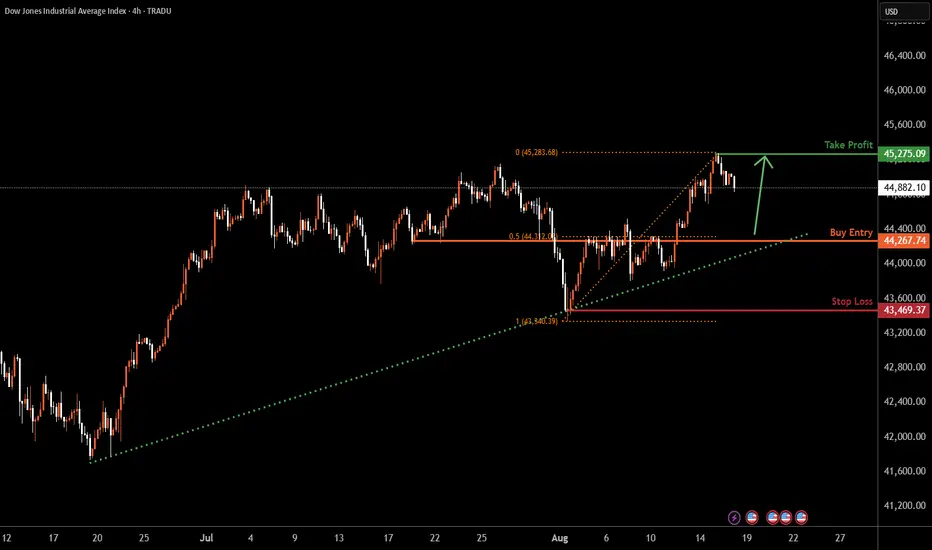
US30 H4 | Falling towards overlap supportDow Jones (US30) is falling towards the buy entry, which is an overlap support that lines up with the 50% Fibonacci retracement and could bounce from this level to the swing high.
Buy entry is at 44,267.74, which is an overlap support that lines up with the 50% Fibonacci retracement.
Stop loss is at 43,469.37, which is a swing low support.
Take profit is at 45,275.09, which is a swing high resistance.
High Risk Investment Warning
Trading Forex/CFDs on margin carries a high level of risk and may not be suitable for all investors. Leverage can work against you.
Stratos Markets Limited (tradu.com ):
CFDs are complex instruments and come with a high risk of losing money rapidly due to leverage. 65% of retail investor accounts lose money when trading CFDs with this provider. You should consider whether you understand how CFDs work and whether you can afford to take the high risk of losing your money.
Stratos Europe Ltd (tradu.com ):
CFDs are complex instruments and come with a high risk of losing money rapidly due to leverage. 66% of retail investor accounts lose money when trading CFDs with this provider. You should consider whether you understand how CFDs work and whether you can afford to take the high risk of losing your money.
Stratos Global LLC (tradu.com ):
Losses can exceed deposits.
Please be advised that the information presented on TradingView is provided to Tradu (‘Company’, ‘we’) by a third-party provider (‘TFA Global Pte Ltd’). Please be reminded that you are solely responsible for the trading decisions on your account. There is a very high degree of risk involved in trading. Any information and/or content is intended entirely for research, educational and informational purposes only and does not constitute investment or consultation advice or investment strategy. The information is not tailored to the investment needs of any specific person and therefore does not involve a consideration of any of the investment objectives, financial situation or needs of any viewer that may receive it. Kindly also note that past performance is not a reliable indicator of future results. Actual results may differ materially from those anticipated in forward-looking or past performance statements. We assume no liability as to the accuracy or completeness of any of the information and/or content provided herein and the Company cannot be held responsible for any omission, mistake nor for any loss or damage including without limitation to any loss of profit which may arise from reliance on any information supplied by TFA Global Pte Ltd.
The speaker(s) is neither an employee, agent nor representative of Tradu and is therefore acting independently. The opinions given are their own, constitute general market commentary, and do not constitute the opinion or advice of Tradu or any form of personal or investment advice. Tradu neither endorses nor guarantees offerings of third-party speakers, nor is Tradu responsible for the content, veracity or opinions of third-party speakers, presenters or participants.
Us30 technical analysis US30 sell technical analysis. At a good trend line breakout opportunity where the trend line is now acting as resistance. We should see a strong breakout movement here to the down side.
US30US30 still have some upside, wait for correction and look for buy setups.
Disclosure: We are part of Trade Nation's Influencer program and receive a monthly fee for using their TradingView charts in our analysis.

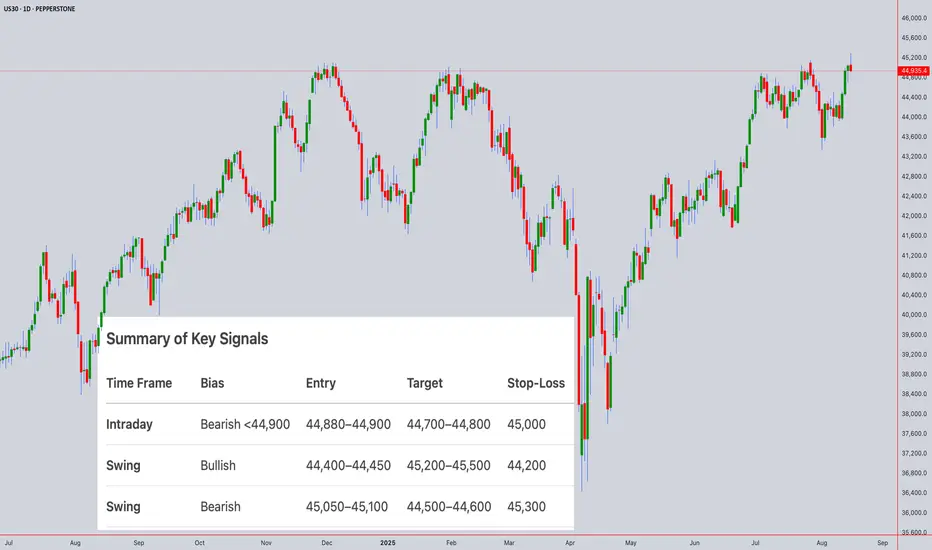
Technical Analysis for US30 (Dow Jones) Closing Price: 44,935.4 (16th Aug 2025, 12:50 PM UTC+4)
Analysis Methods: Japanese Candlesticks, Harmonic Patterns (ABCD, M/W), Elliott Wave, Wyckoff, Gann Theory (Time/Square of 9/Angles), Ichimoku, RSI, Bollinger Bands, VWAP, Moving Averages (MA/EMA/SMA/WMA).
1. Long-Term Trend (Weekly/Monthly)
Elliott Wave:
US30 is in Wave 5 of a bull cycle (Wave 3 peak: 45,500, Wave 4 correction to 42,800).
Target: 46,200–46,800 (1.618 extension of Wave 1).
Gann Price Forecasting:
Square of 9: √44,935.4 ≈ 212.00 →
Key resistance: 213² = 45,369, 214² = 45,796
Critical support: 211² = 44,521, 210² = 44,100
Break above 45,369 targets 46,000 (psychological level).
Ichimoku (Monthly):
Tenkan (9): 43,800 > Kijun (26): 43,200 → Bullish crossover.
Price above thick Senkou Span (42,500–43,000) – structural bullishness.
Moving Averages:
Weekly EMA(100): 43,000 (major trend support).
Swing Outlook: Bullish. Wave 5 targets 46,200–46,800.
2. Medium-Term Swing (4H/Daily)
Harmonic Patterns:
Bearish ABCD on Daily:
A: 45,200 → B: 44,300 → C: 44,900 → D: 45,050–45,150 (1.272 BC extension).
Bullish Crab (W Pattern) near 44,400 (0.886 XA retracement).
Wyckoff Phase:
Distribution above 44,900:
Upthrust rejection at 45,000 (16th Aug) on fading volume.
Weakness in rallies above 44,950.
Gann Theory:
Time Window: Aug 19–22 (Square of 9 reversal cluster).
Gann Angle: 1x1 support at 44,800 (45° angle from Aug 14 low).
Price-Time Squaring: 44,935 aligns with Aug 16 – consolidation expected.
Indicators:
RSI(14) + Bollinger Bands (Daily):
RSI: 65 (neutral-bullish, no divergence).
Price testing upper BB(20,2) at 45,050 → band expansion signals volatility.
VWAP (Weekly): 44,600 (swing support).
Swing Trade Setup:
Short near 45,050–45,150 → Target 44,500. Stop-loss: 45,300.
Long near 44,400 → Target 45,500. Stop-loss: 44,200.
3. Intraday Outlook (5M–4H)
Key Levels:
Resistance: 45,000 (psychological), 45,100 (Gann 1x1), 45,200 (ABCD target).
Support: 44,850 (VWAP), 44,750 (Ichimoku cloud), 44,600 (200-EMA).
Indicators:
Ichimoku (1H):
Tenkan: 44,920, Kijun: 44,860 → Price above both (short-term bullish).
Cloud: Bullish (44,780–44,840) – intraday support zone.
RSI + Bollinger Bands (4H):
RSI(14): 61 (neutral).
Price near mid-BB(20,2) at 44,900 → break below signals bearish momentum.
VWAP + MAs:
VWAP: 44,880 (intraday pivot).
EMA(20): 44,940 (resistance).
Candlestick Patterns:
4H Shooting Star at 45,000 → Bearish reversal signal.
1H Bearish Harami below 44,950 → Confirms selling pressure.
Gann Intraday Squaring:
Time Cycle: 14:00–16:00 UTC+4 (NY open) for volatility surge.
Price Harmony: Close below 44,900 targets 44,800 → 44,700.
Intraday Trade Plan:
Sell below 44,900 → Target 44,800 (VWAP) → 44,700 (Gann support).
Buy above 45,050 only if RSI <65 → Target 45,150.
Stop-Loss: 40–50 points.
Summary of Key Signals
Time Frame Bias Entry Target Stop-Loss
Intraday Bearish <44,900 44,880–44,900 44,700–44,800 45,000
Swing Bullish 44,400–44,450 45,200–45,500 44,200
Swing Bearish 45,050–45,100 44,500–44,600 45,300
Critical Events:
Gann Reversal Window: Aug 19–22 (watch for Fed minutes/retail data).
Daily Close >45,200 invalidates bearish patterns and targets 45,796.
Risk Note: US30 is sensitive to Dow components’ earnings and USD moves. Use tight stops during NY session.
For those interested in further developing their trading skills based on these types of analyses, consider exploring the mentoring program offered by Shunya dot Trade.(world wide web shunya dot trade)
I welcome your feedback on this analysis, as it will inform and enhance my future work.
Regards,
Shunya.Trade
world wide web shunya dot trade
⚠️ Disclaimer: This post is educational content and does not constitute investment advice, financial advice, or trading recommendations. The views expressed here are based on technical analysis and are shared solely for informational purposes. The stock market is subject to risks, including capital loss, and readers should exercise due diligence before investing. We do not take responsibility for decisions made based on this content. Consult a certified financial advisor for personalized guidance.
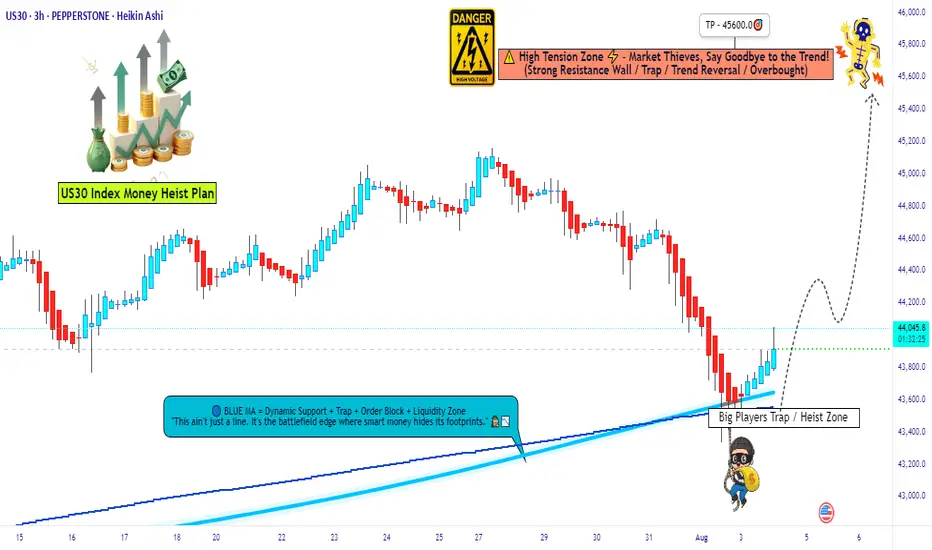
Heist Alert: Dow 30 Bullish Surge Incoming – Lock In Targets🦹♂️💎 “US30 Gold Vault Heist” – Thief’s Bullish Break-In Plan! 🚨📈
(Brought to you by Thief Trader – Layered Entry. Zero Mercy. Big Bags.)
🌍 Welcome to the Heist Floor, Global Market Bandits!
🎯 US30 is the next vault on the hitlist – and we’re going in loud but calculated.
💣 The Setup: Bullish Raid in Progress!
The Thief has eyes on Wall Street's armored vault — US30 Index — gearing up for a multi-layered bullish assault.
💼 Using limit orders like C4 on the door hinges, we’re stacking precise entries for maximum loot extraction. This isn’t gambling — this is organized market crime.
🔓 Entry Protocol – Any Price Level Is Breachable
🪜 Layered Limit Orders: Entry at any market level, multiple orders spread like a thief’s toolkit.
No sniper candle required — we work the shadows and stack with precision.
(Use the 15m-1H TF to tighten your strike zone.)
🛑 Stop Loss – The Getaway Hatch
📍 SL parked at 43300.0 – if the mission fails, we vanish clean.
No chasing losses — the next heist awaits.
📈 Take Profit – The Loot Vault
🎯 Target: 45600
That’s the gold room, the top floor, the getaway car location.
Use trailing SLs to secure the bag mid-run if resistance agents start showing up.
🧠 Behind the Heist – What’s Fueling This Move?
Global risk-on tone? ✅
Dow futures resilience? ✅
Thief’s sentiment meter flashing GREEN? ✅
Index rebalancing & sector flow favoring bulls? ✅
We don’t just trade the chart. We rob the macro narrative.
🚫 News Caution – No Sudden Sirens
Avoid entering during red folder data drops or FOMC speeches.
Stay ghosted. Let the volatility settle, then strike. 🕵️♂️
💥 Smash the BOOST Button 💖 If You’re With the Crew!
Let’s run this like a proper cartel of information — share it, save it, tag your trader circle.
Every like supports the next robbery plan.
No signals. No fluff. Just pure market exploitation.
📌 Disclaimer: Educational analysis only. No financial advice. Manage your risk like a true thief — never expose the whole bag.
💼📊 Thief Trader Out — More heist maps coming soon.
🔐 Rob Smart. Stack Heavy. Run Fast. 🦹♂️💸📈
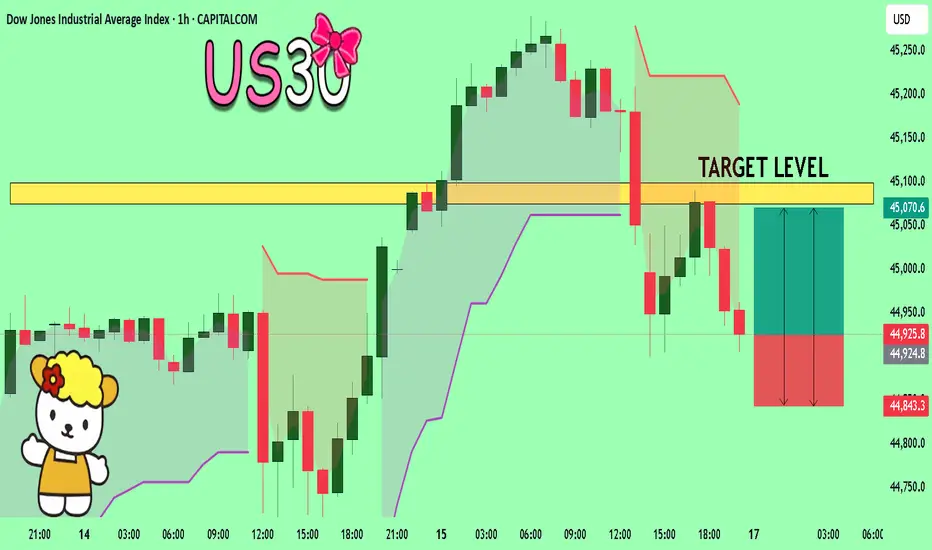
US30 Set To Grow! BUY!
My dear followers,
I analysed this chart on US30 and concluded the following:
The market is trading on 44925 pivot level.
Bias - Bullish
Technical Indicators: Both Super Trend & Pivot HL indicate a highly probable Bullish continuation.
Target - 45074
Safe Stop Loss - 44843
About Used Indicators:
A super-trend indicator is plotted on either above or below the closing price to signal a buy or sell. The indicator changes color, based on whether or not you should be buying. If the super-trend indicator moves below the closing price, the indicator turns green, and it signals an entry point or points to buy.
Disclosure: I am part of Trade Nation's Influencer program and receive a monthly fee for using their TradingView charts in my analysis.
———————————
WISH YOU ALL LUCK
Us30 sell opportunity Us30 price reached all time high. Price is at resistance levels. Price should continue down to support levels. Sniper entry here.

My analysis on us30 possible move upUs30 possible move up to the high of the 30 min timeframe just my analysis not a signal
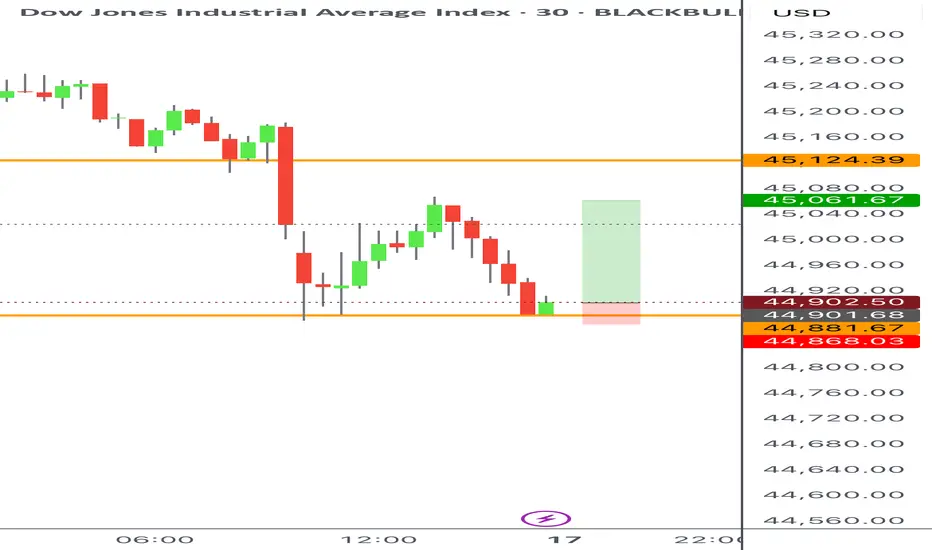
US30 - potential head and shoulders on 30min chartWatching the US30Cash for a potential short setup.
A head and shoulders pattern may be forming on the 30-minute timeframe. I’m still waiting for confirmation on some key variables before entering the trade.
Trade Details:
📊 Risk/Reward: 2.7
🎯 Entry: 45 224
🛑 Stop Loss: 45 261
💰 Take Profit 1 (50%): 45 141
💰 Take Profit 2 (50%): 45 084
Thanks for checking out my post! Make sure to follow me to catch the next update. If you found this helpful, give it a like 👍 and share your thoughts 💬 — I’d love to hear what you think!
Please note: This is not financial advice. This content is to track my trading journey and for educational purposes only.

DowJones uptrend supported at 44380Key Support and Resistance Levels
Resistance Level 1: 45400
Resistance Level 2: 45660
Resistance Level 3: 46000
Support Level 1: 44380
Support Level 2: 44080
Support Level 3: 43675
This communication is for informational purposes only and should not be viewed as any form of recommendation as to a particular course of action or as investment advice. It is not intended as an offer or solicitation for the purchase or sale of any financial instrument or as an official confirmation of any transaction. Opinions, estimates and assumptions expressed herein are made as of the date of this communication and are subject to change without notice. This communication has been prepared based upon information, including market prices, data and other information, believed to be reliable; however, Trade Nation does not warrant its completeness or accuracy. All market prices and market data contained in or attached to this communication are indicative and subject to change without notice.

US30 Long Position US30 has broken passed the major resistance level at $45000 finally and is currently priced at $45200. The Bullish trend from the past week has created strong bullish confluences with price trading above the 21 and 50 day Moving Averages and in the bullish region of the RSI, expecting further upside potential.
With the break of the $45000 barrier, we can expect price to retrace and test this point sometime in the future and with that see a bounce from this level with the resistance turning support.
Will also be looking at other keys levels such as $44980 and $44730 should price have a deep retracement before the bullish trend resumes.

Will The Prospect of Fed Rate Cuts Continue to Support US30?Fundamental approach:
- US30 has been pushing toward a fresh high this week, aided by softer CPI and growing confidence in a Sep Fed cut. On Wed, it was within about 1% of a record and posted substantial gains earlier in the week.
- The US Jul PPI rose 0.9% MoM and 3.3% YoY, well above forecasts, reviving tariff-driven inflation worries and pressuring cyclicals. Earlier CPI relief had supported a midweek bounce and fresh risk-on tone in parts of the market. Headlines flagged mixed mega-cap moves, and Dow heavies like Apple (AAPL) and Caterpillar (CAT) fluctuated with growth and trade sensitivity as traders reassessed the rate path.
- US30 could remain supportive as markets weigh amid Fed policy expectations that could shift based on next week's flash PMIs and further data signals on pricing and activity. Traders may also react to guidance updates and sector rotations if inflation surprises persist, potentially delaying aggressive easing prospects.
Technical approach:
- US30 created a new swing high, closing above the resistance at 45000. The index is above both EMAs, indicating upward momentum.
- If US30 remains above 45000, it may approach the 100% Fibonacci Extension at around 46670.
- On the contrary, staying below 45000 may prompt a retest of the EMA21 and the ascending channels' lower bound.
Analysis by: Dat Tong, Senior Financial Markets Strategist at Exness

US30 Risky Long!
HI,Traders !
#US30 is trading in an uptrend
So despite a local correction
We are bullish biased and
As we are already seeing
A bullish rebound from the
Local horizontal support
Of 43885.9 a further
Bullish move up is
To be expected !
Comment and subscribe to help us grow !

DowJones bullish breakout support at 44380Key Support and Resistance Levels
Resistance Level 1: 45080
Resistance Level 2: 45400
Resistance Level 3: 45660
Support Level 1: 44380
Support Level 2: 44077
Support Level 3: 43675
This communication is for informational purposes only and should not be viewed as any form of recommendation as to a particular course of action or as investment advice. It is not intended as an offer or solicitation for the purchase or sale of any financial instrument or as an official confirmation of any transaction. Opinions, estimates and assumptions expressed herein are made as of the date of this communication and are subject to change without notice. This communication has been prepared based upon information, including market prices, data and other information, believed to be reliable; however, Trade Nation does not warrant its completeness or accuracy. All market prices and market data contained in or attached to this communication are indicative and subject to change without notice.
