Daily Analysis: Nifty 12-01-2026Nifty remains weak with a controlled selling pressure. Prices right now is between no trade zone
All major levels are mentioned and explained.
Dailyanalysis

TradeCityPro | Bitcoin Daily Analysis #258👋 Welcome to TradeCityPro!
Let’s move on to the Bitcoin analysis, today the market is going through a correction.
⏳ 4-hour timeframe
On the 4-hour timeframe, after Bitcoin reached the 94478 resistance, it entered a corrective phase and its bullish momentum decreased significantly.
✔️ In the first corrective leg, price retraced to the 0.382 Fibonacci level, and since then it has retraced down to the 0.618 level.
💥 The 0.618 Fibonacci area overlaps with 90373, forming a strong PRZ. If Bitcoin’s next bullish wave is going to start, price can build a bottom here and begin its upward move.
✨ If the correction extends further, the next support is 89040. If this level is also lost, price can move down toward the main low at 86855, in which case the entire bullish move we had so far becomes a fakeout.
🔔 If price finds support right here at 90373, we can open a long position after the structural break that Bitcoin creates. The main confirmation for the start of the next bullish wave will be the break of 94478.
🎲 For a short position, I will wait until price stabilizes below 90373, and then I will look for a trigger.
❌ Disclaimer ❌
Trading futures is highly risky and dangerous. If you're not an expert, these triggers may not be suitable for you. You should first learn risk and capital management. You can also use the educational content from this channel.
Finally, these triggers reflect my personal opinions on price action, and the market may move completely against this analysis. So, do your own research before opening any position.

AUDUSD — FRGNT DAILY CHART FORECAST Q1 | D8 | W1 | Y26📅 Q1 | D8 | W1 | Y26
📊 AUDUSD — FRGNT DAILY CHART FORECAST
🔍 Analysis Approach
I’m applying a developed version of Smart Money Concepts, with a structured focus on:
• Identifying Key Points of Interest (POIs) on Higher Time Frames (HTFs) 🕰️
• Using those POIs to define a clear and controlled trading range 📐
• Refining those zones on Lower Time Frames (LTFs) 🔎
• Waiting for a Break of Structure (BoS) as confirmation ✅
This process keeps me precise, disciplined, and aligned with market narrative, rather than reacting emotionally or chasing price.
💡 My Motto
“Capital management, discipline, and consistency in your trading edge.”
A positive risk-to-reward ratio, combined with a high-probability execution model, is the backbone of any sustainable trading plan 📈🔐
⚠️ On Losses
Losses are part of the mathematical reality of trading 🎲
They don’t define you — they are necessary, expected, and managed.
We acknowledge them, learn, and move forward 📊➡️
🙏 I appreciate you taking the time to review my Daily Forecast.
Further context and supporting material can be found in the Links section.
Stay sharp 🧠
Stay consistent 🎯
Protect your capital 🔐
— FRGNT 🚀📈
FX:AUDUSD

TradeCityPro | Bitcoin Daily Analysis #257👋 Welcome to TradeCityPro!
Let’s move on to Bitcoin analysis. The strong bullish trend of Bitcoin is still continuing.
⏳ 1-hour timeframe
Bitcoin is still continuing its bullish trend, and yesterday, after breaking 93,149, it continued its move up to 94,478.
🔔 At the moment, after a pullback to the 93,149 area, Bitcoin is once again moving toward 94,478.
📊 Buy volume has not increased significantly yet, and in my opinion, if the price is going to break 94,478, buy volume also needs to increase.
🧮 For now, we can consider the break of 94,478 as a trigger for opening a long position. In my opinion, as long as the price stays above 93,149, this trigger is a very good one for long positions.
⛏ However, if the price consolidates below 93,149, we will get confirmation of the end of the bullish wave, and in that case, Bitcoin can correct down to lower areas such as 91,585 and 91,118.
💥 For a trend change, after the price consolidates below 93,149, we can get confirmation of a bearish trend in Bitcoin by forming lower highs and lower lows based on Dow Theory.
❌ Disclaimer ❌
Trading futures is highly risky and dangerous. If you're not an expert, these triggers may not be suitable for you. You should first learn risk and capital management. You can also use the educational content from this channel.
Finally, these triggers reflect my personal opinions on price action, and the market may move completely against this analysis. So, do your own research before opening any position.

XAU/USD 05 January 2026 Intraday AnalysisH4 Analysis:
-> Swing: Bullish.
-> Internal: Bullish.
Price has printed according to my analysis dated 20 October 2025 where I mentioned price will continue bearish, react at either discount of 50% internal EQ, or H4 supply zone before targeting weak internal high priced at 4,380.990.
Price has printed new highs followed by a bearish CHoCH and is currently trading within an established internal range.
Intraday expectation:
Price to continue bearish, react at either discount of 50% internal EQ, or H4 supply zone before targeting weak internal high priced at 4,550.150
Note:
The Federal Reserve’s renewed easing cycle, alongside a weaker U.S. dollar and persistent geopolitical tensions, continues to drive volatility in the gold market.
Traders should remain cautious and adjust risk management strategies to navigate sharp price swings.
Additionally, gold pricing is highly sensitive to U.S. policy under President Trump, where tariff measures, fiscal uncertainty, and shifting geopolitical strategy amplify market repricing risks and reinforce safe‑haven demand.
H4 Chart:
M15 Analysis:
-> Swing: Bullish.
-> Internal: Bearish.
Since my last analysis, price has printed several bullish iBOS' and bullish BOS which was in accordance to my analysis.
Price has since printed a bearish iBOS, which was to be expected due to all HTF's requiring a pullback.
Price is currently trading within and internal low and swing high.
Intraday expectation:
Price to trade up to either M15 or H4 supply zone, or premium of 50% internal EQ before targeting weak internal low, priced at 4,274.025.
Note:
Gold continues to exhibit elevated volatility as markets digest the Federal Reserve’s ongoing dovish tilt and persistent global geopolitical tensions.
With uncertainty remaining a dominant theme across global risk assets, traders should prioritise disciplined risk management, as abrupt price swings and liquidity pockets may become increasingly common.
Furthermore, recent tariff announcements from President Trump, particularly those directed at China, have added another layer of instability to the macro landscape. These policy developments have the potential to intensify market turbulence, heighten risk‑off flows, and trigger sharp intraday reversals or whipsaw‑like behaviour in gold.
M15 Chart:

TradeCityPro | Bitcoin Daily Analysis #256👋 Welcome to TradeCity Pro!
Let’s move on to Bitcoin analysis. The market trend has started, and long triggers are being activated one after another.
⏳ 1-hour timeframe
Yesterday, Bitcoin made another bullish leg, and after breaking 89,040 and 90,373, it also activated the next trigger at 91,585.
✔️ At the moment, the zone Bitcoin has reacted to is 93,026, but the main resistance is located at 94,157.
📊 So far, we have had three entry points on Bitcoin, all of which are in profit, and from now on, any new entry on Bitcoin will be much riskier.
⚡️ For now, we can move our stop-losses up to the previous low at 91,118, and for taking profit, the next suitable zone would be 94,157.
↗️ For a new position, we can consider the break of 93,026 as a trigger, but the key point is that we have a major resistance at 94,157, which lies before Bitcoin reaches its target and can prevent this bullish wave from continuing, pushing the price into a correction.
🎲 For this reason, in my opinion, the 93,026 trigger is not very attractive and is quite risky, and personally, until 94,157 is broken, I won’t open any new positions on Bitcoin using another trigger.
🔽 As for short positions, the situation is completely clear: for now, we need to wait until a trend change occurs and a bearish structure is formed, and only then look for short triggers.
❌ Disclaimer ❌
Trading futures is highly risky and dangerous. If you're not an expert, these triggers may not be suitable for you. You should first learn risk and capital management. You can also use the educational content from this channel.
Finally, these triggers reflect my personal opinions on price action, and the market may move completely against this analysis. So, do your own research before opening any position.

EURUSD FRGNT DAILY CHART FORECAST - Q1 | D5 | W1 | Y26📅 Q1 | D5 | W1 | Y26
📊 EURUSD — FRGNT DAILY CHART FORECAST
🔍 Analysis Approach
I’m applying a developed version of Smart Money Concepts, with a structured focus on:
• Identifying Key Points of Interest (POIs) on Higher Time Frames (HTFs) 🕰️
• Using those POIs to define a clear and controlled trading range 📐
• Refining those zones on Lower Time Frames (LTFs) 🔎
• Waiting for a Break of Structure (BoS) as confirmation ✅
This process keeps me precise, disciplined, and aligned with market narrative, rather than reacting emotionally or chasing price.
💡 My Motto
“Capital management, discipline, and consistency in your trading edge.”
A positive risk-to-reward ratio, combined with a high-probability execution model, is the backbone of any sustainable trading plan 📈🔐
⚠️ On Losses
Losses are part of the mathematical reality of trading 🎲
They don’t define you — they are necessary, expected, and managed.
We acknowledge them, learn, and move forward 📊➡️
🙏 I appreciate you taking the time to review my Daily Forecast.
Further context and supporting material can be found in the Links section.
Stay sharp 🧠
Stay consistent 🎯
Protect your capital 🔐
— FRGNT 🚀📈🔥
VISIT WWW.FRGNTFOREX.COM FOR MORE !
FX:EURUSD

Daily Analysis: Nifty 05/01/2026This week's outlook for Nifty50. Prices are showing bullish signals, also GiftNifty trading higher than last session.
The monthly outlook will be shared later with few more details.

TradeCityPro | Bitcoin Daily Analysis #255👋 Welcome to TradeCity Pro!
Let’s move on to Bitcoin analysis. The market has finally started a trend and can give us trading opportunities.
⏳ 1-hour timeframe
On Bitcoin, we had two entry points. The first was the break of 89,040, and the second was the break of 90,373.
⚖️ If you opened a position with either of these triggers, your position is now in profit and you can take profit.
💥 At the moment, Bitcoin is dealing with the 91,585 zone, and given the bullish momentum present in the market, the probability of breaking this level is high.
✨ In case 91,585 breaks, we can open a long position. This trigger will be riskier compared to the previous triggers we had.
💡 For now, Bitcoin’s trend on the LWC has turned bullish, and this trend can continue. However, if the move turns out to be a fake and price stabilizes below 90,373, we can take confirmation of a bearish shift in price.
📊 In that case, we can look for short triggers, but until then, I am not focusing on short positions for now.
❌ Disclaimer ❌
Trading futures is highly risky and dangerous. If you're not an expert, these triggers may not be suitable for you. You should first learn risk and capital management. You can also use the educational content from this channel.
Finally, these triggers reflect my personal opinions on price action, and the market may move completely against this analysis. So, do your own research before opening any position.

TradeCityPro | Bitcoin Daily Analysis #254👋 Welcome to TradeCity Pro!
Let’s move on to Bitcoin analysis. The market is finally starting its move.
⏳ 1-hour timeframe
After Bitcoin broke the 89,040 zone yesterday and managed to stabilize above it, it has now reached its main resistance.
✨ This main resistance is located at 90,373, and so far, on this timeframe, the price has touched it twice.
💡 After reaching 90,373, volume has decreased and the price is currently resting.
💥 However, if volume increases again, given the bullish momentum that has entered the market, the probability of breaking 90,373 increases.
✔️ So, with the break of 90,373, we can open a long position.The next resistance zone for Bitcoin will be 93,789.
🧩 But if Bitcoin gets rejected from 90,373, we can open positions using trend change and Dow Theory triggers.
⭐ The triggers we currently have as the main triggers for Bitcoin turning bearish are the 87,345 and 86,855 zones.
❌ Disclaimer ❌
Trading futures is highly risky and dangerous. If you're not an expert, these triggers may not be suitable for you. You should first learn risk and capital management. You can also use the educational content from this channel.
Finally, these triggers reflect my personal opinions on price action, and the market may move completely against this analysis. So, do your own research before opening any position.

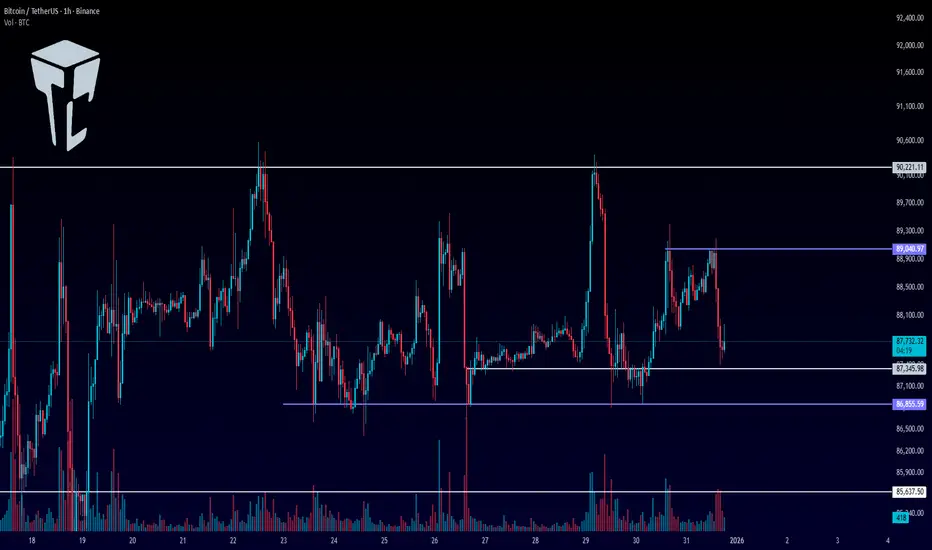
TradeCityPro | Bitcoin Daily Analysis #253👋 Welcome to TradeCity Pro!
Happy New Year — let’s move on to the first Bitcoin analysis of 2026!
⏳ 4-hour timeframe
Since mid-December, Bitcoin has formed a small range box inside its larger range box.
✨ The top of this range is 90,221 and the bottom is 86,855, and since we are in the Christmas and New Year period with low volume, the price has not broken this box yet.
✔️ The main triggers for Bitcoin to start a trend are the break of 93,789 or 84,509, and if these zones break, the price can begin a long-term trend.
📊 However, we also have two other triggers, which are 86,855 and 90,221.
🔔 If 86,855 breaks, bearish momentum will enter the market, and Bitcoin can move toward 84,509 or even 82,214.
💥 For a bullish move, breaking 90,221 can bring bullish momentum into the market, and with its break, the price can move toward 93,789.
🎲 Overall, the market is still ranging and Bitcoin is not offering many clear positions, but it’s important to stay behind the chart, because if a move starts, we can catch a very good profit on future positions.
❌ Disclaimer ❌
Trading futures is highly risky and dangerous. If you're not an expert, these triggers may not be suitable for you. You should first learn risk and capital management. You can also use the educational content from this channel.
Finally, these triggers reflect my personal opinions on price action, and the market may move completely against this analysis. So, do your own research before opening any position.

TradeCityPro | Bitcoin Daily Analysis #252👋 Welcome to TradeCity Pro!
Let’s move on to Bitcoin analysis. The market is still ranging — even on New Year’s Eve!
⏳ 1-hour timeframe
Bitcoin is still inside the range box it has been in over the past period and is fluctuating within this zone.
✔️ A high that formed for Bitcoin yesterday, which was tested twice, is the 89,040 area, and we can use it as a trigger today.
⚖️ If 89,040 breaks, we can open a very risky long position.The main trigger is still the break of 90,221.
✨ For shorts, our triggers have not changed compared to before.The breaks of 87,345 and 86,855 are both suitable triggers for short positions.
💥 The main short trigger on Bitcoin is 85,637.Given the low volume, I think until the Christmas holidays are over, the market won’t have any major moves. However, it’s very important to stay behind the chart so that we can open positions if the main triggers get
❌ Disclaimer ❌
Trading futures is highly risky and dangerous. If you're not an expert, these triggers may not be suitable for you. You should first learn risk and capital management. You can also use the educational content from this channel.
Finally, these triggers reflect my personal opinions on price action, and the market may move completely against this analysis. So, do your own research before opening any position.
TradeCityPro | Bitcoin Daily Analysis #251👋 Welcome to TradeCity Pro!
Let’s move on to Bitcoin analysis. Bitcoin is still ranging, and the longer this ranging continues, the higher the probability of a move starting.
⏳ 1-hour timeframe
Yesterday, Bitcoin was supported from the support zone that had formed between 86,855 and 87,355, and currently, with increasing volume, it is moving upward.
✔️ Yesterday, with the break of 87,345, we could open a risky short position on Bitcoin, but the price was supported from 86,855 and started an upward move.
✨ Currently, the price is still inside the same range box between 86,855 and 90,221, with the difference that volume has increased with the start of the new week.
🔔 Bitcoin’s triggers have not changed yet, and we can still open a short position with the break of 86,855 and a long position with the break of 90,221.
🧩 For now, whatever trigger the market gives, I open short-term positions with it and take profits quickly.
🎯 If, along with the break of triggers, volume also increases, the probability of the move continuing increases, and we can open long-term positions as well by breaking the next triggers.
❌ Disclaimer ❌
Trading futures is highly risky and dangerous. If you're not an expert, these triggers may not be suitable for you. You should first learn risk and capital management. You can also use the educational content from this channel.
Finally, these triggers reflect my personal opinions on price action, and the market may move completely against this analysis. So, do your own research before opening any position.

TradeCityPro | Bitcoin Daily Analysis #250👋 Welcome to TradeCity Pro!
Let’s move on to Bitcoin analysis. Today is the first day of the week, and with the start of the new week, Bitcoin has shown some volatility today.
⏳ 1-hour timeframe
Yesterday, we had two temporary resistance zones on Bitcoin that the price did not react to at all, and with a sharp move it went toward 90,221, and then after getting rejected from this zone, it again dropped sharply down to 87,345.
📊 The volume of both moves was high, but the number of strong red candles was much higher, so it can be said that the selling power is stronger.
✔️ On the other hand, the market momentum is currently bearish, and if the 87,345 or 86,855 zones break, the price can move downward.
⚡️ So, the break of 87,345 can be used as a risky short trigger, and the break of 86,855 as a more reliable short trigger.The main trigger for Bitcoin turning bearish is still 85,637.
💡 But if Bitcoin gets supported from this area between 87,345 and 86,855, the price can move back toward 90,221, and if this zone breaks, it can start a bullish move.
⚖️ So, with the break of 90,221, we can open a long position.Breaking this zone will be the first confirmation of Bitcoin turning bullish.
❌ Disclaimer ❌
Trading futures is highly risky and dangerous. If you're not an expert, these triggers may not be suitable for you. You should first learn risk and capital management. You can also use the educational content from this channel.
Finally, these triggers reflect my personal opinions on price action, and the market may move completely against this analysis. So, do your own research before opening any position.

TradeCityPro | Bitcoin Daily Analysis #249👋 Welcome to TradeCity Pro!
Let’s move on to Bitcoin analysis. Today is the last day of the week, and the market is still ranging.
⏳ 1-hour timeframe
Bitcoin is still ranging, and yesterday it formed a new low.
✔️ The previous low on Bitcoin was at the 86,855 zone, which the price was supported from, and now it has formed a higher low at 87,345.
💡 The resistance zones above the price are 88,376 and 89,199.
⚡️ These zones do not have strong supply and demand significance, and if the market trend is going to start, in my opinion they won’t be able to stop the price movement.
🎯 The main zones right now are 85,637 and 90,221.As long as the price is between these two zones, any position we open is risky and profits should be taken quickly.
✨ We will get confirmation of the start of the next Bitcoin move with stabilization below 85,637 or above 90,221.Breaking these two zones are triggers that I try to open positions with.
⚖️ Until then, we can open short-term, very low-risk positions.with breaks of 87,345 and 86,655 for shorts, and with breaks of 88,376 and 89,199 for longs.
❌ Disclaimer ❌
Trading futures is highly risky and dangerous. If you're not an expert, these triggers may not be suitable for you. You should first learn risk and capital management. You can also use the educational content from this channel.
Finally, these triggers reflect my personal opinions on price action, and the market may move completely against this analysis. So, do your own research before opening any position.

TradeCityPro | Bitcoin Daily Analysis #248👋 Welcome to TradeCity Pro!
Let’s move on to Bitcoin analysis. After a few days without posting an analysis, let’s take a look at Bitcoin and see what the market has been doing during this time.
⏳ 4-hour timeframe
On the 4-hour timeframe, Bitcoin hasn’t shown any major difference compared to our previous analysis and is still inside the same large range box between 84,500 and 93,789.
✔️ Since Bitcoin has been inside this box for a long time, additional support and resistance levels have also formed within the range.
💡 Currently, the price has formed a smaller range between 86,555 and 90,018, and it is fluctuating between these two zones with very low volume.
⭐ Since Bitcoin’s previous low was recorded at 84,500, if the price gets supported at 86,555 and forms a higher low compared to 84,500, the probability of breaking 90,018 will increase significantly.
🎯 If 90,018 breaks, bullish momentum can enter the market, and if this momentum comes along with increased volume, Bitcoin can also break the next resistance zones such as 93,789 and 96,476.
⚡️ With the break of 93,789, we can get confirmation of Bitcoin turning bullish. But before that, any long position that gets opened, I personally take profits quickly, because there is no strong momentum in the market.
🔔 For short positions, the triggers we currently have are 86,855 and 84,500.Price stabilization below 84,500 will confirm Bitcoin turning bearish.
❌ Disclaimer ❌
Trading futures is highly risky and dangerous. If you're not an expert, these triggers may not be suitable for you. You should first learn risk and capital management. You can also use the educational content from this channel.
Finally, these triggers reflect my personal opinions on price action, and the market may move completely against this analysis. So, do your own research before opening any position.

GBPUSD at wait-and-react area.Price just pushed higher aggressively. That move corrected a large portion of the prior bearish leg. And just tapped back into a major resistance zone. This is a key decision point.
At this level, I’m not interested in chasing longs. Price is extended into resistance. So, if buyers fail to hold above this zone and price starts to stall, I expect price to reach 1.3337.
For longs to remain valid, price must hold above the zone and build structure. Without that, upside continuation is weak.
Until one side clearly proves control, this remains a wait-and-react area.
Trade safely and enjoy the Cosmic Journey recap TradingView rolled out this year.
www.tradingview.com

TradeCityPro | Bitcoin Daily Analysis #247👋 Welcome to TradeCity Pro!
Let’s move on to Bitcoin analysis; the market hasn’t changed much since yesterday and is still ranging.
⏳ 1-Hour Timeframe
Bitcoin is still in the range box between 89,849 and 90,590, and just like yesterday, it is fluctuating between these two zones today.
✔️ Today, the probability of movement during the New York session is high because Bitcoin is in a very small compression, and breaking this compression from either side can give us a position.
📊 Volume has decreased even further since yesterday, and this is another sign that a move is close. So, if volume enters and triggers are activated, a sharp move in Bitcoin could begin.
⭐ Today, we can open a short position after breaking the 89,849 zone.
🎲 The main short trigger is still 88,890, and breaking 89,849 will be the precursor to that.
↗️ For a long position, breaking 90,590 is a good trigger.We will get the main confirmation of Bitcoin turning bullish after a stabilization above 92,942 and 94,167.
💧 Today, any movement Bitcoin makes in either direction, if accompanied by increased volume, could continue.
✨ But if we see volume divergence, the likelihood of a fakeout increases.
❌ Disclaimer ❌
Trading futures is highly risky and dangerous. If you're not an expert, these triggers may not be suitable for you. You should first learn risk and capital management. You can also use the educational content from this channel.
Finally, these triggers reflect my personal opinions on price action, and the market may move completely against this analysis. So, do your own research before opening any position.

TradeCityPro | Bitcoin Daily Analysis #246👋 Welcome to TradeCity Pro!
Let’s move on to Bitcoin analysis. The market has been ranging for a few days, but it still gives positions, and if we stay behind the chart, we can make profits from the market.
⏳ 1-hour timeframe
On the 1-hour timeframe, Bitcoin has formed a range box between the 88890 and 94167 zones, and for several days it has been moving between these two areas.
✔️ Currently, near the bottom of the box, the price has created a smaller range between 89849 and 90590, and since today is Saturday and volume is low, it is ranging between these two zones.
💥 If the price exits this box, the next move can continue toward either the top or the bottom of the main box.
🔔 That means with a break of 89849, the move can continue down toward 88890.
🎲 But if 90590 breaks, I will wait for a higher low and higher high to form above this zone, and then I will enter a long position.
⛏ The next resistance zones for Bitcoin are 92942 and 94167.
🧩 We get confirmation of Bitcoin turning bullish with a break of 94167. In that case, an upward move in higher cycles can begin.
⭐ On the other hand, if the price stabilizes below 88890, it can move again toward the 84000 support.
❌ Disclaimer ❌
Trading futures is highly risky and dangerous. If you're not an expert, these triggers may not be suitable for you. You should first learn risk and capital management. You can also use the educational content from this channel.
Finally, these triggers reflect my personal opinions on price action, and the market may move completely against this analysis. So, do your own research before opening any position.

TradeCityPro | Bitcoin Daily Analysis #245👋 Welcome to TradeCity Pro!
Let’s move on to the Bitcoin analysis. After the fake move we had yesterday, today Bitcoin has entered a ranging box.
⏳ 1-hour timeframe
Yesterday on Bitcoin we had a trigger at the 91447 zone that we could use as a long trigger.
🎯 Before that, we also had a trigger on Bitcoin at 89849 which had been activated, and with the break of 91447 the second trigger was also activated.
🎲 After this trigger was activated, given the trend weakness we had on Bitcoin, the price could not stabilize above 91447, and with that move being faked, it dropped again to 89849.
⛏ The 89849 zone is an important support area on Bitcoin, and the next support we have on Bitcoin is 88890.
✔️ Considering that Bitcoin has faked both the 89849 low and the 91447 high once, we can say currently there is no specific trend in the market, and we can open both short and long positions.
📊 For a long position, again we can enter with the break of 91447 and open our position.
✔️ In case the market drops, we have two short triggers:
the first is 89849 and the second is 88890, and by breaking either of them we can have a trigger for a short.
❌ Disclaimer ❌
Trading futures is highly risky and dangerous. If you're not an expert, these triggers may not be suitable for you. You should first learn risk and capital management. You can also use the educational content from this channel.
Finally, these triggers reflect my personal opinions on price action, and the market may move completely against this analysis. So, do your own research before opening any position.

AUDUSD FRGNT DAILY FORECAST -Q4 | W50 | D9 | Y25 |📅 Q4 | W50 | D9 | Y25 |
📊 AUDUSD FRGNT DAILY FORECAST
🔍 Analysis Approach:
I’m applying Smart Money Concepts, focusing on:
Identifying Points of Interest on the Higher Time Frames (HTFs) 🕰️
Using those POIs to define a clear trading range 📐
Refining those zones on Lower Time Frames (LTFs) 🔎
Waiting for a Break of Structure (BoS) for confirmation ✅
This method allows me to stay precise, disciplined, and aligned with the market narrative, rather than chasing price.
💡 My Motto:
"Capital management, discipline, and consistency in your trading edge."
A positive risk-to-reward ratio, paired with a high win rate, is the backbone of any solid trading plan 📈🔐
⚠️ Losses?
They’re part of the mathematical game of trading 🎲
They don’t define you — they’re necessary, they happen, and we move forward 📊➡️
🙏 I appreciate you taking the time to review my Daily Forecast.
Stay sharp, stay consistent, and protect your capital
— FRNGT 🚀
FX:AUDUSD

GBPUSD Falling wedge pattern..Wedge patterns are commonly used by traders to gets profits . A perfect wedge pattern is established in 1 hour time frame, if it breaks upwards go for bullish ..
⚠️ Disclaimer:
This setup is shared for educational purposes only. It is not financial advice. Always do your own analysis and apply proper risk management before trading any setup.$
